HAL Id: hal-01727407
https://hal.insa-toulouse.fr/hal-01727407
Submitted on 13 Jun 2019
HAL is a multi-disciplinary open access archive for the deposit and dissemination of sci-entific research documents, whether they are pub-lished or not. The documents may come from teaching and research institutions in France or abroad, or from public or private research centers.
L’archive ouverte pluridisciplinaire HAL, est destinée au dépôt et à la diffusion de documents scientifiques de niveau recherche, publiés ou non, émanant des établissements d’enseignement et de recherche français ou étrangers, des laboratoires publics ou privés.
Concrete beams submitted to various moisture
environments
Stéphane Multon, Jf Seignol, François Toutlemonde
To cite this version:
Stéphane Multon, Jf Seignol, François Toutlemonde. Concrete beams submitted to various moisture environments. Structural Engineering and Mechanics, Techno-press Ltd, 2006, 22 (1), pp.71–83. �10.12989/sem.2006.22.1.071�. �hal-01727407�
Concrete beams submitted to various moisture environments
S. Multon1, J-F. Seignol2 and F. Toutlemonde21. Laboratoire Matériaux et Durabilité des Constructions – 135, Avenue de Rangueil – 31077 Toulouse Cedex 4 – France – E-mail: [email protected]
2. Laboratoire Central des Ponts et Chaussées – 58, Boulevard Lefebvre – 75732 Paris, Cedex 15 – France E-mail: [email protected]
S. Multon is the corresponding author.
Abstract
This paper deals with the effects of various moisture environments on the structural behavior of concrete beams. The presented results were obtained within a large experimental program carried out at the Laboratoire Central des Ponts et Chaussées (LCPC), with Electricité de France (EDF) as a partner. The aim of this paper is to point out and to quantify the strains resulting from unidirectional moisture conditions: a drying gradient applied during 14 months, followed by the re-wetting of the dried surface during 9 months. The effect of reinforcement on the shrinkage and on the deformation due to water absorption is pointed out. Moreover, a lot of tests on companion cylinders and prisms were carried out to determine the mechanical characteristics of the material and help checking analysis methods.
The paper focuses on numerous measurements obtained during the 23 months on one plain concrete beam and one reinforced concrete beam: variation of water content, followed by precise weighing and gammadensitometry, relative humidity measurements, local and global deformations in the three directions and deflection of the beams. Thus, the effects of drying and water absorption on the behavior of concrete structures are documented and analyzed in comparison with existing representation of water diffusion.
1. Introduction
Strains in concrete structures are not always produced by mechanical loads. Particularly, because of its very nature, the behavior of concrete material is highly influenced by the moisture conditions. The moisture gradient between the skin and core of a structure induces a strain gradient, which can lead to cracking (Bissonnette et al., 1999), (Kim and Lee, 1998). Hence predicting time-dependent deformations provoked by a moisture gradient is of considerable interest (Barr et al., 1997). Few studies focus on the comparison between the shrinkage measured on sample cores and the behavior of structures made with the same concrete, with or without reinforcement. This paper presents a large-scale experiment involving six beams, four of which were affected by alkali-aggregate reaction. Their behavior under various moisture conditions was precisely monitored (Multon, 2003). It focuses on the two reference beams, made of non-reactive concrete in order to quantify the strains provoked by the moisture gradient only. The material behavior was characterized on 20 cylindrical cores, whose strain and weight were precisely monitored over a two year period. It then allows the effect of reinforcing bars on drying-induced deformations as well as on the structural behavior to be discussed.
2. Moisture distribution within the tested concrete beams 2.1 Experimental details
The beams were 3 m long, 0.25 m wide and 0.50 m high. Their span between simple sliding supports was 2.80 m. The first was a plain concrete beam (P3), the other one was equipped with two longitudinal #16 mm bars in the lower part and two #10 mm bars in the upper part (P6). Its shear reinforcement consisted of #8 mm stirrups with a 0.4 m spacing. The beams were in contact with a controlled atmosphere: the temperature was always set at 38°C. During the first 14 months, the upper faces were in contact with air at 30% RH (relative humidity),
which results in severe drying (Fig. 1). Then, for 9 months, they were covered by water, in order to induce concrete rewetting (Fig. 1). Lateral faces were sealed by autoadhesive aluminum sheets (3 layers), whereas the lower face was in contact with water (Fig. 1). Hence, a vertical RH-gradient was set in the beams.
Air at 30% RH
Lower part immersed in water 70 mm
430 mm
250 mm
Upper face in contact with water
Watertight side faces
1st stage (14 months) 2nd stage (9 months)
Fig. 1: Environmental conditions of the beams
In order to represent the different parts of these beams, cylindrical specimens (32 cm high, radius of 8 cm) were stored in different conditions (in water, sealed by aluminum sheets or in contact with 30%-RH air). The concrete used during this study had a W/C-ratio of 0.5. The cement was a classical Portland cement with 0.92% Na2Oeq. Cement content was 410 kg/m3.
Since this experiment was first aimed at studying AAR (Multon et al., 2003), the alkali-ratio was increased up to 1.25% Na2Oeq by adding potassium hydroxide into the mixing water. The
resulting concrete exhibited a mean compressive strength of 35.5 MPa at 28 days, a Young's modulus of 38,700 MPa and a tensile splitting strength of 3.8 MPa.
2.2 Evaluation of the deformation capacity
The cylinders were monitored with respect to two main effective variables: weight and longitudinal strain. The longitudinal deformations were measured on cylindrical specimens with a ball-extensometer (Fig. 2). The gauge length of the extensometer was 100 mm located over the central part of the specimens to avoid end effects.
Fig. 2: Cylindrical specimens equipped with balls for extensometer measurement
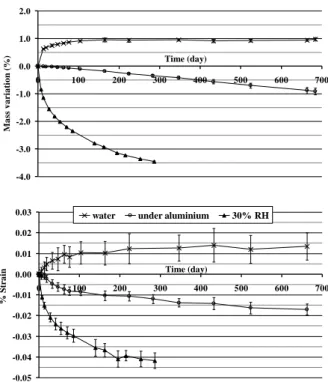
As plotted in Fig. 3, adsorption swelling due to water absorption reached about 150 µm/m for specimens stored in water. Under aluminum sealing, shrinkage reached 200 µm/m after 700 days, whereas it was over 400 µm/m after 300 days in the 30% RH atmosphere.
-4.0 -3.0 -2.0 -1.0 0.0 1.0 2.0 0 100 200 300 400 500 600 700 Time (day) M a ss v a ri a ti o n (%) -0.05 -0.04 -0.03 -0.02 -0.01 0.00 0.01 0.02 0.03 0 100 200 300 400 500 600 700 Time (day) % Stra in
water under aluminium 30% RH
Fig. 3: Mass and strain variations in concrete depending on storage conditions.
2.3 Moisture movements in the beams
Beam monitoring consisted of: moisture measurements which were aimed at quantifying the external humidity conditions influence onto moisture movements, and a deflection survey
Gauge length (100 mm)
which allowed the mechanical effects of this moisture distribution on the beams to be determined.
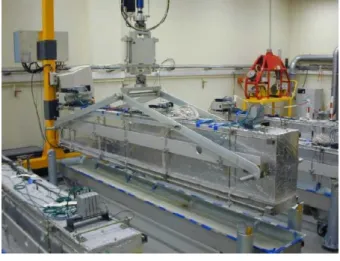
Three complementary methods were used to study moisture movements: global weighing of the 900-kg beams was achieved with a specially-designed device in order to measure mass variations (Fig. 4), capacitive sensors were set within the concrete to measure inner relative humidity and an automatic movable gammadensitometry device was built (Fig. 4 – Multon et
al., 2004).
a) Weighing device
b) Gammadensitometry device
Fig. 4: Equipment for moisture measurements in the beams
During the 14 first months, gammadensimetry gave direct access to local mass-variation m
m /
in the drying upper zone. Global mass variation resulted from both drying in the upper zone and capillary water absorption in the bottom. This latter phenomenon can be
reasonably simplified with a progressive rising of a front following a square-root of time
(t) kinetics (Multon and Toutlemonde, 2004): where S is the concrete sorptivity (in mm.min-1/2).
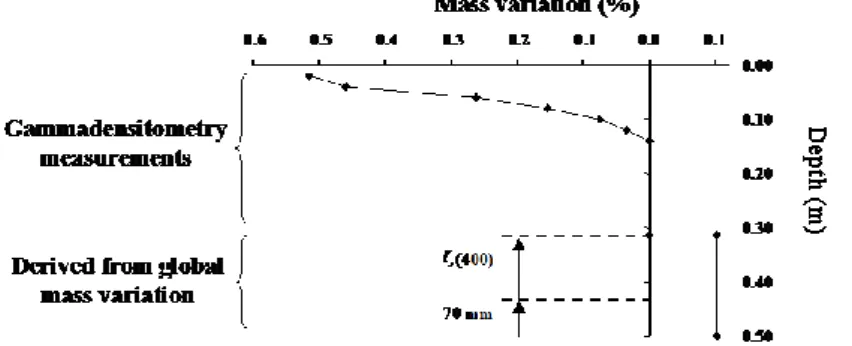
Assuming a rapid mass increase of 1% (measured on specimens - Fig. 3) as soon as the absorption front was reached, the complete profile can be established as illustrated in Fig. 5. The concrete sorptivity in the lower part of the beams is about 0.160 mm.min-1/2. This result is
consistent with sorptivity determined by Hall for concrete with a 0.5 W/C ratio (Hall, 1989).
Fig. 5 : Mass variation profile for the 400-day-old beam: gammadensitometry and water absorption zone determined using the global mass measurement.
Moreover, direct measurement of RH showed that, after 400 days, the inner RH stayed over 83% for a depth of 0.08 cm under the upper face and decreased by only 2% at 0.17 m, confirming the gammadensitometry quantification of the depth reached by drying.
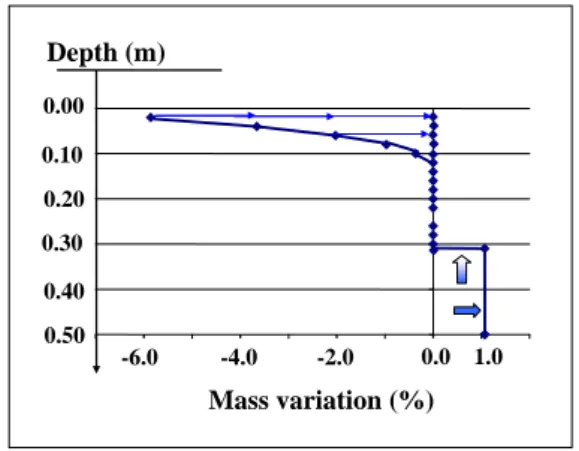
During the 9 following months, water movements can be analyzed as consisting of two steps: - First, analysis of gammadensitometry measurements has shown that concrete seems to
recover quasi-instantaneously the moisture conditions measured after the 28 curing days (Multon, 2003). This first stage is modeled in Fig. 6.
t S t0.50 0.40 0.30 0.20 0.10 0.00 -6.0 -4.0 -2.0 0.0 1.0 Mass variation (%) Depth (m)
Fig. 6: First stage of moisture distribution in concrete beams due to late water supply
- Then, the penetration of water from upside can be modeled as being proportional to the square root of time, as along the lower part (Fig. 7). The square root of time evolution allowed the depth reached by the water to be evaluated: 700 days after the beginning of experiment (and thus about 270 days after application of the late water supply), this depth was about 0.04 m for the plain concrete beam and 0.09 m for the reinforced concrete beam. The sorptivities are about 0.07 and 0.15 mm.min-1/2 for the plain and the reinforced concrete beams. The differences can be explained by differences of compaction during casting (Hall, 1989), (Multon, 2003).
0.50 0.40 0.30 0.20 0.10 0.00 0.0 1.0 Mass variation (%) Depth (m)
Fig. 7: Second stage of moisture distribution in concrete beams due to late water supply
Thus, profiles of mass variation along the depth of the beams can be plotted during the whole test period which is necessary in order to evaluate the structural behavior of the beams.
3. Strain analysis of the beams 3.1 Measurement devices
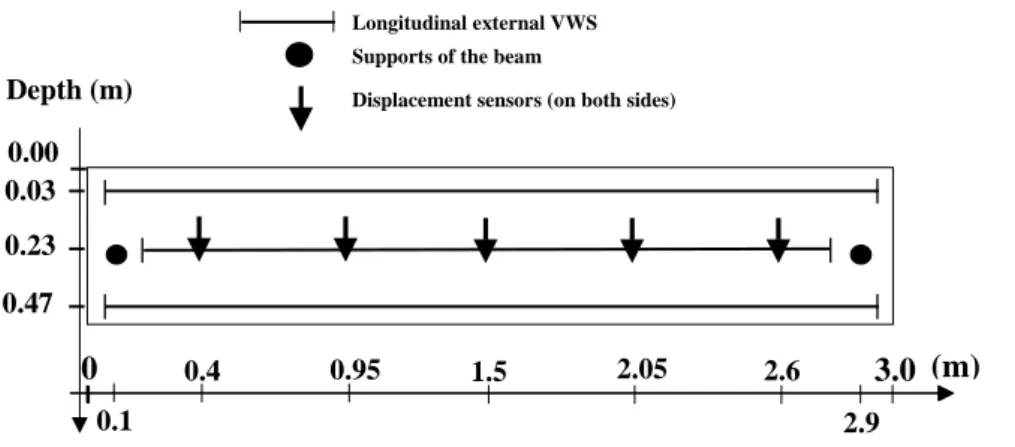
The beams were equipped with several vibrating wire sensors (VWS) (Bourquin and Joly, 2001). Small inner VWS were embedded in three directions at different depths (0.08 m, 0.17 m, 0.27 m and 0.37 m). Global longitudinal strains were monitored by a 3 m long outer VWS placed at three different depths (0.03 m, 0.23 m and 0.37 m). The deflection of the beams was determined by displacement sensors at different distances along the beam: 0.40 m, 0.95 m, 1.50 m, 2.05 m and 2.60 m (Multon, 2003). 0.00 0.37 0.27 0.17 0.08 0.0 0.4 0.7 0.8 1.0 1.2 1.6 1.8 2.0 2.2 2.6
Longitudinal and vertical inner vibrating wire sensors
Transverse inner vibrating wires sensors
3.0 Depth (m)
1.4 2.4
Moisture content profile (gammadensitometry)
(m)
a) Inner vibrating wire sensors (VWS) with 85 mm measurement basis
3.0 0 0.1 1.5 2.9 0.00 0.47 0.23 0.03 2.6 0.4 0.95 2.05 Longitudinal external VWS Supports of the beam
Displacement sensors (on both sides)
Depth (m)
(m)
b) External vibrating wire sensors (VWS) with 250 mm and 3000 mm measurement basis and displacement sensors
Fig. 8: Measurement device for strain and deflection measurements
3.2 Structural behavior of the beams
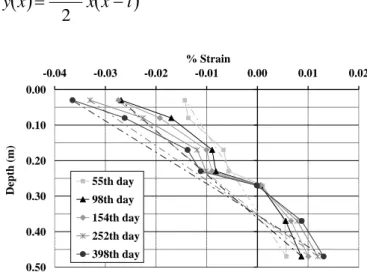
Fig. 9 exhibits average longitudinal strains as measured by VWS in a typical cross-section at different time-steps. It validates a fundamental hypothesis of Strength of Materials: the
cross-sections remain plane during the whole experiment. Under this assumption, the deflection at mid-span and the slope of the strain profile represented on Fig. 9 are directly related. Let mes be the curvature measured with the outer 3-m long VWS, y(x) the deflection at the abscissa x and l = 2.8 m the beam span. The Strength of Materials hypothesis leads to :
x x
x l
y mes 2 0.00 0.10 0.20 0.30 0.40 0.50 -0.04 -0.03 -0.02 -0.01 0.00 0.01 0.02 % Strain Depth (m) 55th day 98th day 154th day 252th day 398th dayFig. 9: Average longitudinal strains within the cross-section for plain concrete beam at 5 characteristic time-steps.
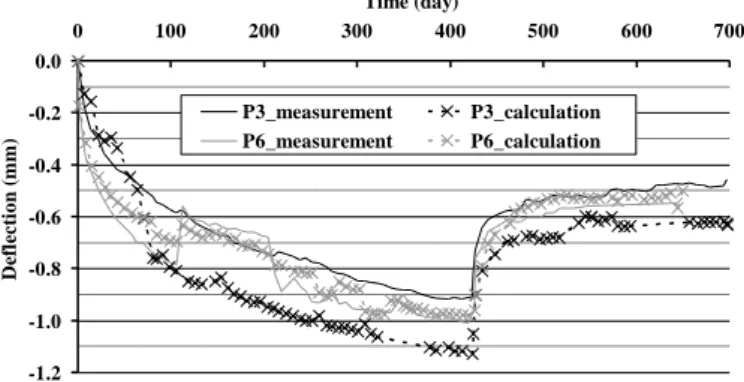
For both plain and reinforced concrete beams, the measured deflection at mid-span was consistent with the one calculated from the curvature measurements (Fig. 10). The differences between the calculated and the measured deflections at mid-span are about 200 µm. They are of the same order than the scattering of the deflection measurements performed on these beams (300 µm/m – (Multon, 2003)). In the same way, possible differences between the plain and the reinforced concrete beams can not be detected because of this scattering of measurements.
-1.2 -1.0 -0.8 -0.6 -0.4 -0.2 0.0 0 100 200 300 400 500 600 700 Time (day) D efl ecti o n (m m ) P3_measurement P3_calculation P6_measurement P6_calculation
Fig. 10: Measured and calculated deflection at mid-span for the plain concrete beam (P3) and the reinforced concrete one (P6)
3.3 Vertical and transverse strains
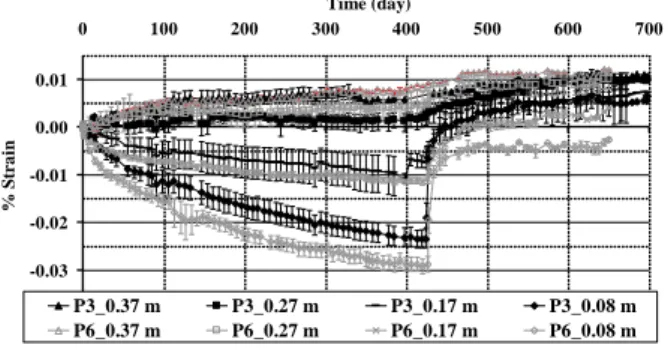
The French design code BPEL (BPEL, 1999) recommends taking into account the reinforcement when estimating shrinkage effects on RC members. In the vertical and transverse directions, the reduction would be 8%. The scattering of the concrete strains (about 50 µm/m) prevents such a small reduction being confirmed quantitatively (Fig. 11). The scatter is due to natural heterogeneity of concrete strains. It represented between 50 and 100% of strains of the immersed concrete (between 50 and 100 µm/m), and about 20% of those in the concrete submitted to severe drying.
Both for vertical and transverse strains, three zones could be distinguished during the 14 first months: positive strains occurred at a depth of 0.47 m and 0.37 m, corresponding to swelling induced by an important capillary absorption (Fig. 11). At around 0.27 m, no significant deformations were observed, because moisture supply was balanced by autogeneous shrinkage. In the upper part, drying dominated, which induced significant shrinkage. This behavior is consistent with the distribution of mass variations. It shows that concrete strains were produced by moisture movements in the material: shrinkage is correlated to water outflow, as shown in (Acker, 1998), (Torrenti et al., 1999), whereas swelling corresponds to sorption. During the “re-wetting” period, measurements at all depths exhibited swelling due to capillary absorption. It is consistent with the two stages presented for moisture movements
during the 9 last months (Fig. 6 and Fig. 7). Some vertical and transverse strains stay negative at the depth of 0.08 m after nine months of “re-wetting”. This can be explained by the scattering of the measurements as the strains were lower than 50 µm/m. During the 23 months of the experiment, the strains along these two directions were of the same order. It illustrates the isotropy of shrinkage strains in these structures.
-0.04 -0.03 -0.02 -0.01 0.00 0.01 0 100 200 300 400 500 600 700 Time (day) % Stra in P3_0.37 m P3_0.27 m P3_0.17 m P3_0.08 m P6_0.37 m P6_0.27 m P6_0.17 m P6_0.08 m a) Vertical strains -0.04 -0.03 -0.02 -0.01 0.00 0.01 0.02 0 100 200 300 400 500 600 700 Time (day) % St rain P3_0,37 m P3_0,27 m P3_0,17 m P3_0,08 m P6_0,37 m P6_0,27 m P6_0,17 m P6_0,08 m b) Transversal strains
Fig. 11: Strains at depths of 0.37 m, 0.27 m, 0.17 m and 0.08 m for the plain concrete beam (P3) and the reinforced one (P6).
For the 23 months of experiment, no cracking was observed on the two beams.
4. Mechanical analysis of beams behavior 4.1 Imposed strains
Since the measured longitudinal behavior was consistent with the Strength of Materials hypothesis, a mechanical analysis of the longitudinal behavior can be conducted by imposing
a strain profile on the cross-section, related to moisture, then solving the equilibrium equations for the cross-section. The longitudinal behavior can thus be predicted from measurements performed on specimens and compared to measurements obtained from the beams.
4.1.1 Drying period
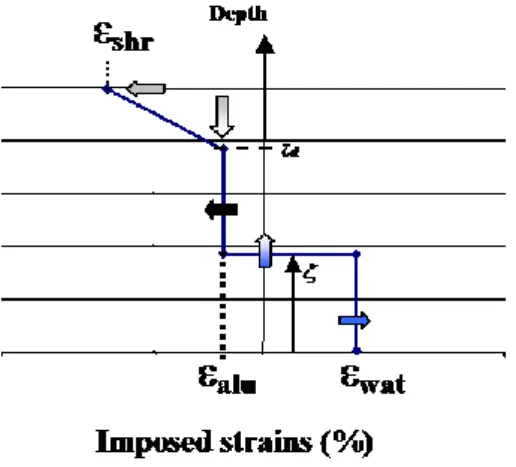
Shrinkage is proportional to relative mass variations (Acker, 1998), (Kim and Lee, 1998), (Bissonnette et al., 1999), (Torrenti et al., 1999), hence the imposed strain distribution along the longitudinal direction can be deduced from mass variations as represented in Fig. 5. Fig. 12 shows the imposed strains in the cross-section during the 14 first months. In the zone where drying occurs, for sake of simplicity, the mass variation is assumed to be linear with respect to depth (Multon, 2003). The maximum value dry is taken to be equal to the one
measured on the specimens exposed to the 30% RH atmosphere at the same time-step. The variation of this value with time is given by the measurements taken on cores (Fig. 3), whereas the depth of the zone (zd) is modified according to the gammadensitometry results (Fig. 5). For intermediate depths, the shrinkage alu is taken equal to the one measured on
cylinders sealed with aluminum sheets (Fig. 3). As the lower part of the beam is supposed to be water-saturated, its imposed strain w is based on the one measured on the water-immersed
cores (Fig. 3).
The imposed strains are compared to measured vertical strains in Fig. 13. The profile of imposed strains appears to be consistent with vertical strains measured with inner VWS on beam P3. Indeed, at the depths of 0.08 m and 0.17 m, the imposed strains fit well with the vertical strains. At the depth of 0.37 m, the expansion due to water absorption is slightly overestimated. This can be explained by differences between the expansions measured on the specimens (140 µm/m – Fig. 3) and on the beams (70 µm/m – Fig. 13). It can be caused by the natural heterogeneity of concrete and by differences of compaction during the casting. The imposed strains at the 0.27 m depth (negative and reaching -120 µm/m) are really different from the measured vertical strains (about 0 µm/m). With the modeled representation of moisture movements (Fig. 5), the water front does not reach the depth of 0.27 m before the 400th day. Between 0.17 m and 0.27 m, the concrete is reached neither by the drying penetration nor by the water front. Therefore, the imposed strains are equal in this part of the beam. In reality, the water front was more progressive. It can explain a moisture upper at this depth and the differences between imposed and measured strains. A good prediction of imposed strains is obtained except in the central part of the beam where the modeling of moisture movements appears to allow only a rough prediction.
-0.04 -0.03 -0.02 -0.01 0.00 0.01 0.02 0 100 200 300 400 Time (day) % St rain P3_0.37 m P3_0.27 m P3_0.17 m P3_0.08 m
Imp_0.37 m Imp_0.27 m Imp_0.17 m Imp_0.08 m
4.1.2 “Re-wetting” period
Fig. 14 and Fig. 15 illustrate the representations of the effects of the late water supply on the imposed strains. During the first stage, concrete in the whole beam was considered to be in the same state as for concrete with low mass losses (Fig. 14). Therefore, imposed strains are deduced from deformations measured on cylinders sealed with watertight aluminum (Fig. 3). During the second stage, concrete in the upper part was saturated by the penetration of water. The profile of imposed strains is consistent with the square root of time evolution (Fig. 15): the imposed strains in the saturated concrete are taken equal to deformations measured on specimens kept immersed in water (Fig. 3).
Fig. 14: Profiles of imposed strains representing the first stage of late water supply
Fig. 15: Profiles of imposed strains representing the second stage of late water supply
4.2 Application of equilibrium equations for longitudinal deformations
' 0 0 . . sc A st A h dz b z N ' ' 0 0 . . . sc A d st dA h dz b z z f M where h and b represent beam height and width, respectively, N is the normal force and Mf the bending moment. st and sc are the stresses in lower and upper reinforcement respectively, A and A' being their respective areas and d and d' their distances from the upper face. Moreover, considering the imposed hydric strains, the concrete constitutive equation in the elastic domain is:
z
E
z
imp
z
.
and the steel constitutive equation: s = Es.s
Last, the hypothesis of plane cross-section gives:
'0.
0
z z'0 and 0 being unknown. Since a perfect bond between steel and concrete is assumed, steel stresses may be written as functions of '0 and 0. The concrete constitutive equation can also be written in terms of these variables. Therefore, the equilibrium equations can be expressed as a linear system with two unknown quantities. This system is solved and the longitudinal strain diagram can thus be computed at each depth. Characteristic results consist of the average longitudinal strain and curvature. For the sake of comparison, longitudinal strains at the extreme upper and lower chords have been plotted corresponding with the long VWS measurements.
4.3 Results and discussion
-0.05 -0.04 -0.03 -0.02 -0.01 0.00 0.01 0.02 0.03 0 100 200 300 400 500 600 700 Time (day) % stra in Calculation Measurement 0.47 m 0.23 m 0.03 m P3
a) Plain concrete beam
-0.04 -0.03 -0.02 -0.01 0.00 0.01 0.02 0.03 0 100 200 300 400 500 600 700 Time (day) % Str ai n Calculation Measurement 0.47 m 0.23 m 0.03 m P6
b) Reinforced cocnrete beam
Fig. 16: Measured and computed longitudinal strain evolutions for both beams.
This demonstrates a relatively fair prediction of beam behavior based on deformations measured on the specimens. The scattering can be explained by inaccurate assumptions for imposed strains and by the natural heterogeneity of concrete. The inaccuracy of measurement does not allow the reinforcement influence on the beam strains to be detected, whereas calculations show that it plays a role in reducing shrinkage by 7% for the upper part, which is close to the recommendation of the BPEL design code (BPEL, 1999). The strains induced by the differential water content led to a deflection of roughly 1 mm for both 2.8 m-span beams at the end of the drying period. Drying finally leads to important differential strains. But, the tensile stresses along the upper 0.12 m of the beams lie between 3 MPa and 4 MPa. They are of the same order as the tensile splitting strength of 3.8 MPa at 28 days. Considering the inaccuracy of calculations, this is consistent with the observations since no cracking was observed on the two beams.
5. Conclusion
A 23 months moisture and strain survey of beams submitted to moisture gradients was carried out, associated with material identification of shrinkage/swelling properties on control cylinders. Despite severe drying conditions during a 14 month-long exposure, the zone concerned with significant water outflow was only about 0.12 m deep. However, measurements showed the important structural effects of RH gradient on 0.5 m-deep concrete beams, whether they are reinforced or not: the deflection may reach 1/3000 of the span. The ability to predict beam behavior thanks to Strength of Materials calculations with imposed hydro-elastic strains based on a mass variation profile has been demonstrated. The experimental data provided by the paper may also be useful in order to validate numerical models dealing with structures affected by non-uniform and time-varying moisture conditions. This is an important stage for the assessment of existing structures, specially if they are affected by ASR, where the modeling is always difficult (Poyet, 2003), (Seignol et al., 2004).
6. Acknowledgements
The authors would like to thank all the technicians from LCPC who have taken part in this study, as well as S. Prené, H. Tournier, A. Jeanpierre, E. Bourdarot and D. Chauvel, from EDF, for their participation in defining and supporting the experimental program, and C. Larive (Cetu, Lyon, France) for having launched it.
7. References
Acker, P. (1988), “Comportement mécanique du béton : apports de l'approche physico-chimique”, Rapport de recherche LPC N°152, LCPC, Paris.
Barr, B.I.G., Vitek, J.L. and Beygi, M.A. (1997), “Seasonal shrinkage variation in bridge segments”, Mat. Struct,. 30, 106-111.
Bissonnette, B., Pierre, P. and Pigeon, M. (1999), “Influence of key parameters on drying shrinkage of cementitious materials”, Cem. Conc. Res., 29, 1655-1662.
Bourquin, F. and Joly, M. (2001), “A magnet-based vibrating wire sensor”, Proceedings of
the International Conference on Smart Technology Demonstration and Devices, Edinburgh,
Scotland.
Hall, C. (1989), “Water sorptivity of mortars and concretes : a review”, Mag. Conc. Res., 41, 51-61.
Kim, J.-K. and Lee, C.-S. (1998), “Prediction of differential drying shrinkage in concrete”,
Cem. Conc. Res., 28, 985-994.
BPEL (1999), “Règles techniques de conception et de calcul d'ouvrages et constructions en béton précontraint suivant la méthode des états limites”, Fascicule 62 du CCTG, french design code, 1991, modified in 1999.
Multon, S. (2003), “Évaluation expérimentale et théorique des effets mécaniques de l’alcali-réaction sur des structures modèles”, PhD-Thesis, Université de Marne-la-Vallée.
Multon, S., Seignol, J.-F. and Toutlemonde, F. (2003), “Large Beams Subjected to ASR”,
Proceedings of the 6th CANMET/ACI Int. Conf. on Durability of Concrete, Thessaloniki,
Greece, ACI-SP210, 299-318.
Multon, S., Merliot, E., Joly, M., and Toutlemonde, F. (2004), “Water distribution in beams damaged by Alkali-Silica Reaction : global weighing and local gammadensitometry measurements”, Mat. Struct., 37, 282-288.
Multon, S and Toutlemonde, F. (2004), “Water distribution in concrete beams”, Mat. Struct.,
Poyet, S. (2003) “Etude de la dégradation des ouvrages en béton atteints de la réaction alcali-silice: approche expérimentale et modélisation numérique multi-échelle des dégradations dans un environnement hydrochemo-mécanique variable”, PhD-Thesis, Université de Marne-la-Vallée.
Seignol, J-F., Barbier, F., Multon, S., and Toutlemonde, F., (2004) “Numerical simulation of ASR affected beams, comparison to experimental data”, Proceedings of the 12th Int. Conf. on
AAR, Beijing, China.
Torrenti, J.-M., Granger, L., Diruy, M. and Genin, P. (1999) “Modeling Concrete Shrinkage under Variable Ambient Conditions”, ACI Mat. J., 96, 35-39.