Publisher’s version / Version de l'éditeur:
Vous avez des questions? Nous pouvons vous aider. Pour communiquer directement avec un auteur, consultez la première page de la revue dans laquelle son article a été publié afin de trouver ses coordonnées. Si vous n’arrivez pas à les repérer, communiquez avec nous à PublicationsArchive-ArchivesPublications@nrc-cnrc.gc.ca.
Questions? Contact the NRC Publications Archive team at
PublicationsArchive-ArchivesPublications@nrc-cnrc.gc.ca. If you wish to email the authors directly, please see the first page of the publication for their contact information.
https://publications-cnrc.canada.ca/fra/droits
L’accès à ce site Web et l’utilisation de son contenu sont assujettis aux conditions présentées dans le site LISEZ CES CONDITIONS ATTENTIVEMENT AVANT D’UTILISER CE SITE WEB.
Building Research Note, 1980-06
READ THESE TERMS AND CONDITIONS CAREFULLY BEFORE USING THIS WEBSITE. https://nrc-publications.canada.ca/eng/copyright
NRC Publications Archive Record / Notice des Archives des publications du CNRC : https://nrc-publications.canada.ca/eng/view/object/?id=2dc1667a-fa22-41e5-859d-362c0c9df5e7 https://publications-cnrc.canada.ca/fra/voir/objet/?id=2dc1667a-fa22-41e5-859d-362c0c9df5e7
NRC Publications Archive
Archives des publications du CNRC
This publication could be one of several versions: author’s original, accepted manuscript or the publisher’s version. / La version de cette publication peut être l’une des suivantes : la version prépublication de l’auteur, la version acceptée du manuscrit ou la version de l’éditeur.
For the publisher’s version, please access the DOI link below./ Pour consulter la version de l’éditeur, utilisez le lien DOI ci-dessous.
https://doi.org/10.4224/40000551
Access and use of this website and the material on it are subject to the Terms and Conditions set forth at
Mark XI Energy Research Project: air-tightness and air-infiltration
measurements
S e r
THl
MARK XI ENERGY RESEARCH PROJECT
AIR-TIGHTNESS AND AIR-INFILTRATION MEASUREMENTS
by
C . Y . Shaw and G.T. Tamura
The Division of Building Research o f the National Research Council of Canada and the Housing and Urban. Development A s s o c i a t i o n of
Canada arc participating in a joint program to s t u d y energy conservation i n f o u r detached two-storey houses. These houses are a l l of the same f l o o r
plan and s i z e , and are located on adjacent l o t s (Fig. 1 ) . One o f the
houses [Hl) was b u i l t to a censtmction standard simklar to o t h e r new
h o u s e s in t h e same area; the a t h e r t h r e e (H2, H3, H4) were built w i t h added i n s u l a t i o n and a specially applied polyethylene vapour barrier to improve a i r tightness o f t h e house envelope. All the houses are equipped w i t h an e l e c t r i c furnace and a f o r c e d - a i r circulation system.
I n addition, one of t h e upgraded houses h a s a heat-pump unit and another h a s an a i r - t o - a i r solar-heating s y s t e m . A b r i e f description of t h e houses
i s given in Table 1 .
Tests were conducred t o measure t h e air tightness of the f o u r houses and the air-infiltration rates of the standard and heat-pump
houses (Hl and H4). Because t h e building envelope of t h e standard and
upgraded houses d i f f e r s primarily in air-tightness value, a comparison
of the simultaneously obtained infiltration data should show w h e t h e r or
n o t t h e r e i s a correlation between i n f i l t r a t i o n and air tightness.
TEST METHODS
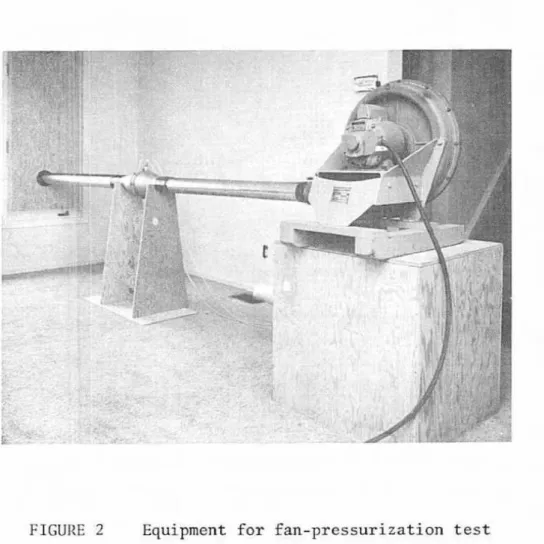
The air-leakage t e s t s were conducted u s i n g t h e pressurization method. As shown in F i g . 2 , a c e n t r i f u g a l f a n with a capacity of 380 L / s
was placed in the living room o f t h e house. The discharge s i d e o f t h e f a n was connected by a 10-cm diameter d u c t to an outside window where the window was replaced w i t h a plywood p a n e l . The flow r a t e of t h e f a n was
adjusted manually w i t h a damper and was measured with a laminar flow
clerncnt (MERIM4 LFE ELEMENT; accuracy of 5 per cent of measured value].
Pressure t a p s installed in t h e exterior walls at f o u r l e v e l s e n a b l e d
i n s i d e - t o - o u t s i d c pressure d i f f e r e n c e s to b e measured d u r i n g the test
using a diaphragm-type pressure transducer ( s t a t i c error band of 5 cent f u l l s c a l e ) .
The air-leakage rates t h r o u g h windows and d o o r s o f t h e heat-
pump house were a l s o o b t a i n e d by comparing t h c over-all air-leakage rates taken before and after the particular components were sealed with plastic
Air-infiltration rates were measured using t h e tracer-gas decay method , 2 * w i t h C02 as t h e t r a c e r gas. This involves introducing
a small amount of C02 into The house and measuring t h e decay of i t s concentration with time. The C02 was produced by p l a c i n g pieces o f d r y
ice en
a
hot p I a t e in t h e living room; a f t e r a pre-determined amount ofCQ2 was generated, t h e remaining dry i c e was t a k e n out of the house. After allowing sufficient time f o r the t r a c e r gas to mix with t h e a i r
i n s i d e the house, u s i n g t h e f o r c e d - a i r c i r c u l a t i o n system, t h e concentra- t i o n of C02 was measured periodically. P l o t t i n g t h e s e data on semilog
graph p a p e r gives a s t r a i g h t line with a negative slope t h a t equals the air-infil
tration
r a t e , assuming p e r f e c t mixing. During t h e t c s t s , asample of air was drawn alternately from t h e return air d u c t of each
t e s t house using 0 . 6 3 - a n polyethylene tubing, and was analyzed u s i n g
an i n f r a r e d gas analyzer (accuracy 1 p e r c e n t of f u l l scale). An
automatic system was used t o t a k e a i r samples and measure t h e C02 con-
centrations t o a v o i d introducing additional C02 in t h e houses from the presence o f r e s e a ~ c h personnel. In addition, w i n d speed and direction
were r e c o r d e d . +he cup anemometer was l o c a t e d approximately 18 m
above ground and about 1 0 rn t o t h e r e a r of t h e houses [ F i g . I ) . Pressure
differences across t h e exterior walls of the standard and heat-pump
houses were also measured separately at four l e v e l s in c o l d w e a t h e r and under calm c o n d i t i o n s [wind speed below 1 m / s ) t o determine t h e neutral
pressure l e v e l .
RESULTS AND DISCUSSION
The air-leakage r a t e i n t h i s paper i s given in l i t r e s p e r second per u n i t area of building envelope. The area of building envelope
i s d e f i n e d a s t h e area o f t h e exterior walls above grade plus t h a t o f t h e c e i l i n g of the upper f l o o r . F i g u r e 3 shows t h e over-all air-leakage rates measured for t h e f o u r houses in March 1979, approximately a year after t h e y
were constructed. It indicates t h a t t h e standard house (HI') h a s g r e a t e r
a i r leakage
than
two of t h e upgraded ones (H2 and H43. The lower a i r - leakage rate f o r the upgraded houses i n d i c a t e s that t h e special caretaken to seal around windows and d o o r s , and t h e addition o f t h e polyethylene
vapour b a r r i e r effectively improved a i r tightness. Figure 3 a l s o shows
t h a t the s o l a r house (H3) i s not n e a r l y a s a i r t i g h t a s t h e o t h e r upgraded
houses. The solas collector arid t h e ductwark of the a i r - t o - a i r s o l a r -
heating system probably provide a d d i t i o n a l air leakage openings in t h e building envelope.
Air-leakage r a t e is u s u a l l y expressed in terms o f p r e s s u r e
differentials by the equation
where
Q = a i r leakage r a t e , L / s
A = area o f b u i l d i n g e n v e l o p e , m2
AP = p r e s s u r e d i f f e r e n c e across e x t e r i o r wall, Pa
n
= flow exponentThe flow exponent, n , i s 0.71 for a l l of the houses and t h e corresponding
flow coefficients are 0.110, 0.068, 0.102,and 0.075 f o r houses H I , H 2 , H 3
and H4 respectively.
The over-all air-leakage rates of the f o u r houses had also been
measured In March 1978, shortly a f t e r they were constructed. As shown
in F i g . 4 , t h e air-leakage rates obtained in 1978 were lower t h a n t h o s e
o b t a i n e d a y e a r l a t e r . The difference is likely due to the i n c r e a s e i n leakage openings caused by t h e d r y i n g and shrinkage of h u i l d i n g materials.
F i g u r e 4 a l s o shows the ranges o f air t i g h t n e s s f o r 6 3 houses c o n s t r u c t e d
in 1978 in t h e Ottawa area4 and f o r 26 houses c o n s t r u c t e d hctvccn 1969
and 1977 in S ~ e d e n . ~ The r e s u l t s indicate t h a t t h e Swedish h o u s e s , i n g e n e r a l , a r e tighter t h a n t h e Ottawa houses and t h a t thc four r e s e a r c h
houses a r e c l o s e to t h e upper range for t h e Swedish houses,
The air-leakage r a t e s through windows and doors were measured in
t h e heat-pump house. There was no detectable air leakage t h r o u g h the
j o i n t s between t h e wall and the frames of windows or doors. The air-leakage
r a t e through windows was quite low. As i n d i c a t e d in Fig. 5 , t h e window
l e a k a g e is a b o u t 50 p e r c e n t lower t h a n t h e maximum air-leakage r a t e
permitted i n ASHWE Standard 90-75 f o r ~ i n d o w s . ~
The tracer-gas method w i t h C02 a s the t r a c e r gas was checked in t h e
heat-pump h o u s e w h e r e a known a i r - c h a n g e r a t e was induced u s i n g t h e equip-
m e n t and method f o r conducting a fan-pressurization t e s t . Tllcse r c s u l t s ,
g i v e n i n F i g . 6 , i n d i c a t e t h a t f o r an a i r - c h a n g e r a t e a f l e s s t h a n 0.5 a i r change p e r hour ( t h e maximum a i r infiltration obtained i n z h e s e houscs u n d e r v a r i o u s outside c o n d i t i o n s ) , the tracer-gas method gave a r e a d i n g about 10 per c e n t lower t h a n t h a t induced by t h e f a n . P o o r e r agreement (e.g., P t .
1) w a s
sometimes obtained u n d e r c o n d i t i o n s o f induced air-change r a t e s above 0.5 air change pef hour. Figure 7 shows t h e t r a c e r - gas concentration versus time curve f o r P t . 1. The air-infiltrationrate determined from t h e curve was 0.57 a i r change p e r h o u r , which was a h o u t 24 Ilcr c e n t lulrrcr t h n n t h e induccd valuc [ s e e Fig. 6 ) . The rncasured
d a t a l i e i n almost a strajglat l i n c [l:ig. 7 ) ; a comparison with t h e results shown in F i g . 6 irtdicatcs that an assumed linear relationship does n o t
necessarily g i v e an accurate value o f air-infiltration r a t e .
Air-infiltration measurements were conducted simultaneously in the
s t a n d a r d and hcnt-pump houses
(HI
and H4) between January and April 1979 t o o b t a i n d a t a in cold weather. Additional measurements were conducted i nthe heat-pump house d u r i n g J u l y and A u g u s t of the same year t o investigate t h e e f f e c t
of
wind a l o n e on air infiltration. Unfortunately, t h e samet e s t s c o u l d n o t be r e p e a t e d on t h e s t a n d a r d h o u s e because it was occupied
i n F i g s . 8, 9 , 10 and 11.
In F i g s . 6 and 9, t h e air-infiltration r a t e s a r e plotted a g a i n s t
insidc-outside temperature d i f f e r e n c e for three ranges of wind spccd, i . c . , hclow 3 . 5 m / s , ahovc 5 rnls and t h a t i n between. For a wind specd lower t h a n
3 . 5 m/s [hclow 8 mph), air infiltration increased with inside-outside
temperature difference. The air-infiltration data measured under this
condition wcrc f i t t e d to a power-law expression similar to E q . 1 . T h e
reason f o r c h o o s i n g t h i s form instead o f a l i n e a r cxprcssien i s t h a t i t h a s been used exrensively to d e f i n e air-infiltration r a t e s due t o s t a c k a c t i o n i n houses,7 tall buildingsJ8 and schools.q It a l s o predicts z e r o
infiltration in t h e absence o f temperature d i f f e r e n c e . The infiltration
equation for the t w o houses [ H l and H4) is
where I is t h e infiltration r a t e
i n
a i r changes p e r hour, C is the flow coefficient as defined in E q . 1 and A t is the inside-outside temperaturedifference i n degree Celsius.
Figures 8 and 9 a l s o show t h a t when t h e wind speed is h i g h e r than
3 . 5 m/s the infiltration rate excceds the values t h a t would apply f o r t h e same At with low wind speeds. B u t t h e s c a t t e r o f t h e data makes it
d i f f i c u l t t o s e p a r a t e t h e wind effects from the temperature e f f e c t s . The air-infiltration data obtained in warm-weather c o n d i t i o n s a r e p l o t t e d v e r s u s wind speed i n F i g . 10. Although t h e r e s u l t s i n d i c a t e t h a t a i r
i n f 5 l t r a t i o n i n c r e a s e s w i t h wind speeds f o r b o t h houses, t h e s c a t t e r in t h e
d a t a s u g g e s t s that wind d i r e c t i o n may b e i m p o r t a n t . These results were
therefore rcplottcd in Fig. 11 against wind speeds iFor different wind
d i r e c t i o n s , which revealed a dependency of a i r infiltration on wind speed
and d i r e c t i o n .
The monthly averaged heat losses due to infiltration were calculated
f o r the two houses (Hl and H4) u s i n g measured i n f i l t r a t i o n rates and t h e
monthly mean air temperatures of t h e 1978-1979 h e a t i n g season ( F i g . 1 2 ) .
The r e s u l t s were t h e n corn ared with the measured t o t a l purchased e n e r g y f o r
the same period of time. l g ~ l l As shown in F i g . 12, air i n f i ltration
accounted f o r approximately 20 per cent o f the t o t a l e n e r g y consumption f o r b o t h t h e s t a n d a r d and heat-pump h o u s e s . (The percentage would be about 30 pcr cent For the heat-pump h o u s e if i t s atr t i g h t n e s s were t h e same a s
t h a t of thc s t a n d a r d house,)
A d i r e c t comparison of t h e s i m u l t a n e o u s l y measured a i r - i n f i l t r a t i o n
r a t c s of t h e t w o houscs ( H 1 and H43 is shown in Fig. 13 for t w o ranges of
wind speed. The r e s u l t s i n d i c a t e that t h e r a t i o of infiltration r a t e s i s t h c same a s t h e r a t i o of t h e f l o w coefficients when the wind spced i s lower t h a t 3.5 m / s . A similar t r e n d i s apparent for h i g h wind conditions b u t t h e
s c a t t e r in t h e d a t a , due to the dependence on ~ i n d d i r e c t i o n , is too large
An attempt was t h e n made to correlate air infiltration (tracer-
gas method) w i t h a i r leakage [fan-pressurization method] for the three
wind-speed ranges using t h e data from the two research h o u s e s CH1 and H4) and d a t a from two o t h e r single-storey houses,12 A s shown in Fig. 1 4 ,
f o r a wind speed lower t h a n 3.5 m / s , l / b t n increases with the flaw co- efficient, where n is the flow exponent as d e f i n e d in E q . I . For h i g h e r
wind speeds, infiltration appears to be proportional to the flow coefficient
as well but the scatter in t h e d a t a i s t a o wide and t h e d a t a base t o o
small t o l e a d t o a definite conclusion. The t w o single-storey houses (No.
I
and No. 23 have chimneys whereasH1
and H4 d o not. Because achimney provides an opening above t h e r o o f , it raises The neutral-
p r e s s u r e lcvcl of the house. The neutral-pressure level, therefore, is at about t h e same h e i g h t f o r each house (approximately 2.7 m above
ground for houses H1, H4 and No. 1 , and 2 m f o r house No. 2 ) . Consequently, t h e pressure d i f f e r e n t i a l s caused by stack a c t i o n , which a c t on t h e four
houses,are about the same under t h e same ambient air t e m p e r a t u r e s , and
their air-infiltration rates may be compared with each o t h e r directly. I f t h e t w o s i n g l e - s t o r e y h o u s e s d i d n o t have chimneys, it is likely that their air-infiltration ratcs would be lower t h a n t h a t shown i n F i g . 1 4 .
CONCLUSI OY
Air-leakage r a t e s weTe measured
i n
t h e f o u r energy-conservationresearch Rouses u s i n g t h e fan-pressurization method. It was found t h a t
a i r
lcakage of t h e standard h o u s e was about 10 per c e n t h i g h e r t h a n thatof t h e solar house and about 50 per c e n t h i g h e r than t h a t of the other
two upgraded houses. The h i g h a i r leakage of the sclar house probably
can be a t t r i b u t e d to t h e air l e a k a g e t h r o u g h t h e ductwork and the solar collector of t h e air-to-air solar-heating system. There was no detectable
air leakage t h r o u g h joints around windows and d o o r s . The a i r leakage t h r o u g h
windows of the heat-pump house, which were tested as installed, i s about 5 0 per c e n t lower than the maximum value permitted by ASHR4E 90-75 f o r
new building d e s i g n .
Air-infiltration r a t e s w e r e measured simultaneously in the standard
and heat-pump houses u s i n g t h e tracer-gas method w i t h C02 a s t h e traces gas. It was found t h a t f o r a wind speed lower t h a n 3 . 5 m/s, t h e a l r - infiltratioa rate can b e expressed in terms of inside-outside temperature d i f f c r c n c c b y a n cquation similar to the air-flow equation with the same
cxponcnt. ?'hc r a t i o o f thc infiltration r a t c s o f t h e two houscs i s
;~plroxim:iscly crlual t o t h c r a t i o of t h e flow coefficients, which indicates t h a t t h c r c is a correlation between infiltration and air leakage as
mcasurcd 11y fan-pressurization t e s t s . The r e s u l t s for the t w o single-
s t o r e y houscs {No. 1 and No. 2) also appear t o s u p p o r t T h i s c o n c l u s i o n .
The s i g n i f i c a n c e of inside-outside temperature is reduced as wind speed
increases.
Air infiltration,
an
an average, accounted f o r a b o u t 20 p e r c e n t oft h e t o t a l energy purchased for the standard and heat-pump houses in the
ACKNOWLEDGEMENT
The authors wish t o thank t h e i r colleagues W.C. Brorm and
R . L . Q u i r o u e t t e , p r o j e c t managers of t h e Mark X I Energy Research P r o j e c t , f o r t h e i r cooperation and assistance
in
conducting t h e e x p e r i m c n t s . They a l s o w i s h to acknowledge the assistance of R . G . Evans, R.L. P P o u f f e andD.L. Logan in t h e f i e l d t e s t s .
REFERENCES
Q u i r o u e t t e , R . t. The Mark X I Energy Research Project - Design and C o n s t r u c t i o n . National Research Council of Canada, D i v i s i o n of
Building Research, Building Research Note 151, October 1978.
Honma, H. Ventilation of Dwellings and its Disturbances. S~ockholm,
FaFho Grafiska, 1975.
Hunt, C.M. and Bwrch, D.M. A i r Infiltration Measurements in a Four
Bedroom Townhouse Using S u l f u r Hexafluoride as a Tracer Gas. ASHRAE
Transactions, VoX. 81, Pt. 1, 1975, pp. 186-201.
Beach, R . K . Relative T i g h t n e s s of N e w Mousing in the O t t a w a Area.
National Research Council of Canada, D i v i s i o n of B u i l d i n g Research,
B u i l d i n g Research Note 149, June 1979.
KronvalP, J . Testing of Houses for A i r Leakage Using a Pressure
Method.
ASHRAE
Transactions, Vol. 84, Pt, 1, 1978, p p . 72-79.E n e r g y Conservation in N e w Building Design. ASHRAE Standard 9 0 - 7 5 ,
ASHRAE I n c . , N . Y .
Tamura, G . T . The Calculation of House Inftltration R a t e s .
ASHRAE T r a n s a c t i o n s , Vol. 8 5 , P t . 1 , 1979, p p . 58-71.
'
Shaw,C.Y.
and Tamura, G.T. The Calculation o f Air Infiltration RatesCaused by Wind and Stack Action f o r T a l l Buildings. ASHRAE
Transactions Vol. 8 3 , Pt. 2 , 1977, pp. 1 4 5 - 1 5 8 .
Shaw, C. Y . Wind and Temperature Induced Pressure D i f f e r e n t i a l s and E q u i v a l e n t Pressure Difference Model for Predicting Air Infiltration
i n S c h o o l s . ASHME Transactions, V o l . 8 6 , P r . 1,1980.
Brown, W.C. Mark X I E ~ e r g y Research P r o j e c t - comparison o f Standard and Upgraded Houses. National Research Council of Canada, Division o f B u i l d i n g Research, Building Research Note 160, J u n e 1980.
' I C a n e , R. 1,. D
.
P r i v a t e Communication.l 2 'l'amura, (;,'I3. and Wilson, A . G . A i r Leakage and Pressure Mcasurerncnts on Two Occupied Houses. ASHRAE Transactions, V o l . 70, 1964, p p . 110-119,
TrIBLE I
DESCRIPTION OF TEST IIOUSES
HOUSE
single detached 2 storey. 3 bedroom with attached
garage
Same as H I same a s HI same as H I
Floor area, m2 C e i 6 ing area, ID2 V o l u m ~ (including basement), mJ Cutsidc envelope, m2 [Xttsidc wall a r e a . m2 Window area. lnz k t s i d c door area, m2 Length of sash crack for window, m k t s i d e w a l l brick on front w a l l up t o 1 storcy h i g h aluminum s i d i n g on ~ d m a i n i n g wall
same a s t I 1 samc as H3 same as H1
plastcr board Inside w a l l
Window
same a s 111 same a s H1 samc a s H 1
double glazed, wood - f rame s l ~ d i n g and double-hung triplc glazed, WOO^ - framc casement, awning triplc g l a z e d . woutl - frame casement, awning triple glazed. wood- frame crtsement. awning standard wood- f r a e construction
same a s kt4 samc as H9 upgraded rood-
framc constmctian with additional insulation and a 4-mil polycthylenc vapour barrier throu~hout Construction
Heating system forced-air with e l e c t r i c furnace,
no chimney
fo~ccd-air w ~ t h f a r c e d - a i r w i t h forced-air h l t h
e l c c t r j c furnace. alr-to-air heat pump,
na chimney solar-heating c l e c t r i c furnace
system. no chimney
electric furnace,
F I G U R E 1 S I T E P L A N - M A R K X I P R O J E C T
f
\
a--
4
. . - - - L,- . --- - 2 ; tl m w & \ M A R K-
XI HOUSE-"rJ
---: , --
--.,
^ I * 1 +- LC/
F O R T U N E D R I V E RTH BERM FOR SOUND SHIELDINGI N M A R C H 1 9 7 9
P R E S S U R E D I F F E R E N C E A C R O S S E X T E R I O R W A L L . P a
F I G U R E 3
O V E R - A L L A I R - L E A K A G E R A T E F O R T H E F O U R
LOWER LIMIT I O l l A W A l
- - - -
MARCH 1979-
MARCH 1978UPPER AND LOWER LIMITS OF 63 HOUSES CONSTRUCTED IN 1978
I N OTTAWA (REF. 41
-
--
--- UPPER AND LOWERLIMITS
OF
26 SWEDISHHOUSES CONSTRUCTED
LOWER
LIMIT (SWEDEN) BETWEEN 1969 AND 1977P R E S S U R E D I F F E R E N C E A C R O S S E X T E R I O R W A L L , P a
F I G U R E 4
C O M P A R I S O N O F A I R - L E A K A G E R A T E O F THE
P R E S S U R E D I F F E R E N C E A C R O S S
W I N D O W S .
PaF I G U R E 5
W I N D O W A I R - L E A K A G E R A T E O F T H E
A I R - L E A K A G E R A T E - F A N P R E S S U R I Z A T I O N , A I R C H A N G E f h
F I G U R E 6
TIME. h
F I G U R E 7
S A M P L E P L O T O F C 0 2 C O N C E N T R A T I O N V S T I M E F O R
0 0 5 10 15 20 25 30 3 5 4 0 45
d
t . I N S I D E - O U T S t D E T E M P E R A T U R E D I F F E R E N C E ," C
F I G U R E E A I R - I N F I L T R A T I O N R A T E Y S I N S 1 D E - O U T S 1 Q'E T E M P E R A T U R E D I F F E R E N C EFOR
H O U S E H 1A t , I N S I D E - O U T S I DE T E M P E R A T U R E D l F F E R E N C E .
"C
F I G U R E 9
A t R - I N F I L T R A T I O N R A T E V S I N S I D E - O U T S I D € T E M P E R A T U R E
A L L W I N D D I R E C T I O N S
W l N D S P E E D , V , mls
F I G U R E 10
I I I N O R T H W E S T a t o
> O " C
..
-
-
4 mI
I I I S O U T H t o > f l ' C-
P A R T I A L L Y S H I E L D E D - B Y E A R T H BERM-
*
- a - - e=
I
I I I E A S T t o > O " C-
C O M P L E T E L Y S HI E L
D E D-
- - a -*
+*
1 I 1 0 0 2 4 6 8 1 0 0 2 4 6 8 W I N D S P E E D , V , m l s W I N D S P E E D , V , m l s A I R - I N F I L T K A T I O N R A T E A T V A R I O U S W l N D S P E E D S A N D W l N D D I R E C T I O N S F O R H E A T - P U M P H O U S E1
I
.I - - - - m- - - - - ,,,-- - ----
.--
-
rn H E A T - P U M P H O U S E-
H 4 - I 1 I ' - 0 , --
- - - 0 - - - ---a ,--- 0- --
-
- S T A N D A R D H O U S E - H 1 1 1 eQf I T -% =
a; 0 . 2 0 J A N FE B MAR 1978-79 HEAT1 NG SEASON A P R M A Y F I G U R E 1 2 M O N T H L Y A V E R A G E D I N F I L T R A T I O N L O A D A N D I T S C O N T R I O U T I O N T O T O T A L E N E R G Y C O N S U M P T I OMI fi
3 - 5 1
V < 5.0 m i s A ...O.,C1
d (10.55) m - V-
>
5.0 m l s - C ~ 4 z - CH1 - NUMBER IN BRACKET - INDI CASES W I N D SPEED I Nmls
I 0 0 0 . 1 0 . 2 0 . 3 0 . 4 I - H O U S EHI.
A I R C H A N G E l h F I G U R E 4 3 C O M P A R I S O N O F S I M U L T A N E O U S L Y M E A S U R E D I N F I L T R A T I O N R A T E S OF H 1 A N D M 4I