HAL Id: hal-03148998
https://hal.archives-ouvertes.fr/hal-03148998
Submitted on 22 Feb 2021
HAL is a multi-disciplinary open access archive for the deposit and dissemination of sci-entific research documents, whether they are pub-lished or not. The documents may come from teaching and research institutions in France or abroad, or from public or private research centers.
L’archive ouverte pluridisciplinaire HAL, est destinée au dépôt et à la diffusion de documents scientifiques de niveau recherche, publiés ou non, émanant des établissements d’enseignement et de recherche français ou étrangers, des laboratoires publics ou privés.
healthcare and patient-centeredness at primary health
facilities: A mixed methods study in rural Eastern
Uganda
E. Waweru, T. Smekens, Joanna Orne-Gliemann, F. Ssengooba, J. Broerse, B.
Criel
To cite this version:
E. Waweru, T. Smekens, Joanna Orne-Gliemann, F. Ssengooba, J. Broerse, et al.. Patient perspec-tives on interpersonal aspects of healthcare and patient-centeredness at primary health facilities: A mixed methods study in rural Eastern Uganda. PLoS ONE, Public Library of Science, 2020, 15 (7), pp.e0236524. �10.1371/journal.pone.0236524�. �hal-03148998�
RESEARCH ARTICLE
Patient perspectives on interpersonal aspects
of healthcare and patient-centeredness at
primary health facilities: A mixed methods
study in rural Eastern Uganda
Everlyn WaweruID1,2,3*, Tom SmekensID1, Joanna Orne-Gliemann2, Freddie Ssengooba4,
Jacqueline Broerse3, Bart Criel1
1 Department of Public Health–Health Systems and Equity Unit, Institute of Tropical Medicine, Antwerp,
Belgium, 2 Population Health Department, University of Bordeaux, Bordeaux, France, 3 Department of Public Health–Quality of Care, Athena Institute, Faculty of Science, Vrije University, Amsterdam,
Netherlands, 4 Department of Health Policy Planning & Management, Makerere University College of Health Sciences, Kampala, Uganda
*ewaweru@itg.be
Abstract
Introduction
Patient-centered care (PCC) is an approach to involve patients in health care delivery, to contribute to quality of care, and to strengthen health systems responsiveness. This article aims to highlight patient perspectives by showcasing their perceptions of their experience of PCC at primary health facilities in two districts in Uganda.
Methods
A mixed methods cross-sectional study was conducted in three public and two private pri-mary health care facilities in rural eastern Uganda. In total, 300 patient exit survey question-naires, 31 semi-structured Interviews (SSIs), 5 Focus Group Discussions (FGDs) and 5 feedback meetings were conducted. Data analysis was guided by a conceptual framework focusing on (1) understanding patients’ health needs, preferences and expectations, (2) describing patients perceptions of their care experience according to five distinct PCC dimensions, and (3) reporting patient reported outcomes and their recommendations on how to improve quality of care.
Results
Patient expectations were shaped by their access to the facility, costs incurred and per-ceived quality of care. Patients using public facilities reported doing so because of their prox-imity (78.3% in public PHCs versus 23.3% in private PHCs) and because of the free
services availed. On the other hand, patients attending private facilities did so because of their perception of better quality of care (84.2% in private PHCs versus 21.7% in public PHCs). Patients expectations of quality care were expressed as the availability of medica-tion, shorter waiting times, flexible facility opening hours and courteous health workers. a1111111111 a1111111111 a1111111111 a1111111111 a1111111111 OPEN ACCESS
Citation: Waweru E, Smekens T, Orne-Gliemann J,
Ssengooba F, Broerse J, Criel B (2020) Patient perspectives on interpersonal aspects of healthcare and patient-centeredness at primary health facilities: A mixed methods study in rural Eastern Uganda. PLoS ONE 15(7): e0236524.https://doi. org/10.1371/journal.pone.0236524
Editor: Elena Ambrosino, Universiteit Maastricht,
NETHERLANDS
Received: April 8, 2020 Accepted: July 7, 2020 Published: July 30, 2020
Peer Review History: PLOS recognizes the
benefits of transparency in the peer review process; therefore, we enable the publication of all of the content of peer review and author responses alongside final, published articles. The editorial history of this article is available here:
https://doi.org/10.1371/journal.pone.0236524
Copyright:© 2020 Waweru et al. This is an open access article distributed under the terms of the
Creative Commons Attribution License, which permits unrestricted use, distribution, and reproduction in any medium, provided the original author and source are credited.
Data Availability Statement: The anonymized and
de-identified quantitative patient exit data set is provided as a supplementary file and quotes
Analysis of the 300 responses from patients interviewed on their perception of the care they received, pointed to higher normalized scores for two out of the five PCC dimensions con-sidered: namely, exploration of the patient’s health and illness experience, and the quality of the relationship between patient and health worker (range 62.1–78.4 out of 100). The quali-tative analysis indicated that patients felt that communication with health workers was enhanced where there was trust and in case of positive past experiences. Patients however felt uncomfortable discussing psychological or family matters with health workers and found it difficult to make decisions when they did not fully understand the care provided. In terms of outcomes, our findings suggest that patient enablement was more sensitive than patient sat-isfaction in measuring the effect of interpersonal patient experience on patient reported outcomes.
Discussion and conclusion
Our findings show that Ugandan patients have some understanding of PCC related con-cepts and express a demand for it. The results offer a starting point for small scale PCC interventions. However, we need to be cognizant of the challenges PCC implementation faces in resource constrained settings. Patients’ expectations in terms of quality health care are still largely driven by biomedical and technical aspects. In addition, patients are largely unaware of their right to participate in the evaluation of health care. To mitigate these chal-lenges, targeted health education focusing on patients’ responsibilities and patient’s rights are essential. Last but not least, all stakeholders must be involved in developing and validat-ing methods to measure PCC.
Introduction
Involving patients in the planning, delivery and evaluation of healthcare has been endorsed as an important approach towards improving the quality of health care services and the respon-siveness of health systems worldwide [1,2]. This is even more crucial in resource constrained settings where historically, quality improvement strategies have been more focused on health care providers, with little or no attention to consumer perspectives in the design and assess-ment of quality improveassess-ment interventions [3–5]. Health care consumers in these settings have also been reported to have low expectations of what is good quality health care [6]. Conse-quently, patient-centered care (PCC) has been advocated as one of the ways in which patients can participate in health care.
PCC has been defined by the Institute of Medicine as care that is “respectful of, and respon-sive to, individual patient preferences, needs and values, and ensuring that patient values guide all clinical decisions” [7]. Barry et al. [8] similarly define PCC as being “about considering peo-ple’s desires, values, family situations, social circumstances and lifestyles; seeing the person as an individual, and working together to develop appropriate solutions”. Literature also describes PCC as “care where the patient is the source of control; care where knowledge is shared and information flows freely; care where transparency is necessary and the needs of the patient are anticipated” [1] and “care where patients are encouraged to participate in, and make decisions about their health and health care” [8,9]. Established patient organizations view PCC as “patients acting as equal and informed partners in decision making”, in contrast to traditional medical paternalism. It is partly about valuing patients as consumers of services,
relevant to this manuscript are provided in the text. Interview audio files and complete transcripts (which contain additional information and will be used for other manuscripts) are governed under the Institute of Tropical Medicine (ITM) data sharing and open access policy. Access requests for ITM research data can be made to ITM’s central point for research data access by means of submitting a completed Data Access Request Form. These requests will be reviewed for approval by ITMs Data Access Committee, with further approval from the ITM Research Ethics Committee. Please see this link for more informationhttps:// www.itg.be/F/data-sharing-open-access. Contact information for ITM data access committee iseb. gti@sseccaatadhcraeserMTI.
Funding: This work was supported by funding
from the European Commission, through the Erasmus Mundus Joint Doctorate Fellowship, Specific Grant Agreement 2016-1346, awarded to EW. The funders had no role in study design, data collection and analysis, decision to publish, or preparation of the manuscript.
Competing interests: The authors have declared
that no competing interests exist.
Abbreviations: ART, Antiretroviral Therapy; CHW,
Community Health Worker; DHMT, District Health Management Team; FGDs, Focus group discussions; HC, Health centre; HIV/AIDS, Human Immunodeficiency Virus infection / Acquired Immune Deficiency Syndrome; IMHDSS, Iganga Mayuge Health and Demographic Surveillance Site; LMICs, Low and middle income countries; MHC, Maternal and child health care; NCD, Non-Communicable Disease; NGO, Non-governmental organization; Nvivo, Qualitative data analysis computer software package produced by QSR International; PCC, Patient-centered care; PHC, Primary health care; PI, Principal investigator; RC, Routine care; SC, Specialized care; SSIs, Semi-structured Interviews; STATA, Software for statistics and data science; VHTs, Village health teams.
who should be empowered through better information, greater choice, and the opportunity to give feedback and rate health care services. It is also about patients exercising their rights and responsibilities as citizens” [10,11]. McCormack, Borg et al. recommend the patients’ perspec-tive on what constitutes high-quality care as central to the implementation and evaluation of PCC [12]. Several reviews conducted in developed countries with—more experience in the implementation of PCC—have also associated PCC approaches with increased satisfaction with care, improved patient enablement and functioning, and increased ability of caregivers to care for patients at home [13–18].
Positive outcomes have directed many health care organizations to consider consumer wants and needs as part of continuous quality improvement. Bechelet al. distinguished among
the concepts of patient-focused care, patient-based care and patient-centered care [19]. They argue thatpatient-focused care emphasizes tailoring services to patient needs as opposed to
providing generic services; andpatient-based care emphasizes processes at the individual level
as opposed to the unit or department level. Therefore, just because an organization collects patient perception data does not mean it is delivering PCC. Distinguishing among these simi-lar concepts can be important as organizations progress towards patient-centeredness in their care. Additionally, the bulk of literature on PCC is still shaped by professional perspectives on what PCC should entail [20,21], organizational models [22,23] or health system recommen-dations [2,9,24]. Research on patients’ perspectives on PCC is rare and often guided by, or conducted in conjunction with different professional or disciplinary perspectives [25–27]. This places emphasis on the need to incorporate patient’s perspectives and their experience of PCC in evidence generation, and in ensuring the successful implementation of PCC [28–31].
In sub-Saharan Africa, improvements of care for people living with HIV and the rising inci-dence of chronic illnesses necessitates care that takes into account the psychosocial aspects of health and illness, and advocates for relationships that promote shared decision making between patients and their health workers. This in turn has led to a global increase in interest regarding PCC, especially at primary level [32]. This is also demonstrated by a wide range of community-based interventions including reforms in the care of HIV patients [33], supporting adherence to treatment and home based care [15,34,35], and encouraging more patient autonomy. Although these are not purely PCC interventions, they have aspects of patient-cen-teredness incorporated within their implementation. Similar interventions have also been car-ried out in Uganda [36]. In 2015, the Ugandan Ministry of health included PCC as one of the objectives of the health sector development plan and quality improvement strategy [37,38]. However, its conceptualization is varied, implementation remains largely unmonitored and its impact on Uganda’s health consumers and providers remains unmeasured [39].
Since primary healthcare facilities are the first point of care, this article aims to provide evi-dence of patients’ perceptions of their experience of care and patient-centeredness at primary health facilities in Uganda; explore how patients perceptions varied according to the type of care they received (routine care, maternal and child health care and specialized care for specific health problems); and document if there are any key differences in the perception of care given by patients attending public versus private facilities. Using Uganda as a case, we make an empirical contribution to research, and the practice of PCC in similar contexts.
Conceptual framework
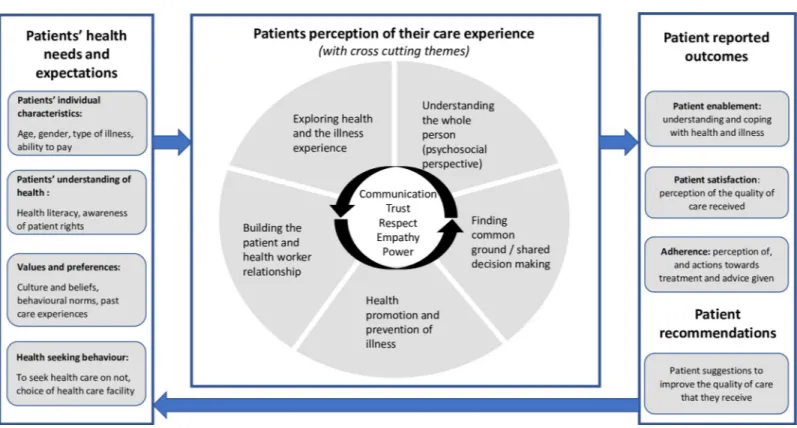
The exploration of patients’ perceptions on healthcare and patient-centeredness was based on a review of existing literature and tools used to measure patient perspectives of primary health-care. Our conceptual framework was designed considering these three main areas of explora-tion: (1) to understand the patients’ health needs, preferences and expectations, and factors
that influence their health-seeking behavior, (2) describe patients’ perceptions of their care experience and (3) articulate patient-reported outcomes and their recommendations of how to improve the quality of care that they receive as shown inFig 1.
The first part of the framework is about understanding patients’ health needs and expecta-tions. In detail, this involves looking at patients’ individual characteristics (their understanding of health and care provision, awareness of their rights as patients); their values and preferences (which could be shaped by past experience, culture and beliefs); and how this influences their decision on whether and where to seek health care.
The second part of the framework describes patients’ experience of PCC, related to five dimensions of PCC derived from the Stewartet al. and the Mead and Bower PCC models [40,
41]. These include:
1. Exploring the health, disease and illness experience: unique perceptions and experience of health, influence of patients’ history on preferences, and the illness experience (feelings, ideas, effects on function and expectations)
2. Understanding the whole person: for patients this means going beyond physical illness to explore psychosocial aspects of health and illness, proximal context (family, social support) and distal context (culture, community). For health workers, it is looking at the factors that influence their practice including training, experience, mentorship, attitudes, motivation and the work environment
Fig 1. Conceptual framework for exploring patients’ perceptions of patient-centered care at primary health care level in Uganda. A conceptual framework showing
the main areas of exploration during data analysis including: (1) to understand the patients’ health needs, preferences and expectations, and factors that influence their health-seeking behavior, (2) describe patients’ perceptions of their care experience and (3) articulate patient-reported outcomes and their recommendations of how to improve the quality of care that they receive.
3. Finding common ground between the doctor and the patient: how problems are identified and prioritized, making decisions and setting goals of treatment and management, the per-ception of roles of patients and health workers
4. Prevention and health promotion: sources of health information, messages and follow up on treatment and management goals after health facility visits, effects on work and daily life activities, recognition of complications and when to seek health care
5. Building the patient and physician relationship: aspects that influence communication and interaction including trust, compassion, empathy, self-awareness and mindfulness
It is important to note that patients’ experience of care may be influenced by contextual fac-tors in addition to the interaction with the health worker. In this article we consider some of contextual factors like proximity of the facility to the patients’ home, flexibility of opening and closing hours, waiting time, and ability to contact health workers if the facility is closed.
Thirdly, we wanted to measure how patients’ experience of PCC contributed to patient-reported outcomes. Patient satisfaction–the extent to which patients are happy with their healthcare; and patient enablement–the extent to which a patient is capable of understanding and coping with his or her health issues, were chosen as our main outcomes of interest [42]. In addition, we chose to include patient’s recommendations about how to improve care. How-ever, we did not include patient adherence as a reported patient outcome due to the expected diversity of responses depending on the type of illness, whether the patient had to buy addi-tional drugs, support at home and other factors that could not be comparable across patients or facilities.
Methods
Study design
This is a mixed methods cross-sectional study using patient exit survey questionnaires, semi-structured Interviews (SSIs), Focus Group Discussions (FGDs) and feedback meetings.
Study location
This study was conducted between late 2017 and 2018 in the eastern Ugandan districts of Iganga and Mayuge, within the Iganga Mayuge Health and Demographic Surveillance Site (IMHDSS). It has a population of about 67,000 people in about 13,000 households. The IMHDSS is located on the boundary between the districts of Iganga and Mayuge, about 115 km from the capital Kampala. The area is predominantly rural with only about 10% living in a peri-urban environment. The majority of people are of Busoga culture and speak of local lan-guage of Lusoga. The Ugandan health system is organized into six levels of health care: level I comprises of village health teams (VHTs) and community medicine distributors; Health Cen-tre II (HC II) led by an enrolled nurse; Health CenCen-tre III (HC III) led by a senior clinical offi-cer; Health Centre IV (HC IV) and/or district hospital led by a senior medical offioffi-cer; regional referral hospitals, and finally the National Referral and Teaching Hospital. Our study was con-ducted in the IMHDSS catchment area that has one district hospital, four government HC IIIs, three non-government HC IIIs, five government HC IIs and three Non-Governmental Orga-nization (NGO) HC IIs.
We selected level III facilities to enable the analysis of perceptions from patients visiting the facility for different forms of curative care. We specifically focused on people who came “once-off” at the clinic (routine care); women/parents coming as part of a pregnancy/child follow-up with planned re-visits whereby interpersonal relations with staff are bound to develop
(maternal and child health care); and patients with chronic illnesses coming for follow-up in specialized clinics where repeated visits and external evaluations result in different relation-ships to the health practitioners, health system and different expectations in terms of quality of care (specialized clinics).
A HC III has, on average, about 18 staff, led by a senior clinical officer, with a general outpa-tient clinic, a maternity ward and a laboratory. We selected five HC III facilities according to the following criteria: inclusion of both governmental as well as private health facilities in both urban and rural settings; different demographic and epidemiological characteristics; different experiences with community strategy and PCC approaches, if any. We selected three public HC IIIs and three private-for-profit HC IIIs (seeTable 2). Private health facilities are mostly located in semi-urban areas and have more clinical staff. Despite these differences, utilization rates, calculated as number of contacts per inhabitant (based on 2014 census) per year, are roughly similar in public and private facilities (ranging from 0.30 to 0.42 contacts per inhabi-tant per year) with the exception of facility 3 (utilization rate of 0.56). The utilization of routine all-round care services is many times higher than the utilization of maternal and child health care, and of more specialized care. Notable is that facility 6 is rather atypical: it has a substan-tially lower catchment population with fewer patients (in absolute numbers) using its services than is the case in the other five facilities, while focusing on care for pregnant women (see
Table 2in the results section). We decided therefore to exclude it from our analysis. Further detailed descriptions of the stakeholders involved in the provision of PCC at primary health care level in Uganda can be found in a paper by Waweruet al. [39].
Data collection
Development of tools to measure patient perceptions. Using the framework described,
we developed three data collection tools: patient exit questionnaires, semi-structured interview guides and focus group discussion topic guides (seeS1 Appendix). Validated tools and ques-tions were also added [40,43] and a tool used to measure quality of care at health centre level in Zimbabwe [44]. Further detail on how literature and existing validated tools contributed to the design of tools to measure PCC in Uganda can be found in Supplementary fileS1 Table—a table that compiles a detailed list of the dimensions (components of PCC), and the contribu-tion (adopted quescontribu-tions) of each validated instrument to each dimension.
The patient exit questionnaire included questions about why they chose to visit the facility, who they interacted with, and how long they had to wait at each health point. Questions about the patient’s perception of the care they received that day included a Likert scale score struc-tured according to the 5 dimensions of PCC (exploring perceptions on health and the illness experience, understanding the whole person, finding common ground, enhancing the patient doctor relationship, and health promotion). Semi-structured interviews (SSIs) were conducted to solicit patients’ perceptions on health-seeking behavior, who they thought was responsible for their health, their experiences at health facilities, their relationships with health workers and VHTs, their membership in support groups, their awareness of their rights and responsi-bilities as a patient, as well as how all these factors contribute to their perceptions of the quality of primary health care available to them (see sample questions in supporting fileS1 Appendix). A follow-up Focus Group Discussion (FGD) was held with patients from each facility–the same as those who had participated in the SSIs–to validate and clarify the key messages (seeS1 Appendix). As explained above, we did not collect data on adherence as the measurement techniques vary for different services and illnesses.
Sample calculation, training of field assistants and piloting. For the quantitative patient
average patient perceptions on their experience of PCC using frequencies between groups (public versus private) and services received (routine care, maternal and child health care or specialized care for patients with chronic illness) [45]. 60 patients were recruited per facility (20 patients receiving routine care, 20 receiving care at specialized clinics and 20 receiving curative care at the maternal and child health clinic). Our final sample of 300 patients, after the exclusion of patient responses from facility 6 was sufficient to describe the difference in mean scores for each dimension, and detect a mean difference of 0.3, with a significance level of 5% (p<0.05), at 90% power after accounting for 30% attrition, as outlined in a review on self-man-agement interventions for people living with HIV/AIDS in Africa by Aantjeset al. [46].
Four field assistants were selected based on their experience with both quantitative and qualitative research, three of them had also worked with the IMHDSS teams previously. They were trained for 2 weeks on the concept of PCC, how to administer the patient exit question-naires and how to moderate a focus group discussion. At the end of the training period the field assistants (under the supervision of the Principal Investigator (PI)) piloted the consent forms and tools with patients.
From the pilot testing, we edited some of the questions, for example, the questions on how many nurses, clinical officers or lab technicians was generalized to ‘how many health workers did you interact with today’ as we discovered patients could not distinguish cadres of staff (including ourselves). Some words like patient rights and responsibilities (idemberio) were not
easily understood and sometimes had to be explained from the starting point of a child’s right to be fed, protected etc.; and the mother’s responsibilities towards the child. Additionally, we also carried a summary of the patient rights charter to list the rights where the respondent did not understand completely. Empathy was also a concept that was understood as sympathy or taking pity and we had to train the field assistants to ask the question in order for the patient to understand it as ‘the health worker putting themselves in your position (wearing your shoes) and sharing your feelings’.
Exit questionnaires. Of the patients visiting the five HC IIIs, 300 patients were recruited
for exit surveys and 31 patients were purposively recruited for semi-structured interviews which were conducted at their homes. At each facility, the principal investigator (PI; first author EW) or a field assistant provided study information during the morning health talks and gained initial consent from patients interested to participate. Only patients receiving cura-tive care at the out-patient department of the five HCs were included in the study. Further-more, an effort was made to ensure that interviewees were representative of the three
categories of patients receiving (1) routine care, (2) curative maternal and child health care, or (3) attending a specialized clinic (people living with diabetes or HIV/AIDS). If the patient had provided initial consent, EW would request to sit in during their consultation with the health worker. After patients received curative care, a sequential sample was taken where every 5th patient for the routine care department; every 2ndpatient at the MCH or specialized clinic were recruited for an exit questionnaire interview. Only two patients refused to be interviewed citing lack of time and they were replaced. An interviewer-administered questionnaire was filled in for each selected patient / caregiver (in either the local language of Lusoga or English) (seeS1 Appendix). At each facility 60 exit interviews were conducted.
Interviews and focus group discussions. After the questionnaire, a request was made to
visit the patient at their home or a convenient location and date for them, for an SSI, including 2 patients from each of the 3 service areas. We also tried to keep a balance between male and female participants. In total, 31 SSIs were conducted (one facility had an extra patient interviewed).
A follow-up FGD was held with patients from each facility–the same as those who had par-ticipated in the SSIs–to validate and clarify the key messages. In total five FGDs were
conducted with 30 patients (5–7 patients in each FGD). In addition, 5 feedback talks were organized per facility with all patients present at the facility during morning health talks on the day of the scheduled feedback meeting (seeTable 1). Data was collected between February and August 2018.
Table 1. Summary of data collected from patients at primary health care facilities in Uganda. Patient exit
interviews
Semi-structured interviews
Focus group discussions (Number of patients in brackets: m-male, f-female)
Feedback talks with patients
Public primary health care facilities Facility 1 60 7 1 (4m, 3f) 1 Facility 2 60 6 1 (2m, 4f) 1 Facility 3 60 6 1 (2m, 3f) 1
Private primary health care facilities Facility 4 60 6 1 (3m, 3f) 1 Facility 5 60 6 1 (4m, 2f) 1 Total 300 31 5 (15m, 15f) 5 https://doi.org/10.1371/journal.pone.0236524.t001
Table 2. Characteristics of selected facilities and the number of patients receiving care at primary healthcare facilities in 2017.
Facility 1 Facility 2 Facility 3 Facility 4 Facility 5 Facility 6 Type of primary health care
facility Rural, Iganga district Semi-Urban, Iganga district Rural, Mayuge district
Semi-Urban, Iganga district Semi-Urban, Iganga district
Rural, Iganga district
Public HC III Public HC III Public HC III Private HC III Private HC
III (faith-based)
Private HC III
Catchment population of corresponding sub-county according to the 2014 census
42772 50478 30896 55263 29000 3583 2017 utilization (number of patients) 13328 16530 17290 20051 11827 1516 Number of patients per year per type of service Routine care 10598 14911 11769 � 10203 549 Maternal and child health care 1540 1211 2129 � 697 958 Specialized care 1190 408 3392 � 927 9
Utilization rates: number of contacts per inhabitant per year
0.31 0.33 0.56 0.36 0.41 0.42
Number of clinical Staff including clinical officers, nurses and laboratory technicians
12 9 12 31 22 4
Services offered in addition to routine Outpatient Care, Maternal and Child Health Care, laboratory testing services (which are offered by all)
Specialized care for patients with HIV/ AIDS and diabetes
Specialized care for patients with HIV/AIDS
Specialized care for patients with HIV/ AIDS and diabetes
Specialized care for patients with HIV/AIDS and diabetes, Inpatient care, dental care, ultra-sound and minor surgeries Inpatient care and minor surgeries Specialized in attending to pregnant women and young children
�for facility 4, we obtained an overall annual utilization rate, but have not the data to disaggregate utilization per type of service used
Data analysis
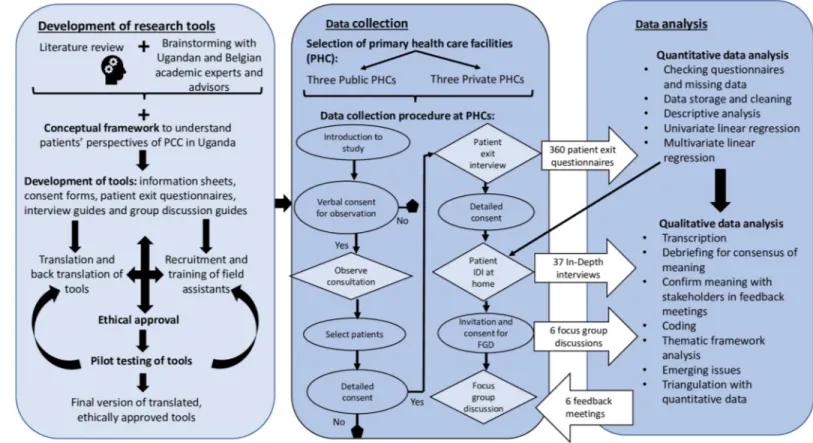
Data analysis was conducted according to the conceptual framework i.e. categorized into three major areas of exploration: (1) understand the patients’ health needs, preferences and expecta-tions, and factors that influence their health seeking behavior, (2) describe patients perceptions of their care experience, and (3) articulate patient reported outcomes and their recommenda-tions of how to improve the quality of care that they receive (seeFig 2).
Data from the survey questionnaire were entered into excel worksheets at the end of each day of data collection. Random checks were conducted by the PI to ensure completeness of data at the field. The compiled data was then imported to STATA version 14 where it was cleaned and data from one of the facilities was excluded as explained above (see data collection section). Although the ordinal variables have a rank order but cannot be conceived as having an underlying measurable standard (e.g. the interval difference between a strongly agree and agree response is not standardized), data from patient reported measures have been coded in this way to provide feedback that managers and policy makers can easily understand. For each question, strongly agree was recoded as 5 and strongly disagree as 1 so that higher values could reflect more patient-centeredness. Subsequently, for each of the PCC dimensions above, patients’ responses were then summed and normalized to fit on a scale of 1–100 i.e. (the sum of the scores / (number of questions�5))�100. This normalized score enables a comparison of patient experiences: across the 5 PCC dimensions, depending on the type of facility (public or private PHC), and according to the service that patients received (routine care, maternal and child health care and specialized clinic care for HIV/AIDS or Diabetes). The results were sum-marized in terms of the frequency of patients who gave positive or negative perceptions of
Fig 2. Procedures for data collection and analysis plan for study on patient perceptions of PCC in rural eastern Uganda.
PCC in public and private facilities, and normalized scores were calculated. For this article, chi-squared tests have been used to determine whether there are significant differences reported between patients attending public and private facilities (with a null hypothesis that there was no difference in patient-centeredness between public and private facilities). Within each category (public/private facilities) further descriptive analysis was conducted to describe differences in the perception of PCC in patients receiving routine care, maternal and child health care or specialized care. Determinants of the outcomes of interest (patient satisfaction and patient enablement) were investigated by performing univariate and multivariate regres-sions with patient perceptions of PCC, interaction effects, facility type, type of service received, age, gender and literacy as independent variables. Data on adherence was not presented because responses were too varied as they depended on the type of illness, whether the patient had to buy additional drugs, support at home and other factors that could not be comparable across patients or facilities.
Qualitative data was converted into digital text format for analysis. Audio recordings of SSIs and FGDs were transcribed, and notes from feedback sessions were typed. Any text in Lusoga was translated into English. The written text was imported into NVivo 11, a qualitative data analysis software, for organization and qualitative thematic framework analysis as described by Galeet al. [47]. Thematic framework analysis of SSIs and FGDs was begun in the field by the first author. Following the first phase of data collection using patient exit question-naires, qualitative questions were developed by the research team to clarify patient responses in the patient exit survey interviews. Emerging themes were added on while conducting the SSIs, and during de-brief meetings with translators. The themes were further explored and the information validated during follow-up FGDs and feedback meetings with patients. Post data collection, the research team developed a coding framework for use in NVivo 11 guided by the conceptual framework for understanding patients’ perception of PCC, and collected data. Data was coded according to the framework in NVivo 11 and organized into framework matrices or charts. Interpretation of data was conducted by the research team including the PI, research assistants who spoke the local language and supervisors. The interpretation of data was also validated through feedback meetings with patients, health workers and district health managers.
Ethics statement
Ethical approval for this study was obtained from the Institute of Tropical Medicine PhD com-mittee (IRB/AB/ac/081), the Institute of Tropical Medicine Institutional Ethics Review Board (1166/17); University of Antwerp Ethics Review Board (17/24/278); the Makerere University School of Public Health Institutional Review Board (500); and the Ugandan National Council for Science and Technology. Prior to participation, written informed consent was obtained from stakeholders at national, district and facility level. In cases where patients could not write or provide a signature, verbal informed consent was obtained from patients and recorded in the study’s copy of the informed consent form.
Results
This section will present the results in three parts as described by the conceptual framework, i.e. (1) patient needs and expectations, (2) patients’ perception of their care experience, and 3) the relation of patient experience to patient reported outcomes. We begin by describing the characteristics of the primary health care facilities, and the demographic characteristics of the 300 patients in public and private facilities.
Table 2presents the principal characteristics of the six facilities investigated, including the services on offer. Efforts were made to ensure a balance between public and private facilities, an inclusion of facilities in both rural and urban settings with comparable facility utilization. This led to the exclusion of facility 6 in subsequent analysis comparisons (see selection criteria section).
Table 3shows that most of the patients interviewed were between the age of 25 and 44 years (52.33%), female (79.00%) and could not read English (63.00%). Literacy was measured with the ability to read English because health information and information on patient rights was presented as visual aids written in English and posted on the facility walls. We notice a number of differences in the patient population groups attending public PHCs and the ones going to the private PHCs: the latter appear to be younger and more literate compared to the patients used the public PHCs. This is presented inTable 3below.
Patients’ needs and expectations
The first part of the conceptual framework conveys that patients’ needs and expectations can be shaped by the individual characteristics, values, preferences, patients’ understanding of health and health service provision. When patients were asked how they feel about their health and the health of their families, they gave mostly positive responses. Good health was related to a clean home and the availability of clean food and water. As expected, most patients also reported seeking healthcare only when a member of the family was feeling unwell. While the caregivers (mostly mothers) were the first to notice when a member of the family was ill, the decision to seek healthcare, and where to go was mostly made by the male heads of the house-holds. Specific to mothers of young children was also the importance of taking children for immunization. When asked about sources of health information most patients reported get-ting their information from health workers, the radio, local council members (information on sanitation) and Village Health Team (VHT) members. The responsibility for health was per-ceived to be more the responsibility of the health worker than of the patient.
Table 3. Demographic characteristics of interviewees involved in research exploring PCC in rural eastern Uganda.
Public PHCs Private PHCs Total
Number of facilities 3 2 5
Number of patients n = 180 n = 120 N = 300
Service received at the facility
Routine care 60 (33.33%) 40 (33.33%) 100 (33.33%)
Maternal and child health care 60 (33.33%) 40 (33.33%) 100 (33.33%)
Specialized care (Diabetes or HIV/AIDS clinic) 60 (33.33%) 40 (33.33%) 100 (33.33%)
Age 16–24 years 55 (30.56%) 25 (20.83%) 80 (26.67%) 25–44 years 76 (42.22%) 81 (67.50%) 157 (52.33%) Above 45 years 49 (27.22%) 14 (11.67%) 63 (21.00%) Gender Male 35 (19.44%) 28 (23.33%) 63 (21.00%) Female 145 (80.56%) 92 (76.67%) 237 (79.00%)
Literacy�(can read a letter written in English)
No 137 (76.11%) 52 (43.33%) 189 (63.00%)
Yes 43 (23.89%) 68 (56.67%) 111 (37.00)
Abbreviation PHC stands for primary health care facility.
There were no key differences in the responses of patients receiving care at public and pri-vate facilities, regarding their perceptions of health needs and expectations, exemplifying quotes are presented inBox 1.
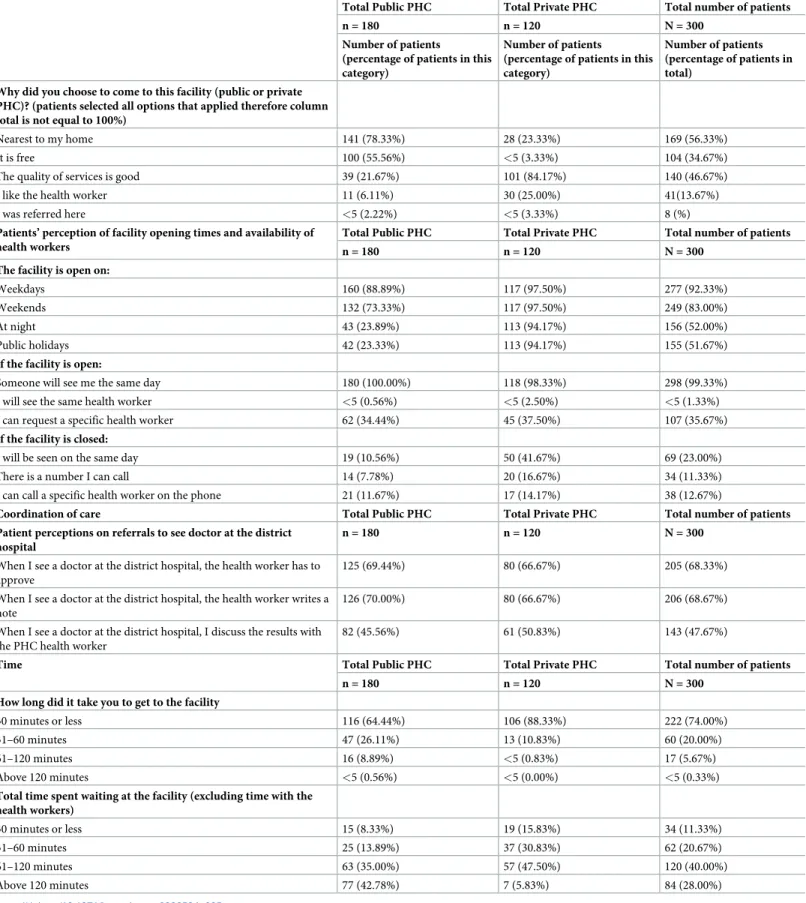
There were however some important differences in what patients expected while receiv-ing care at public and private facilities. Patients usreceiv-ing public facilities chose to do so because the public primary care facility is near to their homes (seeTable 4: 78.33% in public PHCs versus 23.33% in private PHCs) and its services are free of charge. On the other hand, patients attending private facilities said to do so because of the perception of better quality of care (84.17% in private PHCs versus 21.67% in public PHCs). Patients attending public facilities were also less positive about the facility being open at night or during holidays. In contrast, private facilities appear to be much more responsive through their offer of flexible opening hours, more options to contact health workers, and seeing the patients on the same day even when the facility is closed. With regards to referrals, above 60% of patients attend-ing both public and private primary health care facilities reported positive experiences with getting referral notes to see a doctor at the district hospital. However, less than half
(47.67%) reported discussing the outcome of the referral with their primary health worker during an occasional subsequent visit. Lastly, while it took most patients, whatever the type of facility used, less than an hour to get from their home to the facility, patients in public facilities spent more time at the facility with slightly below half (42.78%) reporting that they spent more than two hours waiting–excluding the time spent with the health worker and time taken for the interview. In contrast, patients receiving care in private facilities spent less time at the health care facility (seeTable 4).
Follow-up SSIs and FGDs confirmed that most patients valued the close proximity, fast ser-vice and availability of medication at drug shops especially at night. VHTs were also reported as
Box 1. Confirmatory quotes on patient expressions about their
health needs and expectations
Topic Exemplifying quote
Patient perception of health “I think the health of my family is good, I keep the house clean and feed the children well, I make sure there is also clean water for drinking, and they go to school” (MCH patient, Female, 31yrs, facility 1-public)
“I am the main care giver now, their mother passed away last year, so I have to make sure I take my medication, that the children eat well and go to school, I also talk to them when they are sad from time to time (special clinic for ART patient, Male, 27yrs, facility 4-private) Patient expectations of health care and
health seeking behavior
“It depends on how serious the disease is, first we give Panadol. If it doesn’t resolve we go to the drug shop nearby, but when the condition is serious we just go to the health facility” (MCH patient, female, 29yrs, facility 3-public)
“When someone in my house gets sick, I take them to hospital, unless it is at night, I give them Panadol as first aid then go to hospital in the morning” (MCH patient, female, 42yrs, facility 5-private) Sources of health information “There are those people [VHT members] who go around telling
mothers about immunization, then there are those who go around to make sure we have clean toilets [local council members]” (MCH patient, female, 38yrs, facility 4-private)
“Sometimes they also make announcements on the radio about keeping toilets clean, when there are free services at the health centre and so on” (routine care patient, male, 29yrs, facility 3-public)
Table 4. A comparison of patient expectations of care in public and private facilities.
Total Public PHC Total Private PHC Total number of patients
n = 180 n = 120 N = 300
Number of patients
(percentage of patients in this category)
Number of patients
(percentage of patients in this category)
Number of patients (percentage of patients in total)
Why did you choose to come to this facility (public or private PHC)? (patients selected all options that applied therefore column total is not equal to 100%)
Nearest to my home 141 (78.33%) 28 (23.33%) 169 (56.33%)
It is free 100 (55.56%) <5 (3.33%) 104 (34.67%)
The quality of services is good 39 (21.67%) 101 (84.17%) 140 (46.67%)
I like the health worker 11 (6.11%) 30 (25.00%) 41(13.67%)
I was referred here <5 (2.22%) <5 (3.33%) 8 (%)
Patients’ perception of facility opening times and availability of health workers
Total Public PHC Total Private PHC Total number of patients
n = 180 n = 120 N = 300
The facility is open on:
Weekdays 160 (88.89%) 117 (97.50%) 277 (92.33%)
Weekends 132 (73.33%) 117 (97.50%) 249 (83.00%)
At night 43 (23.89%) 113 (94.17%) 156 (52.00%)
Public holidays 42 (23.33%) 113 (94.17%) 155 (51.67%)
If the facility is open:
Someone will see me the same day 180 (100.00%) 118 (98.33%) 298 (99.33%)
I will see the same health worker <5 (0.56%) <5 (2.50%) <5 (1.33%)
I can request a specific health worker 62 (34.44%) 45 (37.50%) 107 (35.67%)
If the facility is closed:
I will be seen on the same day 19 (10.56%) 50 (41.67%) 69 (23.00%)
There is a number I can call 14 (7.78%) 20 (16.67%) 34 (11.33%)
I can call a specific health worker on the phone 21 (11.67%) 17 (14.17%) 38 (12.67%)
Coordination of care Total Public PHC Total Private PHC Total number of patients Patient perceptions on referrals to see doctor at the district
hospital
n = 180 n = 120 N = 300
When I see a doctor at the district hospital, the health worker has to approve
125 (69.44%) 80 (66.67%) 205 (68.33%)
When I see a doctor at the district hospital, the health worker writes a note
126 (70.00%) 80 (66.67%) 206 (68.67%)
When I see a doctor at the district hospital, I discuss the results with the PHC health worker
82 (45.56%) 61 (50.83%) 143 (47.67%)
Time Total Public PHC Total Private PHC Total number of patients
n = 180 n = 120 N = 300
How long did it take you to get to the facility
30 minutes or less 116 (64.44%) 106 (88.33%) 222 (74.00%)
31–60 minutes 47 (26.11%) 13 (10.83%) 60 (20.00%)
61–120 minutes 16 (8.89%) <5 (0.83%) 17 (5.67%)
Above 120 minutes <5 (0.56%) <5 (0.00%) <5 (0.33%)
Total time spent waiting at the facility (excluding time with the health workers) 30 minutes or less 15 (8.33%) 19 (15.83%) 34 (11.33%) 31–60 minutes 25 (13.89%) 37 (30.83%) 62 (20.67%) 61–120 minutes 63 (35.00%) 57 (47.50%) 120 (40.00%) Above 120 minutes 77 (42.78%) 7 (5.83%) 84 (28.00%) https://doi.org/10.1371/journal.pone.0236524.t005
useful in interpreting health information about preventive care (e.g. immunization), but were not consulted when someone was ill or had social problems (seeBox 2for exemplifying quotes).
Patients’ perception of their care experience
This section deals with patients’ perceptions of patient-centeredness and their care experience (seeFig 1). To begin,Fig 3is a Likert plot that shows the responses to individual questions related to the dimensions of PCC.
The bars indicate the percentage of patients who responded strongly agree, agree, neutral, disagree or strongly disagree to each question/statement. In order to facilitate interpretation, neutral, disagree and strongly disagree were plotted as negative responses (on the left side); while agree and strongly agree were plotted as positive responses (on the right side) as shown inFig 3. More detail on the individual questions asked in the exit questionnaire can be found in supplementary fileS2 Table.
Table 5shows that overall, patients perceived services to be slightly more patient-centered in private facilities (60.6) than in public facilities (57.54). High scores (above 70) were given in exploring health and the illness experience. These scores remained similar for patients receiv-ing different types of services in both public and private PHCs. With regards to understandreceiv-ing the whole person, overall scores were slightly below the half way score of 50, with public facili-ties having slightly higher scores than private facilifacili-ties. In public facilifacili-ties, patients receiving specialized care gave higher scores (56.2) than those receiving routine care (47.2) or maternal and child health care (46.3). In private facilities, patients receiving specialized care also gave the highest scores (54.8). Looking at shared decision making, scores for both public and private facilities were around the half way mark. However, it is clear that patients receiving maternal and child health care gave the lowest scores (44.5). Health promotion was better perceived in private (60.7) than in public facilities (54.3). Lastly, patients’ perceptions of their relationships with health workers were similar across types of facilities and according to the services they received (ranging from 62.1 to 64.9).
Linear regression was conducted to estimate the differences in normalized scores of PCC across type of PHC and care provided (see data analysis section for description on normalized
Box 2. Exemplifying quotes on patient expectations, preferences
and choice of facilities
Topic Exemplifying quotes
Patient needs and expectations before the visit
“We go to the facility to get care and medication, sometimes you’ll get what you need, sometimes you will not. It depends on whether the health worker is there, if they can do the tests and if there are medicines in the store; if you are unlucky, you have to go and get tested or buy medication somewhere outside the facility. . .” (routine care patient, male, 39yrs, facility 2-public) “Here (at the facility) they have everything, it’s just about if you can pay for it” (routine care patient, female, 29yrs, facility 5-private)
Patient preferences “I like the health workers here, they take good care of us and so if I have to take a boda boda to reach here, it is okay” (special clinic for diabetic care patient, male, 49yrs, facility 1-public)
“Here they have a lab where you can get all the tests done and you can get all the types of drugs for the sickness” (MCH patient, female, 29yrs, facility 5-private)
“When I go to a doctor or the VHT, I don’t want them to tell others–that one is suffering from Syphilis, or AIDS–so I would rather pay a little money and have peace” (special clinic for ART patient, male, 39yrs, facility 4-private)
scores). The results are displayed inTable 6below. For PCC dimension 1—exploring health and the illness experience, there was a five-point significant difference with patients receiving care in private PHCs giving higher scores (P<0.001). For this first dimension, among the patients using the public facilities, those receiving routine care reported the highest scores fol-lowed by maternal child healthcare and lastly patients receiving specialized care as indicated by negative differences when comparing these services to routine care. This was however dif-ferent to patients who visited private facilities where patients receiving maternal and child healthcare reported the highest PCC scores with a positive coefficient of 3.2 points when com-pared to routine care. For PCC dimension 2—understanding the whole person, there were (non-significant) differences in comparing specialized care to routine care for both public (9-point difference) and private facilities (10.5-point difference). For PCC dimension 3—
Fig 3. Patients’ perceptions of patient-centered care dimensions and patient reported outcome measures. Fig 3 is a Likert plot that shows the
responses to individual questions related to the dimensions of PCC. The bars indicate the percentage of patients who responded strongly agree, agree, neutral, disagree or strongly disagree to each question/statement. In order to facilitate interpretation, neutral, disagree and strongly disagree were plotted as negative responses (on the left side); while agree and strongly agree were plotted as positive responses (on the right side). More detail on the individual questions asked in the exit questionnaire can be found in supplementary file (seeS2 Table).
Table 5. Descriptive results when patient responses are summed and normalized to fit in a PCC point score of 1–100. Normalized score out of 100 (higher scores
interpreted as more patient-centered)
RC MCH SC Total Public PHC (Confidence interval)
RC MCH SC Total Private PHC (Confidence interval) n = 60 n = 60 n = 60 n = 40 n = 40 n = 40
PCC dimension 1: Exploring health and the illness experience
73.5 71.7 70.6 71.9 (28.2–97.6) 75.3 78.4 77.1 76.9 (61.1–98.8)
PCC dimension 2: Understanding the whole person 47.2 46.3 56.2 49.9 (27.5–90) 44.3 46.8 54.8 48.6 (25.0–87.5)
PCC dimension 3: Finding common ground-decision making
48.4 44.5 52.1 48.4 (25.3–80) 47.8 52.9 56.5 52.4 (28–84)
PCC dimension 4: Health promotion 57.5 51.8 53.5 54.3 (20–100) 61.8 54.8 65.5 60.7 (20–100)
PCC dimension 5: Relationship between patient and health worker
62.1 63.2 64.4 63.2 (46.2–76.9) 63.9 64.9 64.6 64.4 (52.3–78.5) Total mean 57.74 55.5 59.36 57.5 (37.6–78.5) 58.62 59.56 63.7 60.6 (45.5–83.1)
RC: Routine care.
MCH: Maternal and child health care.
SC: Specialized care for people living with HIV/AIDS or Diabetes. PHC: primary health care facility.
https://doi.org/10.1371/journal.pone.0236524.t007
Table 6. Testing the significance of differences in normalized PCC scores according to the type of facility patients visited, and the type of service they received, in rural eastern Uganda.
Difference of normalized scores between respondents attending public and private PHCs (with public as the reference category)
Co-efficient (confidence interval) PCC dimension 1: Exploring health and the
illness experience
5.0 (2.9–7.1)���
PCC dimension 2: Understanding the whole person
-1.3 (-3.8–1.2) PCC dimension 3: Finding common
ground-decision making
4.1 (1.3–6.8)��
PCC dimension 4: Health promotion 6.4 (1.1–11.6)�
PCC dimension 5: Relationship between patient and health worker
1.2 (-0.0–2.5)
Public PHCs Private PHCs
Comparing MCH to Routine care
Comparing Specialized care to Routine care
Comparing MCH to Routine care
Comparing Specialized care to Routine care Coefficient (Confidence interval) Coefficient (Confidence interval) Coefficient (Confidence interval) Coefficient (Confidence interval)
PCC dimension 1: Exploring health and the illness experience
-1.8 (-5.1–1.5) -3.0 (-6.3–0.4) 3.2 (-0.6–7.0) 1.9 (-2.0–5.7)
PCC dimension 2: Understanding the whole person
-0.8 (-4.3–2.7) 9 (5.5–12.5) 2.6 (-1.8–7.0) 10.5 (6.1–14.9)
PCC dimension 3: Finding common ground-decision making
-3.9 (-7.7 - -0.0) 3.7 (-0.1–7.6) 5.1 (-0.4–10.6) 8.7 (3.2–14.2)
PCC dimension 4: Health promotion -5.7 (-13.8–2.5) -4.0 (-12.1–4.2) -7.0 (-16.9–2.9) 3.8 (-6.1–13.6)
PCC dimension 5: Relationship between patient and health worker
1.0 (-0.8–2.9) 2.2 (0.4–4.1) 1.0(-1.5–3.5) 0.7 (-1.8–3.2)
MCH: Maternal and child health care. PHC: Primary health care facility. P value asterisk
�P<0.05 ��P<0.01 ���P<0.001.
finding common ground and shared decision making, there was a positive 4-point significant difference in scores when comparing private facilities to public facilities (P<0.01).
Patients receiving maternal and child health care in public facilities gave, on average, lower scores than those receiving routine care, indicating that specialized care is associated with a lessened perception of being involved in decision-making. However, this association is reversed in private PHCs, where patients receiving specialized care gave higher scores than those receiving routine care. In terms of PCC dimension 4—health promotion, it seems that patients have better perceptions of care if they received routine care or specialized care in a pri-vate facility. Otherwise the coefficient differences are negative and more so for patients receiv-ing maternal and child healthcare in private facilities. The overall comparison also shows that the 6.4 difference when comparing private facilities to public facilities is borderline significant (P<0.05). Results for the fifth dimension—relationship between patient and health worker, show that patients are likely to have slightly more positive perceptions of PCC if they were attended to in private facilities and if they received maternal and child care or specialized care compared to routine care. The differences are however slight and not found to be statistically significant (seeTable 6below).
Qualitative data was also collected to elaborate patient responses and gather information on factors that lead to perceived positive or negative experiences related to PCC. These are illus-trated with exemplifying quotes inBox 3. In exploringperceptions of health and illness, most
patients indicated that they perceived the health workers being responsible for, and most knowledgeable about the patients’ health. A few patients also said God was responsible for healing. At home, the household head (in most cases a man) was responsible for making deci-sions about when and where to seek treatment. The women (mothers, daughters and grand-mothers) were responsible for ensuring homes were kept clean, children were fed, and that those who were ill followed the instructions given by the health worker or drug shop owner (the latter being visited when the illness was not perceived as very severe). In the Busoga cul-ture, illness is part of everyday life and is even included as part of the morning greeting (ebiku-luma) which translates to “how is your sickness”. With the exception of immunization,
healthcare is also only sought when one is ill. These cultural considerations are important in determining the patient preferences and health-seeking behavior. Depending on the perceived illness, most patients receiving care in public facilities preferred to give painkillers at home or speak to the attendant in a drug shop before going to the facility, especially if the episode of ill-ness began at night (seeBox 3section on exploring the health and illness experience).
Understanding the whole person entails looking at the psychological, emotional and social
aspects of healthcare. Most patients felt it was not the responsibility of the health worker to dis-cuss emotional and psychological aspects of their health with many saying“it is disturbing the health worker”, and were also afraid of the health workers reaction to discussing personal
issues. Consequently, they appropriated this role to family and friends. Patients did not discuss how their illness was affecting their day-to-day activities at home and were more attentive to instructions on medical treatment as opposed to diet or reducing stress. Patients receiving spe-cialized care, and especially people living with HIV, received more encouragement to discuss how their illness was affecting their daily life. Some patients also gave examples of little things that health workers did to make them feel understood—like giving a clean t-shirt to a mother whose child had vomited on them, she greatly valued this action that made her feel seen and understood (seeBox 3).
Finding common ground (or shared information and decision making) was perceived to be
influenced by desirable characteristics of the patient and the health worker. Patients’ felt that the communication with the health worker was enhanced when there was trust. This was expressed from pleasant past experiences, kind language, keeping patients’ secrets and
providing a private setting for consultation. Patients’ did not feel appreciated when health workers were late and were less likely to express their thoughts about their illness if the health worker was harsh, or did not answer their questions. For instance, patients who felt that the
Box 3. Exemplifying quotes on patient experiences of care related to
PCC
Experiences perceived as positive and promotive of PCC Experiences perceived as negative and unresponsive to PCC
PCC dimension 1: Exploring health and the illness experience
Responsibility for health “The health worker is responsible for my health. He is the one to do the test, know what is wrong and give me medication to make me go back to normal”(routine care patient, male,
44yrs, facility 2-public)
“I am the one who takes care of the home, I keep it clean, prepare the food and when my children are not feeling well, I am the first one to notice and tell my husband. . . he decides what we are going to do”
(MCH patient, female, 29yrs, facility 5-private)
Health seeking behavior “It depends on how serious the disease is, first we give Panadol, if it doesn’t resolve we go to the drug shop nearby, but when the condition is serious we just go to the health facility”
(MCH patient, female, 29yrs, facility 3-public)
Difficulty in expressing illness and symptoms “it was my first time to meet this health worker, there are many
people waiting, I felt like he was rushed so there was no time for stories, i said my most pressing problems so that others can also be seen” (routine care patient, female 31yrs, facility 2-public)
PCC dimension 2: Understanding the whole person
Comfortable environment“I like this facility because I go to see the health worker in a room by myself so I am not afraid or ashamed, that other people will hear what I am saying. They also have a very positive attitude, they listen and they are kind, they cannot be rude. When you ask a question it is answered” (routine care patient, male, 39yrs,
facility 4-private)
Interest in the effect of illness on daily life“it when the nurse told me that I was positive (living with HIV) but that I could still live a long life if I took medication and stayed healthy. She also counselled me on how to stay calm and helped me to share the news with my wife who was not happy at first but now we are working and living together”
(Special clinic for ART patient, Male, 33yrs, facility 3-public)
The little things“I brought my son here and he was shaking and vomiting, he vomited on me. . . they took good care of my son and they also took care of me, they gave me a clean t-shirt and a nurse sat with me and counselled me, I was very touched, I pray for them every day” (MCH caregiver with sick child, female 34yrs, facility 5-private)
Emotional and psychological issues are not perceived as part of health or the responsibility of the health worker
“I would never talk about such issues with the health worker, those are my thoughts and my issues, if I cannot handle them I talk to my family or elder people, not the health workers, they are there to treat the sickness in my body” (routine care patient, female 32yrs, facility
4-private)
“Imagine if I went in to see the health worker and they asked me. . .what is the problem? And I answer I am having many thoughts or stress (laughs) they would just laugh and tell everybody at the facility” (MCH patient, female, 46yrs, facility 1-public) Lack of privacy“When there are other patients around at the time when the health worker is talking to you, you cannot share intimate information, so you have to wait until the other people have been seen or you come on another day” (routine care patient, female, 27yrs,
facility 3-public) PCC dimension 3: Finding
common ground-decision making
Health literacy“of us who are not very well informed, when we have questions, we are afraid to ask because we might disturb the musawo (health worker) but they write in the book and we go and ask the VHT what was written in the book” (Special clinic for ART patient, male,
28yrs, facility 2-public)
Information sharing“I always ask questions when I don’t understand, because I am paying for this care, if I don’t ask I will have to come back and pay again! The good thing is the health worker always answers and I understand what to do next” (routine care
patient, male, 34yrs, facility 4-private)
Awareness of patient rights
“I read them on the wall every time I come to the facility so I know my rights and if I don’t get them, I will ask to speak to the administrator”
(routine care patient, male, 33yrs, facility 4-private)
Low expectations for involvement in care
“I am satisfied, I did not understand why they did the test (blood test) but I got medication, and I feel better” (patient, male, 44yrs, facility
1-public)
“I always bring the book with me but I don’t know what is written in it, should I ask?” (MCH patient, female, 20yrs, facility 2-public) Fear of asking questions
“when you ask questions or say I have a right to know, you just better get another health facility because the health workers will not want to deal with you, they say [the one with many questions has come]”
(routine care patient, female, 45yrs, facility 1-public)
No avenues for conflict resolution“If I am not happy with a health worker or the service, there is no place or person I can go to, I keep it with myself or just shift to another facility” (routine care patient,
male, 41yrs, facility 3-public) PCC dimension 4: Health
promotion
Information sources “here we get most of our information from
people who go around with a public address system (confirmed as VHTs) sometimes they also make announcements over the radio for things like clean toilets or proper places we should keep waste” (routine care patient, male, 39yrs, facility 4-private)
Home visits“I was actually surprised a few weeks ago I was very sick and could not go to the facility to get my medication, but the social worker came all the way to my home to bring the medication, I was very happy and grateful, they should continue like that” (special clinic
for ART patient, male 29yrs, facility 4-private)
Individual advice “after getting examined, the health workers always tells me if my pressure (blood pressure) is improving or bad, they emphasize that I need to eat well and exercise” (special clinic for
diabetes patient, female, 43yrs, facility 1-public) PCC dimension 5: Relationship
between patient and health worker
Desired characteristics of health workers
Considerate“The nurses who treat us (patients living with diabetes) are very responsible, they know that we are not allowed to eat before the morning tests and they always come on time and much earlier than the other health workers, we appreciate that” (special clinic for
diabetes patient, male, 49yrs, FGD facility1- public)
Desired characteristics of patients
“You have to present yourself well when you go to the facility and carry all the things that you will need” (MCH patient, female 31yrs, facility 3-public)
“We also need to say thank you and appreciate our health workers, then you will always get good service, sometimes I also bring some food from the farm and they are very happy” (MCH patient, male, 36yrs, facility 1-public)
Undesired characteristics of health workers
Late and hurried “Here we always have to wait for a long time
sometimes until 11. . .and when they come, they want to leave early, this can make you angry if you have been waiting and at the end of the day, you are told to come tomorrow” (MCH patient, female 26years, facility 2-public)
Undesired characteristics of patients “Sometimes we patients also
go the facility when we are dirty and that can scare health workers, then they fail to take good care of us. Now when I have to go to the clinic, I make sure I am clean”
“To add to that some patients are also very rude, angry or showing off to the health workers, so the health workers avoid them, we can’t blame the health workers all the time”
(FGD facility 1-public)
“in the labor ward, they don’t like it if you cry a lot” (MCH patient, female, 22yrs, facility 4-private)