HAL Id: hal-02741323
https://hal.inrae.fr/hal-02741323
Submitted on 3 Jun 2020
HAL is a multi-disciplinary open access
archive for the deposit and dissemination of
sci-entific research documents, whether they are
pub-lished or not. The documents may come from
teaching and research institutions in France or
abroad, or from public or private research centers.
L’archive ouverte pluridisciplinaire HAL, est
destinée au dépôt et à la diffusion de documents
scientifiques de niveau recherche, publiés ou non,
émanant des établissements d’enseignement et de
recherche français ou étrangers, des laboratoires
publics ou privés.
Key traits associated with potential grain weight in
selected CIMCOG genotypes
Alejandro Quintero, Gemma Molero, Matthew Reynolds, Jacques Le Gouis,
Daniel Calderini
To cite this version:
Alejandro Quintero, Gemma Molero, Matthew Reynolds, Jacques Le Gouis, Daniel Calderini. Key
traits associated with potential grain weight in selected CIMCOG genotypes. International (Trigo)
Wheat Yield Potential, Mar 2013, Ciudad Obregon, Sonora, Mexico. 59 p. �hal-02741323�
TRIGO (Wheat) Yield Potential
WORKSHOP 2015
Proceedings of the International
CENEB, CIMMYT, Cd. Obregón, Sonora, México
24-26th March, 2015
23
Key traits Associated with Potential Grain Weight in Selected CIMCOG
Genotypes
Alejandro Quintero1,2, Gemma Molero2, Matthew Reynolds2, Jacques Le Gouis3, 4 and Daniel F. Calderini1
1
Universidad Austral de Chile, 2CIMMYT Mexico; 3UBP France3 and 4INRA France
Abstract
To increase grain yield potential of wheat and breeding efficiency the trade-off between grain number and kernel weight should be minimized by (i) improving the balance between the two main yield components or by (ii) increasing kernel weight potential. The aim of this study was to evaluate the trade-off between kernel weight and grain number and to assess key drivers of kernel weight potential in a selected set of 8 genotypes from the CIMCOG population. These genotypes were evaluated during the 2014/15 seasons in Valdivia (Chile) to confirm previous associations recorded in Ciudad Obregón in the light that contrasting relationships between grain yield and grain number were found in these environments. A lower trade-off between kernel weight and grain number was recorded in Valdivia where higher grain weight was reached. However, individual kernel weight showed a close association with the volume and length of grains in positions G2 and G4. In addition, kernel weight of G4 also showed association with kernel wide. Interestingly, thinning treatments augmenting the availability of resources since booting on increased both grain number and kernel weight.
Introduction
The need of increasing grain yield of wheat and the trade-off between grain number (GN) and average grain weight (TGW), reinforced by the negative relationship between these components in the CIMCOG genotypes (Wiersma et al., 2001; Sadras, 2007; Quintero et al., 2014), highlight the aim of improving TKW in breeding programs. Molecular assisted breeding in crops requires uncovering the importance of particular genes in the determination of complex traits as grain yield to improve the efficiency of plant breeding of crops for food production. Identifying the functionally linked mechanisms of yield components, i.e., grain number (GN) and average grain weight (TGW), and understanding their genetic bases, is necessary at the present to boost yield potential of wheat. From a physiological perspective, the knowledge of grain number and kernel weight determination provide important clues for a successful phenotyping and genotyping evaluation. The time-course of flowers, carpels weight, grain length and grain water content studied in the last years offer helpful trails (Ferrante et al., 2010; 2013; Calderini et al., 2001; Hasan et al., 2011). Additionally, molecular biology also delivered crucial information to build a physiological-genetic framework. Sugar signaling affecting both grain set and kernel weight (Ruan et al., 2010; Wang and Ruan, 2013), programed cell death and autophagy conditioning grain set (Ghiglione et al., 2008; Wang and Ruan, 2013), the expression of TaExpA 6 gene driving grain length (Lizana et al., 2010) and TaGW2 gene expression modifying grain wide (Bednarek et al., 2012; Simmonds et al., 2014) will be the foundations to identify promising lines by phenotyping and genotyping.
In previous evaluations of CIMCOG genotypes carried out in Ciudad Obregón, curvilinear associations were found between grain yield and GN, negative associations were identified between TKW and GN and positive relationships between TKW and grain weight of grain positions G2 were found (Quintero et al., 2014). Promising traits of individual kernel weight (IKW) were detected such as grain volume, grain length and water content of grains, which could be phenotyped in doubled haploid and RIL populations. On the hand, contrasting results were found in the CIMCOG population evaluated in a very high yielding environment like that of southern Chile where a line association between grain yield and GN was recorded. Therefore, the present study has the aim of confirming or refuting previous relationships found in C. Obregón between traits and the promising characters in the environment of southern Chile
Materials and Methods
One set of 8 contrasting genotypes in the arrangement of thousand grain weight (TKW) and grain number (GN) chosen from the 60 CIMCOG´s genotypes were assessed at the Estación Experimental Agropecuaria Austral (39˚ 47' 18"S, 73˚ 14' 5"O) of Universidad Austral de Chile (UACH), Valdivia, Chile, during the 2014–2015 growing season. The set was sown on 27 of August in 2014 under two thinning treatments (control and thinning rows in booting). Plots were arranged in a completely randomized design with 3 replicates. At the control treatment the genotypes were sown in plots 2.5 m long and 1.35 m wide, while in the thinning treatment plot dimensions were 3.5 m long and 1.35 m wide. Seed rate was 333 seeds per square meter in both treatments. The thinning treatment was carried out at booting to increase the
availability of resources to the remaining plants. The thinning was carried out by removing all the plant of the two closer rows of plants. Additionally, the source-sink ratio was increased in 5 control and 5 thinning plants at heading and 10 days
after anthesis by halving the spikes. The plots were irrigated when necessary; weeds were periodically removed by hand and recommended doses of pesticides were used to prevent and control insects and diseases.
In the experiment the phenological stages were recorded (Zadoks et al., 1974). The timing of physiological maturity was estimated when grain growth stopped as in Hasan et al. (2011). At harvest, grain yield, GN and TKW were recorded. The individual kernel weight (IKW) and grain dimensions of grain position 2 (the second grain from the rachis: G2) and grain position 4 (the fourth grain from the rachis: G4) of two central spikelets were measured in at least 5 spikes per plot. Grain volume was calculated as in Hasan et al. (2011).
Twenty two main-shoot spikes of similar size and development were targeted at anthesis at each plot to follow grain growth. From anthesis on, two main shoot spikes were harvested 11 times (A+5, A+10, A+15, A+20, A+25, A+30, A+35, A+42, A+48, A+54 and A+60). The individual grain weight (IGW) was measured in G2 and G4. At each sampling two main-shoot spikes per plot were harvested.
Data were subjected to analysis of variance (ANOVA), and mean comparison by least significant difference procedure. Correlation analyses were also performed to assess the degree of association between variables.
Results
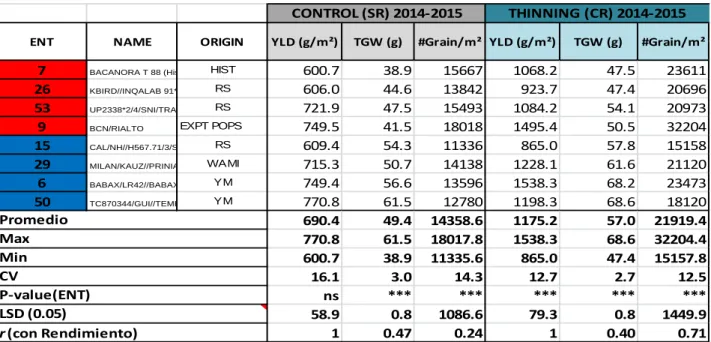
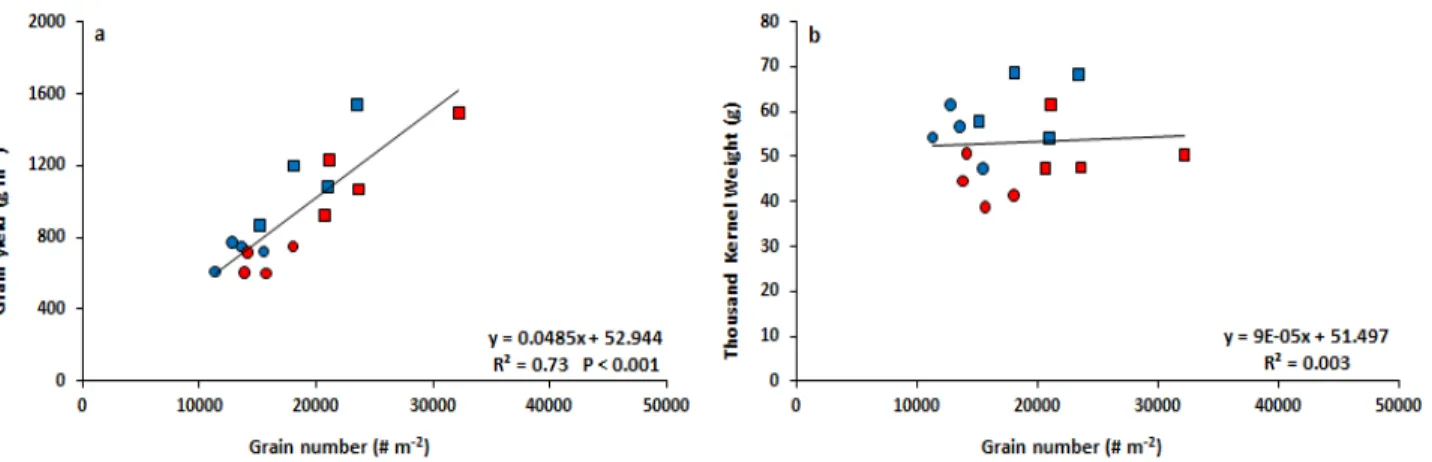
The nine genotypes evaluated in Valdivia in 2014-2015 reached grain yield between 600.7 and 770.8 g m-2 in control treatments although no differences were found (P>0.05). On the other hand, yield components ranged from 11336 to 18018 for GN and from 38.9 to 61.5 g for TKW. On the other hand, plants under the thinning treatment at booting showed grain yield from 865 to 1538 g m-2. The GN and TKW at the thinning treatment ranged between 15158 and 32204 grains m-2, and 47.4 to 68.6 g, respectively (Table 1). Taking into account recorded grain yield, the thinning treatment over-yielded the control from 42 to 105%. A positive relationship between grain yield and GN was found, while no association was detected between either grain yield and TKW (P>0.05) and between TGW and GN when all treatments were plotted together (Fig. 1). Interestingly, both GN and TKW were increased by the thinning treatment (Fig. 2), however, the response of GN to thinning was higher than that of TKW taking into account that GN increased 52%, while TKW only 16%, averaged across of the genotypes.
Table 1. Grain yield, TKW and GN of 8 genotypes under control and thinned plots evaluated in Valdivia (Chile) during the 2014-2015 growing season.
Note: Genotypes with high GW and low GN (blue color), genotypes with low GW and high GN (red color). Values of YLD, TKW and
GN in both treatments are means of three replicates. ns means not significant effects between treatments. * Significant different between treatments at P < 0.05. ** Significant different between treatments at P < 0.01. *** Significant different between treatments at P < 0.001.
7 BACANORA T 88 (His HIST 600.7 38.9 15667 1068.2 47.5 23611
26 KBIRD//INQALAB 91* RS 606.0 44.6 13842 923.7 47.4 20696
53 UP2338*2/4/SNI/TRAP RS 721.9 47.5 15493 1084.2 54.1 20973
9 BCN/RIALTO EXPT POPS 749.5 41.5 18018 1495.4 50.5 32204
15 CAL/NH//H567.71/3/S RS 609.4 54.3 11336 865.0 57.8 15158 29 MILAN/KAUZ//PRINIA WAMI 715.3 50.7 14138 1228.1 61.6 21120 6 BABAX/LR42//BABAX YM 749.4 56.6 13596 1538.3 68.2 23473 50 TC870344/GUI//TEMP YM 770.8 61.5 12780 1198.3 68.6 18120 690.4 49.4 14358.6 1175.2 57.0 21919.4 770.8 61.5 18017.8 1538.3 68.6 32204.4 600.7 38.9 11335.6 865.0 47.4 15157.8 16.1 3.0 14.3 12.7 2.7 12.5 ns *** *** *** *** *** 58.9 0.8 1086.6 79.3 0.8 1449.9 1 0.47 0.24 1 0.40 0.71 CV P-value(ENT) LSD (0.05) r (con Rendimiento) #Grain/m² Promedio Max Min YLD (g/m²) TGW (g) CONTROL (SR) 2014-2015 THINNING (CR) 2014-2015
25
Figure 1. Relationships between grain yield and GN (a) and between average grain weight (TKW) and GN (b) of 8 genotypes evaluated in Valdivia (Chile) during the 2014-2015 growing season. Control treatment (circle symbols) and thinning treatment (square symbols) are shown. Genotypes with high GW and low GN (blue) and genotypes with low GW and high GN (red).
Figure 2. Relationships of grain number (a) and thousand kernel weight (b) between the thinning and control treatments of 8 genotypes contrasting in TKW and GN arrangement evaluated in Valdivia (Chile) during the 2014-2015 growing season. The line shows the 1:1 ratio. Genotypes with high GW and low GN (blue) and genotypes with low GW and high GN (red).
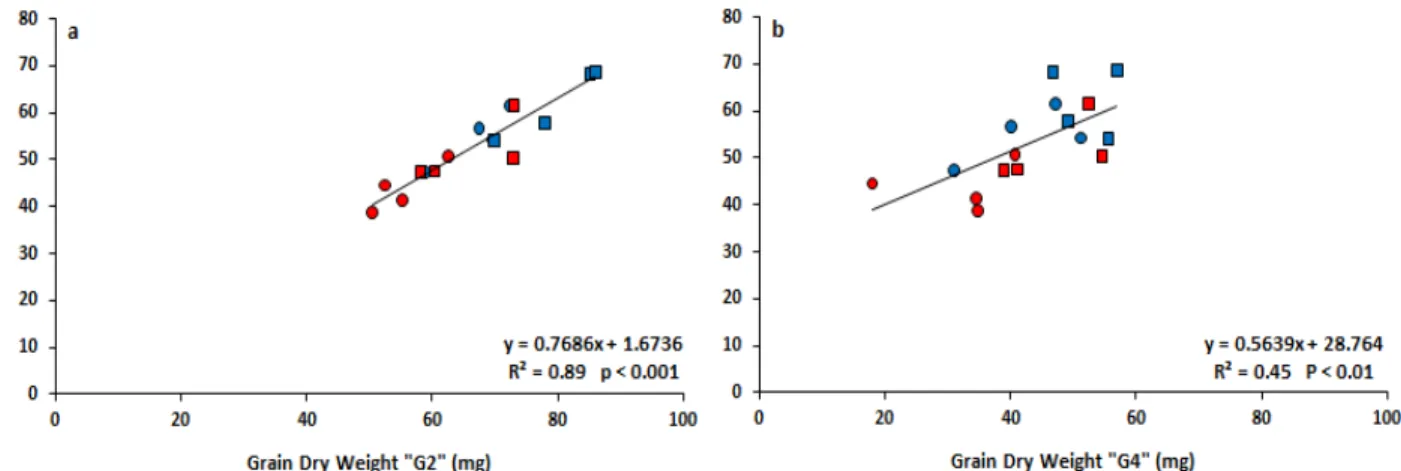
A highly significant association between TKW and grain weight of G2 (R2= 0.89, P< 0.001), and between TKW and grain weight of G4 (R2= 0.45, P< 0.01) was found across genotypes and thinning treatment (Fig. 3). These associations highlight the need of counteracting the trade-off between TKW and GN by increasing the IGW of grains set in both proximal and distal positions of the spike. On the other hand, no association was found between grain weight of both G2 and G4 and GN (Fig. 4), supporting the hypothesis that the trade-off between the two main yield components could be broken.
Figure 3. Relationships between TKW and IKW of G2 (a), and G4 (b) of the 8 genotypes contrasting in TKW and GN arrangement evaluated in Valdivia (Chile) during the 2014-2015 growing season. Control treatment (circle symbols) and thinning treatment (square symbols) are shown. Genotypes with high GW and low GN (blue) and genotypes with low GW and high GN (red).
Figure 4. Relationships of IKW of G2 between GN (a) and G4 (b) and GN of the 8 genotypes contrasting in TKW and GN arrangement evaluated in Valdivia (Chile) during the 2014-2015 growing season. Control treatment (circle symbols) and thinning treatment (square symbols) are shown. Genotypes with high GW and low GN (blue) and
genotypes with low GW and high GN (red).
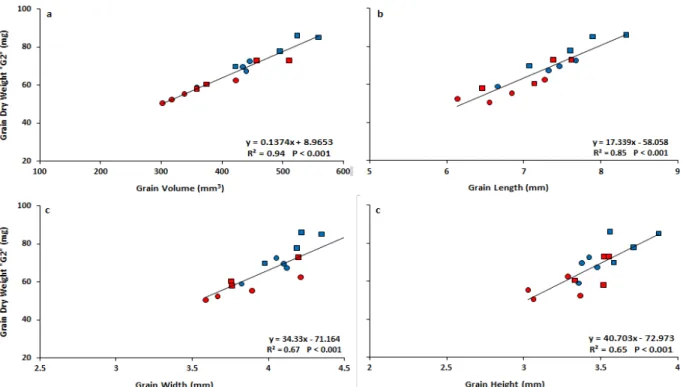
Volume and dimensions (length, width and height) of grain were evaluated in grains G2 and G4 at harvest (Fig. 5 and 6). As expected, the IGW of G2 and G4 had a positive and highly significant relationship with the volume at harvest (Fig. 5a and 6a). Among grain dimensions, the length, width and height of grains were positively associated with the IGW of G2 (Fig. 5b, 5c and 5d) and G4 (Fig. 6b, 6c and 6d). Additionally, IGW of G4 showed good association with both grain length and width (Fig. 6). However, grain length of G2 and G4 seems to be the most promising trait taking into account this trait reached the final value earlier than width and height in the grain filling period (Fig. 7).
27
Figure 5. Relationship of IKW of G2 between grain volume (a), as well as the relationships between grain
dimensions [grain length (b), grain width (c) and grain height (d)] of the 8 genotypes contrasting in TKW and GN arrangement evaluated in Valdivia (Chile) during the 2014-2015 growing season. Control treatment (circle symbols) and thinning treatment (square symbols) are shown. Genotypes with high GW and low GN (blue), genotypes with low GW and high GN (red).
Figure 6. Relationship of IKW of G4 between grain volume (a), as well as the relationships between grain
dimensions [grain length (b), grain width (c) and grain height (d)] of the 8 genotypes contrasting in TKW and GN arrangement evaluated in Valdivia (Chile) during the 2014-2015 growing season. Control treatment (circle symbols) and thinning treatment (square symbols) are shown. Genotypes with high GW and low GN (blue), genotypes with low GW and high GN (red).
Figure 7. Relationship of kernel length of G2 (a) and G4 (b) after anthesis in 2 genotypes contrasting in TKW and GN arrangement evaluated in Valdivia (Chile) during the 2014-2015 growing season. Genotype with high GW and low GN (blue) and genotype with low GW and high GN (red).
Conclusions
This study confirms the trade-off between the main yield components reported previously (Bustos et al., 2013; García et al., 2013), including the CIMCOG genotypes (Quintero et al., 2014). However, this trade-off has been lower in Valdivia. The relationship between TKW and IKW of G2 has been confirmed here as well as the predictive value of kernel length about potential kernel weight, showing that this trait and its physiological and molecular drivers are a key for improving TKW. In addition, kernel wide should also be considered, especially in distal kernel positions. Therefore, expansin and GW2 genes controlling are proposed as promising genetic bases of kernel weight of wheat.
References
Bustos D.V., Hasan A.K., Reynolds M.P., Calderini D.F. (2013). Combining high grain number and weight through a DH-population to improve grain yield potential of wheat in high-yielding environments. Field Crops Research. 145:106-115. Calderini, D.F., R. Savin, L.G. Abeledo, M. Reynolds and G.A. Slafer. (2001). The importance of the period immediately
preceding anthesis for grain weight determination in wheat. Euphytica. 119: 199-204.
García G.A., Hasan A.K., Puhl L.E., Reynolds M.P., Calderini D.F., Miralles D.J. (2013) Grain yield potential strategies in an elite wheat double-haploid population grown in contrasting environments. Crop Science. 53:2577–2587.
Hasan A.K., Herrera J., Lizana C.X., Calderini D.F. (2011) Carpel weight, grain length and stabilized grain water content are physiological drivers of grain weight determination of wheat. Field Crops Research. 123:241-247.
Lizana C.X., Riegel R., Gomez L.D., Herrera J., Isla A., McQueen-Mason S.J., Calderini D.F. (2010) Expansins expression is associated with grain size dynamics in wheat (Triticum aestivum L.). Journal Experimental Botany. 61:1147-1157. McQueen-Mason S.J., Durachko D.M., Cosgrove D.J. (1992) Two endogenous proteins that induce cell wall extension in plants.
The Plant Cell. 4:1425–1433.
Quintero A., Molero, G., Reynolds, M.P., Le Gouis J. Calderini D.F. (2014). SP 2.4: Improving grain filling and potential grain size. In: Matthew Reynolds and Hans Braun. Proceedings of the 4rd International Workshop of the Wheat Yield
Consortium. CENEB, CIMMYT, Cd. Obregón, Sonora, México. March 2014.
Sadras V.O. (2007) Evolutionary aspects of the trade-off between seed size and number in crops. Field Crops Research. 100:125–138.
Sadras V.O., Lawson C., Hooper P., McDonald G.K. (2012) Contribution of summer rainfall and nitrogen to the yield and water use efficiency of wheat in Mediterranean-type environments of South Australia. European Journal of Agronomy. 36:41– 54.
Shearman V.J., Sylvester-Bradley R., Scott R.K., Foulkes M.J. (2005) Physiological processes associated with wheat yield progress in the UK. Crop Science. 45:175-185.
Wiersma J.J., Busch R.H., Fulcher G.G., Hareland G.A. (2001) Recurrent Selection for Kernel Weight in Spring Wheat. Crop Science. 41:999-1005.