• Aucun résultat trouvé

Figure S3: A gene expression analysis of twenty

N/A
N/A
Protected

Academic year: 2021

Partager "Figure S3: A gene expression analysis of twenty"

Copied!
1
0
0

Texte intégral

(1)

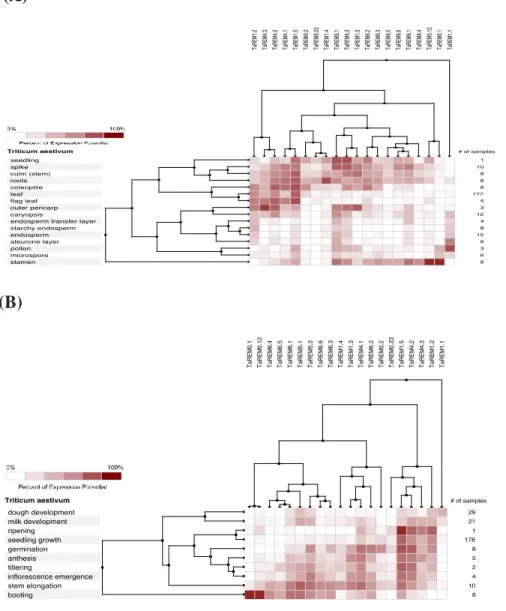
Figure S3: A gene expression analysis of twenty TaREM genes from published RNA-Seq data from different anatomical parts and developmental stages. Relative gene expression is presented as a colored heat-map where burgundy-white color-coding in a log scale represents the minimum level and burgundy color represents the maximum level of expression. (A) Expression of TaREM genes across different wheat tissues. (B) Expression of TaREM genes across different wheat developmental stages. Pearson’s based hierarchical clustering algorithm is used to group genes and different tissues or developmental stages based on the pattern of gene expression. The color reflected the log ratio with burgundy indicating up-regulation and white down-regulation.

(A)
Figure

Figure S3: A gene expression analysis of twenty TaREM genes from published RNA- RNA-Seq  data  from  different  anatomical  parts  and  developmental  stages

Références

Documents relatifs

 Trouve un nom générique pour regrouper les noms particuliers de chaque liste... la gourmandise - la colère - le mensonge -

Lecture : en 2003, 69 % des demandes de licenciement de salariés protégés sont justifiées par un motif économique ; 34 % des salariés licenciés s'inscrivant à l'Anpe déclarent

Trait en gras signifie par voie de concours Trait fin signifie par simple admission en classe supérieure Signifie que la classe marque la fin d’un cycle un diplôme est délivré

Based on the BLAST results of the whole genomic sequence of the pig CA3 gene in Yorkshire, Landrace and Meishan breeds, microsatellite SJ160 was identified in intron 5,

For each prototype gene, we detected increasing number of genes (7, 15, 23,..., 78) with similar expression maps based on the use of different spatial maps and we calculated the

Collectively, our data allowed the identification of a set of reference genes suitable for the analysis of gene expression in the liver, brain and pectoral muscle of Japanese

Finally, for the mixed annotation u C , ICAL most frequently selects three clusters (79 times) or four clusters (21 times). Because the annotation u C is mixed, there is less

Retinoic acid-treated (adipogenic conditions) or not (skeletal myogenic conditions) EBs from wild type CGR8 ES cells were induced to differentiate and treated or not by 100 mM