HAL Id: hal-01694473
https://hal.archives-ouvertes.fr/hal-01694473
Submitted on 14 Apr 2018HAL is a multi-disciplinary open access archive for the deposit and dissemination of sci-entific research documents, whether they are pub-lished or not. The documents may come from teaching and research institutions in France or abroad, or from public or private research centers.
L’archive ouverte pluridisciplinaire HAL, est destinée au dépôt et à la diffusion de documents scientifiques de niveau recherche, publiés ou non, émanant des établissements d’enseignement et de recherche français ou étrangers, des laboratoires publics ou privés.
Synthesis, characterization and luminescent properties
of Sr1-xPbxWO4 solid solution (x=0, 0.5 and 1)
A. Hallaoui, A. Taoufyq, B. Bakiz, F. Guinneton, J-C Valmalette, Sylvie
Villain, Madjid Arab, A. Benlhachemi, L. Bazzi, Jean-Raymond Gavarri
To cite this version:
A. Hallaoui, A. Taoufyq, B. Bakiz, F. Guinneton, J-C Valmalette, et al.. Synthesis, characterization and luminescent properties of Sr1-xPbxWO4 solid solution (x=0, 0.5 and 1). XII MAGHREB DAYS OF MATERIAL SCIENCES, 2017, Unknown, Unknown Region. �10.1088/1757-899X/186/1/012024�. �hal-01694473�
IOP Conference Series: Materials Science and Engineering
PAPER • OPEN ACCESS
Synthesis, characterization and luminescent
properties ofSr
1-x
Pb
x
WO
4
solid solution (x=0, 0.5
and 1)
To cite this article: A Hallaoui et al 2017 IOP Conf. Ser.: Mater. Sci. Eng. 186 012024
View the article online for updates and enhancements.
Related content
Synthesis characterization and hydrogenation behaviour of as quenched Ti41.5+XZr41.5-XNi17 (x=0, 3.5, 11.5 and 13.5) nano quasicrystalline ribbonsRohit R Shahi, T.P. Yadav, M.A. Shaz et al.
-Luminescent properties of alumina ceramics doped with chromium oxide
V Kortov, A Kiryakov and V Pustovarov
-LUNAR LUMINESCENCE
Robert L. Wildey
Synthesis, characterization and luminescent properties ofSr
1-x
Pb
xWO
4solid solution (x=0, 0.5 and 1)
A Hallaoui1,2, A Taoufyq1,2, B Bakiz2, F Guinneton1, J-C Valmalette1, S Villain1, M Arab1, A Benlhachemi2, L Bazzi2 and J-RGavarri1
1 IM2NP, UMR CNRS 7334, University of Toulon, BP 20132, 83957 La Garde-
France
2 LME, Faculty of Sciences, Ibn ZohrUniversity, 80000 Agadir, Morocco
Email: abdelalihallaoui@gmail.com
Abstract. In this work, a study of the role of chemical substitution in the properties of the solid
solution Sr1-xPbxWO4 (x = 0, 0.5 and 1) is presented. Polycrystalline samples were synthesized
by solid state reaction at 1100°C. Using Rietveld method, the structural parameters of all samples were refined. All structures are of scheelite type Scanning electron microscopy showed that a high level of crystallization characterized the samples, with modifications in sizes and shapes depending on composition x. The Infrared and Raman spectroscopies were performed to characterize the evolution of vibrational modes with composition x. Finally, a systematic study of luminescence under X-ray and UV excitations was performed. The energies and intensities of luminescence depended on composition x and on the nature of excitations.
1. Introduction
The first paragraph after a heading is not indented The scheelite tungstate crystals AWO4 are
characterized by tetragonal structures [1,2] (space group I41/a), with tetrahedral oxyanions WO42- and
M2+cations forming MO
8groups [3]. They were extensively investigated for their potential applications
as laser host materials [4,5], scintillators [6,7], oxide ion conductors [8], materials for microwave applications [9] and magnetic materials [10]. The luminescent properties under different excitations of single-crystals as well as polycrystalline SrWO4 and PbWO4 compounds have been widely studied by
several authors [11–15]. Generally, luminescence spectra of scheelite tungstate were decomposed into two main blue and green bands, and to a weaker orange–red emission: the emissions were observed with energies close to 3.0–2.8, 2.7–2.4 and 2.3–2.0 eV [16–20].
In this work we study the luminescent properties of lead and strontium tungstates Sr1-xPbxWO4 for
the three compositions x= 0 ; 0.5 and 1 under X-ray and UV excitations. We already published the synthesis, characterization and luminescence under X-ray excitation of Sr1-xPbxWO4 and Ca1-xCdxWO4
solid solutions [21-23]. Presently, we compare the luminescence responses under X-ray and UV excitations of these substituted samples.
2. Experimental
2.1. Synthesis
1
XII Maghreb Days of Material Sciences IOP Publishing IOP Conf. Series: Materials Science and Engineering 186 (2017) 012024 doi:10.1088/1757-899X/186/1/012024
International Conference on Recent Trends in Physics 2016 (ICRTP2016) IOP Publishing
Journal of Physics: Conference Series 755 (2016) 011001 doi:10.1088/1742-6596/755/1/011001
Content from this work may be used under the terms of theCreative Commons Attribution 3.0 licence. Any further distribution of this work must maintain attribution to the author(s) and the title of the work, journal citation and DOI.
All samples of Sr1-xPbxWO4 with x= 0, 0.5 and 1, were prepared by conventional solid state chemical
reaction using WO3 [Alfa Aesar N° 11828, >99.8%], SrCO3 [Sigma-Aldrich N° 1633-05-2, >99.0%]
and PbO [Sigma-Aldrich N° 1317-36-8, > 99.0%]. The elaboration conditions (grinding process, temperature and time of thermal treatment) were optimized and the final process was as follows: the reagents in stoichiometric proportions were thoroughly mixed and ground in an agate mortar for 15 min, then thermally treated at 600°C for 3 h, in pure alumina crucible under air. The samples were ground again thoroughly for 2 h, and then, retreated at 1100 °C for 4 h, under air.
2.2. Characterization techniques
2.2.1. X-ray diffraction: Each sample was analysed by X-ray diffraction using an Empyrean Panalytical diffractometer, equipped with a copper X-ray source (wavelength λ=1.54.10-10 m, tension
V= 45 kV, intensity I= 35 mA), and with a Ni filter eliminating the Kβ radiation. The structural
parameters of the samples were refined using the Fullprof software [24] based on Rietveld procedure. 2.2.2. Scanning electron microscopy: A systematic analysis of grain sizes and morphologies was performed using a Supra 40 VpColonne Gemini Zeiss scanning electron microscope (SEM), with a
maximum voltage of 20 kV.
2.2.3. Raman spectroscopy analysis: Raman spectroscopy was used to characterize the evolution of the various phases, and to correlate vibration modes with these structural evolutions. The equipment used to perform the various vibration spectra was a spectrometer Horiba Jobin-Yvon HR800 LabRam, spatially resolved to 0.5 μm, by means of an optical microscope with a 100 objective. The latter has a dual function: it allows firstly focusing the laser beam on a small area, and, secondly, visualizing the area of the sample. The 514.5 nm line of an Ar-ion laser was used as the excitation source; the photonic power applied to the samples was limited to 5 μW with an acquisition time of 30 s. Each Raman band was characterized by its wavenumber (in cm-1).
2.2.4. Luminescence experiments: For the luminescence under X-ray excitation, the copper X-ray source of the diffractometer Empyrean-Panalytical was used to irradiate the samples and perform luminescence experiments. The nominal emission conditions (voltage VRX / current IRX) were 45 kV /35 mA. The luminescence emissions of samples were recorded using a UV–visible spectrophotometer MicroHR (JobinYvon) equipped with an optical fiber of 400 μm in diameter.
The equipment used to perform the measurements of luminescence under UV was the previously described spectrometer Horiba Jobin-Yvon HR800 LabRam. The entrance slit, positioned behind the filter, is a diaphragm whose diameter can range from 50 to 500 μm. The 364.5 nm line of an Ar-ion laser was used as the excitation source. The power applied to the samples was fixed to 0.005 mW with an acquisition time set to 100 ms.
3. Results and discussion
3.1. X-ray diffraction
Fig. 1 shows the XRD pattern of Sr1-xPbxWO4 powders. All diffraction peaks are characteristic of the
scheelite tetragonal structure with space group I41/a. The diffraction peaks are shifted to smaller 2θ
angles as x increases.
2
XII Maghreb Days of Material Sciences IOP Publishing IOP Conf. Series: Materials Science and Engineering 186 (2017) 012024 doi:10.1088/1757-899X/186/1/012024
20 40 60 80 100 120 PbWO4 Sr0.5Pb0.5WO4 In te ns ity (a rb . u ni t) 2 (°) (5 12 ) (3 1 1 0) (4 24 ) (1 36 ) (2 24 ) (3 12 ) (3 01 ) (2 20 ) (2 04 ) (2 11 ) (0 04 ) (200) SrWO4 (1 01 )
Figure 1.XRD patterns of the tetragonal Sr 1-xPbxWO4 powders with x = 0, 0.5, 1.
Figure 2.Calculated and observed diffraction profiles from Rietveld analyses for the Sr0.5Pb0.5WO4 phase. Ycalc: calculated profile
and Yobs : observed profile.
Table 1 reports the refined structural parameters. Fig. 2 shows selected results comparing calculated diffraction profiles to experimental data.
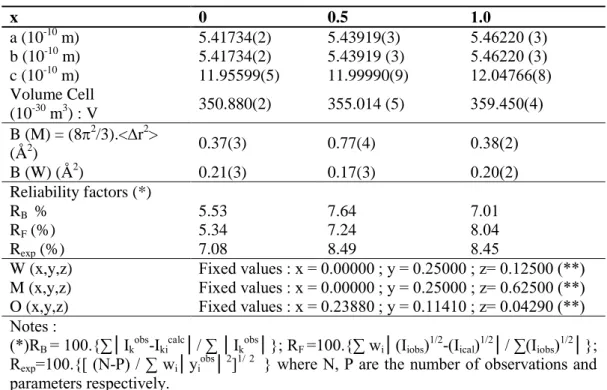
Table 1. Refined structural parameters for Sr1-xPbxWO4 compounds with x = 0, 0.5; 1. Cell
parameters, Debye-Waller factors B, reliability factors R in %.
x 0 0.5 1.0 a (10-10 m) b (10-10 m) c (10-10 m) 5.41734(2) 5.41734(2) 11.95599(5) 5.43919(3) 5.43919 (3) 11.99990(9) 5.46220 (3) 5.46220 (3) 12.04766(8) Volume Cell (10-30 m3) : V 350.880(2) 355.014 (5) 359.450(4) B (M) = (82/3).<r2> (Å2) 0.37(3) 0.77(4) 0.38(2) B (W) (Å2) 0.21(3) 0.17(3) 0.20(2) Reliability factors (*) RB % RF (%) Rexp (%) 5.53 5.34 7.08 7.64 7.24 8.49 7.01 8.04 8.45
W (x,y,z) Fixed values : x = 0.00000 ; y = 0.25000 ; z= 0.12500 (**) M (x,y,z) Fixed values : x = 0.00000 ; y = 0.25000 ; z= 0.62500 (**) O (x,y,z) Fixed values : x = 0.23880 ; y = 0.11410 ; z= 0.04290 (**) Notes :
(*)RB = 100.{∑│Ikobs-Ikicalc│/ ∑ │Ikobs│}; RF =100.{∑ wi│(Iiobs)1/2-(Iical)1/2│/ ∑(Iiobs)1/2│};
Rexp=100.{[ (N-P) / ∑ wi│yiobs│2]1/ 2 } where N, P are the number of observations and
parameters respectively.
(**) Sr, W and O coordinates from author [25] have been fixed. 3.2. Raman spectra
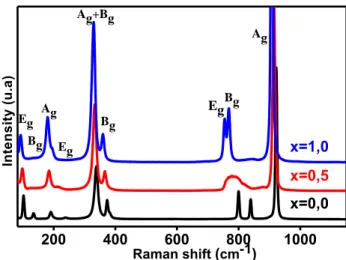
Fig. 3 shows the Raman spectra of the three compositions at room temperature. The vibration modes of SrWO4 and PbWO4 were already interpreted by authors Priya et al. and Ling et al. [26, 27] and
3
XII Maghreb Days of Material Sciences IOP Publishing IOP Conf. Series: Materials Science and Engineering 186 (2017) 012024 doi:10.1088/1757-899X/186/1/012024
Crane et al. [28]. The decrease with composition x of Raman wavenumbers clearly suggests a continuous modification of chemical bonds W–O due to W–O–Pb interactions: as Pb–O bonds present a more covalent character, the W–O bonds probably present a weaker covalent character, with decreasing rigidity, due to electron displacement in favor of the Pb–O bond. In addition, a mass effect, due to a mass of Pb stronger than the mass of Sr, should play a role in the decrease of wavenumbers.
200 400 600 800 1000 x=0,0 x=0,5 x=1,0 In te n s it y ( u .a ) Raman shift (cm-1) Eg Bg Ag Eg Ag+Bg Bg Eg Bg Ag
Figure 3. Room temperature Raman spectra of Sr1-xPbxWO4, for x = 0, 0.5, 1. (λ (excit.) = 514.5 nm).
3.3. Scanning electron microscopy
The SEM analyses of the x= 0.1, 0.5, 1 samples (Figures 4a, 4b and 4c, successively) show a progressive increase of crystallite sizes as x increases. In Figure 4a, we have inserted a magnified image to better illustrate the morphologies. In the case of the x=0.5 sample (Fig. 4b), a majority of large and regular crystallites is observed. For PbWO4 (Fig. 4c) a mix system of crystallites with large
and small grains is observed.
Figure 4. Scanning electron microscopy micrographs of the Sr1-xPbxWO4 samples (a) x=0 In inset :
magnification of image (a) (x5), (b) x=0.5, and (c) x= 1. 3.4. Luminescence under X-ray excitation
Figure 5 compares the intensities emitted by the three different materials (x=0, 0.5, 1). We observe a clear difference between the intensity of the substituted compound (x=0.5) and those of x= 0 and 1 samples, with a very strong intensity for the x=0.5 sample. The average energy of the emission band is close to 2.8 eV (blue region).
3.5. Luminescence under UV excitation
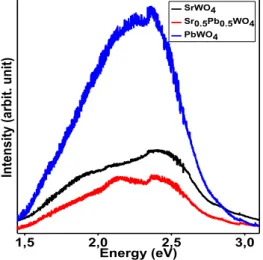
Figure 6 shows the intensities of luminescence under UV excitation. In this case, no stronger intensity is observed for the substituted sample. This difference between the two emissions under UV and X-ray excitations can be ascribed to the low penetration of UV beam and to the high penetration of X-ray beam in samples. In the case of low energy UV excitation (3.6 eV), the observed luminescence is
4
XII Maghreb Days of Material Sciences IOP Publishing IOP Conf. Series: Materials Science and Engineering 186 (2017) 012024 doi:10.1088/1757-899X/186/1/012024
mainly due to the external areas of crystallites and irregular surfaces of powdered samples, which is not the case for high energy X-ray excitations (from 0 to 45000 eV) that concern larger volumes of material. The average energy of the emission band is close to 2.25 eV (green region).
2,0 2,5 3,0 3,5 4,0 In te ns ity (a rb . u ni t) Energy (eV) SrWO4 Sr0.5Pb0.5WO4 PbWO4 1,5 2,0 2,5 3,0 SrWO4 Sr0.5Pb0.5WO4 PbWO4 In te ns ity (a rb it. u ni t) Energy (eV)
Figure 5. Photoluminescence spectra of SrWO4, Sr0.5Pb0.5WO4 and PbWO4 under
X-ray excitation (excitation energies in the continuous range 0 to 45000 eV).
Figure 6. Photoluminescence spectra of SrWO4, Sr0.5Pb0.5WO4 and PbWO4 under
UV excitation (=364.5 nm or E=3.6 eV. 4. Conclusion
In this work, we have observed a complex influence of the chemical substitution on the luminescence signals under X-Ray excitation and UV excitation, in the series Sr1-xPbxWO4. Generally the origin of
the emission in tungstate materials is related to the classical 3T A
1 transitions in the oxyanions
WO42-, and cations or anions vacancies in the material. The emission energies under X-ray and UV
excitations are in the blue and green regions respectively. The luminescence experiments under X-ray excitation show that the emission of Sr0.5Pb0.5WO4 presents intensity stronger than the intensity
observed in SrWO4 and PbWO4. This behavior is fully different from the one observed in experiments
under UV excitation: the emission intensity observed in the case of x=0.5 sample is lowered in comparison with the one of SrWO4 and PbWO4.
In these studies, we have shown that the effects of chemical substitution are complex, and that substitution can be used to obtain variable luminescence properties. The extension of these studies of substituted luminescent materials is now in progress: a major objective should be to better understand the different roles of substitution and of crystallization in luminescence efficiency.
Acknowledgments
This work was financially supported by the Regional Council of Provence-Alpes-Côte d’Azur (no. 2012-16322), by the General Council of Var and by Toulon Provence Mediterranean, and was conducted as part of the CNRS-CNRST 2014 project (Chimie 02/14).
References
[1] Liao W, Wang Y-F, Liu Y-M., Li Y-D, Qian Y-T 2000 Chem. Mater. 122819.
[2] Zhang Q, Yao W-T, Chen X, Zhu L, Fu Y, Zhang G, Sheng L, Yu S- H 2007Cryst. Growth Des. 71423.
[3] Gurman E, DanielsE, KingJ-S 1971 J. Chem. Phys. 55 1093. [4] TreadawayM-J, Powel R-C 1975 Phys. Rev. B 11862.
[5] Chen W, Inagawa Y, Omatsu T, Tateda M, Takeuchi N, Usuki Y2001Opt. Commun. 194 401. [6] Lecoq P, Dafinei I, AuffrayENucl. 1995Instrum. Methods 365291.
5
XII Maghreb Days of Material Sciences IOP Publishing IOP Conf. Series: Materials Science and Engineering 186 (2017) 012024 doi:10.1088/1757-899X/186/1/012024
[7] TakaiS, SugiuraK, EsakaT1999Mater. Res. Bull.34193.
[8] NagirnyiV, FeldbachE, OnssonL-J, KirmM, LushchikA, LushchikC, NagornayaL-L, RyzhikovV-D, SavikhiuF, SvenssonG, TupitsinaI-A1998Radiat. Meas. 29 247.
[9] Van-UitertL-G, Preziosi S1962 J. Appl. Phys. 33 2908.
[10] EhrenbergH, WeitzelH, HeidC, FuessH, WltschekG, Kroener T, Van-TolJ, BonnetM1997J. Phys.: Condens. Matter 9 3189.
[11] Van LooW1975Phys. Stat. Sol. A 27 565. [12] Van LooW 1975Phys. Stat. Sol. A 28 227.
[13] BohacekP, ZazubovichS, SolovievaN, NiklM2007 Opt. Mat. 30 66. [14] ChukovaO, NedilkoS2013 Opt. Mat. 35 1735.
[15] PôrtoS-L, LongoE, PizaniP-S , BoschiT-M, SimoesL-G-P, LimaS-J-G, FerreiraJ-M,SoledadeL-E-B, EspinozaJ-W-M, Cassia-SantosM-R, MaureraM-A-M-A, PaskocimasC-A, SantosI-M-G, SouzaA-G2008 J. Solid State Chem. 181 1876.
[16] BurachasS, BeloglovskyS, MakovI, SavelievYu, VassilievaN, IppolitovM, MankoV, NikulinS, VassilievA, ApanasenkoA, TamulaitisG2002Funct. Mater. 9 297.
[17] Kim T, Hole D-E, Townsend P-D, WooJ, WhangC 2005 Phys. Stat. Sol. c2 564. [18] LagutaV-.V, NiklM, ZazubovichS IEEE Trans. Nucl. Sci.200855 1275.
[19] BurachasS, ApanasenkoA, GrinyovB, RyzhikovV, KatrunovK, StarzhinskiyM, IppolitovM, MankoV, TamulaitisG2001Int. J. Inorg. Mater. 3 1101.
[20] NovosadS-S, KostykL-V, NovosadS-I 2011 J. Appl. Spectrosc. 78557.
[21] Hallaoui A, Taoufyq A, Arab M, Bakiz B, Benlhachemi A, Bazzi L, Villain S, ValmaletteJ-C, GuinnetonF, GavarriJ-R2015J. of Sol. St. Chem. 227 186.
[22] Taoufyq A, Guinneton F, Valmalette J-C, Arab M, Benlhachemi A, Bakiz B, Villain S, LyoussiA, NolibeG, GavarriJ-R 2014 J. of Sol. St. Chem. 219127.
[23] Taoufyq A, MauroyV, GuinnetonF, BakizB, VillainS, HallaouiA, BenlhachemiA, NolibeG, LyoussiA, GavarriJ-R 2015 Mater. Res. Bull.70 40.
[24] RoisnelT, Rodríguez-CarvajalJ, DelhezR, MittenmeijerE-J 2000(Eds.)Proceedings of the Seventh European Powder Diffraction Conference, Barcelona 118.
[25] PecharskyV-K, ZavalijP-Y 2005 Springer Science & Business Media 512. [26] PriyaA, SinhaE, RoutS-K 2013 Solid State Sc. 20 40.
[27] LingZ-C, XiaH-R, RanD-G, LiuF-Q, SunS-Q, FanJ-D, ZhangH-J, WangJ-Y, YuL-L 2006 Chem. Phys. Lett. 426 85.
[28] CraneM, FrostR-L, WilliamsP- A, KloproggeJ-T 2002 J. Raman Spectrosc. 33 62.
6
XII Maghreb Days of Material Sciences IOP Publishing IOP Conf. Series: Materials Science and Engineering 186 (2017) 012024 doi:10.1088/1757-899X/186/1/012024
![Rational Synthesis and Characterization of the Mixed-Metal Organometallic Polyoxometalates [Cp*Mo x W 6– x O 18 ] − ( x = 0, 1, 5, 6)](data:image/gif;base64,R0lGODlhAQABAIAAAP///wAAACH5BAEAAAAALAAAAAABAAEAAAICRAEAOw==)