HAL Id: hal-01401972
https://hal.archives-ouvertes.fr/hal-01401972
Submitted on 24 Nov 2016
HAL is a multi-disciplinary open access
archive for the deposit and dissemination of
sci-entific research documents, whether they are
pub-lished or not. The documents may come from
teaching and research institutions in France or
abroad, or from public or private research centers.
L’archive ouverte pluridisciplinaire HAL, est
destinée au dépôt et à la diffusion de documents
scientifiques de niveau recherche, publiés ou non,
émanant des établissements d’enseignement et de
recherche français ou étrangers, des laboratoires
publics ou privés.
Eco-Maintenance for Complex Systems: Application on
System of Renewable energy production
Nicolas Tchertchian, Dominique Millet
To cite this version:
Nicolas Tchertchian, Dominique Millet. Eco-Maintenance for Complex Systems: Application on
Sys-tem of Renewable energy production. Internatinal Symposium on Environment-Friendly Energies and
Applications, Nov 2014, Paris, France. �hal-01401972�
Eco-Maintenance for Complex Systems:
Application on System of Renewable energy production
Nicolas Tchertchian and Dominique Millet,
Ecodesign and Optimisation of Product
SUPMECA, LISMMA Toulon, France
[email protected] [email protected]
Abstract
The marine energy sector is experiencing a growing interest; large offshore wind farms continue to emerge, particularly in northern Europe. The electrical energy produced by these turbines is intended as clean and renewable. Operations and Maintenance (O&M) of offshore wind farms is however costly and generating environmental impacts. Indeed in view of the circumstances on the high seas the accessibility to Wind Turbine (WT) is greatly complicated causing long periods of unavailability compared to onshore wind farm. To remedy this, operators will mobilize significant and specific resources (Fast Crew Boat, large boat, helicopters).
The use of these vehicles and systems of maintenance can improve the availability of WTs but also degrade the environmental performance of offshore wind farm. The optimization of O&M requires rethinking the concept of maintenance of renewable energy systems in mobilizing the concept of Eco-Maintenance. Eco-Maintenance aims to minimize the environmental losses due to maintenance while maximizing the environmental benefits generated assuming the energy recovered due to better maintenance / availability equivalent to an environmental gain corresponding to the environmental impacts of a thermal power plant should have been put into operation to produce this energy.
This approach is tested on an offshore wind farm. In this context, modeling the complex system (Offshore Wind Farm + Maintenance Systems) was developed. The various models show that the environmental performance of Systems of Energy Production and System of Maintenance (SM) are interconnected.
Keywords: Eco-Maintenance; Ecodesign; Wind energy; Wind turbines.
I. INTRODUCTION
The development of offshore wind energy has become a strategic issue of energy independence. The northern European countries (UK, Belgium, the Netherlands and the Scandinavian countries) play a major role and are motivated by the need to find new sources of electrical energy by avoiding the use of fossils fuel. Knowing that the wind is available over large areas along the coasts and the impact of offshore wind farms on populations is lower than onshore.
However, there are problems to be solved for offshore wind energy grows on a larger scale and this requires the
need to make this energy more competitive. Offshore work is Between 5 to 10 times more expensive than work on land [1]. Indeed the combination of several factors: distance from the shore, the extreme weather conditions in high sea and the construction of more powerful wind turbine (WT), with higher production capacity needed to develop logistic means adapted to build, operate and maintain the turbines. The implementation of these means causes Operations and Maintenance (O&M) cost increasingly high.
The choice of the composition of the vehicles of maintenance fleet, and investment in platforms at sea will have a great impact on O&M costs of an offshore wind farm [2].
In order to develop the wind industry in the future, optimization of maintenance of wind farms is essential to increase the availability and longevity of turbine and ultimately reduce the cost of the life cycle of offshore wind farm.
The unavailability of a WT is the result of two contributors [3]:
• The largest contributor to the unavailability of a WT is the downtime of the turbine during preventive maintenance.
• The second cause of unavailability of a WT is the unforeseen faults of the technical equipment requiring immediate stop of the turbine.
While the failure causes an immediate stop of the turbine until the maintenance crew can fix it; preventive maintenance causes the shutdown of the turbine during part of the maintenance activities. During the period of unavailability of the wind, the energy that is not produced must be elsewhere. This creates economic costs of operating losses; In addition the non-production of this energy also generates additional environmental impacts associated with the production of non-renewable energy (nuclear power plant, thermal power plant…).
The concept of Eco-Maintenance aims to optimize the lifetime of the system to maintain while minimizing environmental losses (impact) due to maintenance ; it takes here not only the impacts generated by the use of ships and machinery used in maintenance but also the impacts caused by their manufacture and end of life, in proportion to the use that can be assigned to this maintenance and maximizing the
environmental gains from maintenance operations across the life cycle (these gains can be evaluated by considering that the energy recovered due to better availability of turbines is equivalent to an environmental gain corresponding to the opposite in the mathematical sense of the term -environmental impacts generated by a thermal power plant should have been put into operation to generate the same power).
Our goal is to define, for the System of Maintenance (SM), the optimum to achieve to ensure that the gains generated by a better maintenance are higher than the impacts generated by the sophistication of the system. To illustrate this problem, do we need a "light" SM (low environmentally impacting) but generating downtime or a more sophisticated and "heavy" system but reducing downtime?
As a first step we provide a brief overview of the work to optimize operational resources for the maintenance of wind farms. In the following, based on data extracted from the library we model an offshore wind farm. In the third part of this article we simulate various scenarios and for each assess the environmental impact generated by the maintenance of system through EI 99 (end-point) environmental assessment method. In the last part of this article we give an interpretation of these results of different simulations and determine the parameters influencing the overall system performance of renewable energy production.
II. STATE OF THE ART A. Background
The maintenance optimization is the process that seeks to balance the constraints of maintenance (legislative, economic, technical, and environmental) and the resources used to run the maintenance program (human resources, spare parts, equipment, arrangements, etc.) [4]. Basically, the main objective of the maintenance optimization is to determine the strategy with the least costly economically with the least danger to operators and, to a lesser one whose environmental impacts are lower strategy. This strategy should provide the best balance between direct cost service (labor, materials, administration ...) and the impact on the system if maintenance is not performed as expected (loss of production and profits) while avoiding the consequences on health, safety and environment by mobilizing the concept of "Green" Maintenance [5].
To optimize the maintenance of wind farm two types of action are possible; first by acting on internal factors (organizational improvement of the maintenance process: fault detection as early as possible [6], automatic detection of deviations performance of WTs [7], planning maintenance [8] ...); then acting on the external factors in improving the performance of maintenance systems (optimization of logistics scenarios [9], fleet composition, type of vessel or helicopter [2]).
In practice, two strategies are confronting:
• Identify the risks of failure to intervene earlier
• Or repair as soon as possible in difficult weather conditions to avoid extended downtime of turbines. In this paper we deal with the second option.
The achievement of maintenance activities such as inspection, preventive maintenance, and replacement of wear components increases the direct costs of maintenance. In return, the risk of incidents or consequences of failure to complete the required maintenance decreased [10].
B. Optimization of operational resources for the maintenance of wind farms.
In the remainder of this article we assess the impact of external factors on the environmental performance of maintenance of wind farms.
The performance and therefore the choice of a logistics concept are influenced amongst others by the following factors [11]: the distance to shore; the weather conditions; the failure behavior of WTs in the farm; the number of supplied WTs/farms and; the number/types of supply vessels.
The distance to shore will lead to two types of maintenance strategies [6]; the first based on maintenance made from shore: technicians return to port after each intervention; the second strategy for wind farm away from the coast, technicians are permanently close to the farm. Münsterberg [11] characterizes transfer system according to weather conditions and the distance to shore. In the case of the first strategy the technicians are brought to the farm by small Crew Transfer Vessels (CTV). Unfortunately the range of use of a "CTV" is limited by sea conditions and the significant wave height to be able to intervene (The significant wave height limitations of CTV are usually assumed with 1.5 m). Beyond operators of wind farm have to mobilize helicopters. The preventive maintenance is usually scheduled during the summer season, when the wind speed and wave height is low enough to intervene. When a failure occurs during the winter season, sometimes access to turbines is inaccessible for long periods, resulting in a long periods of downtime and production losses [12]. For example, a transfer system limited by a significant wave height <1.5m, the wait for better conditions of sea is about four days in the summer, 10-15 days in spring and autumn and between 2 and 6 weeks of winter [13].
In this paper we consider only vehicles allowing the transfer of maintenance technicians to the WTs as well as the supply of small parts and tools. Heavy lifting equipment and transportation necessary for large components (e.g. blades) are excluded from the study.
Two systems of maintenance are considered in the following of this study: the current system (Crew Transfer Vessel) allows daylight intervention to a significant wave < 1.5 m and an alternative system capable of transferring technicians through a SWATH hull coupled to a dynamic stabilization system on a 24 hour/7 day basis and up to 3m of significant wave height.
III. OFFSHORE WIND FARM AND MAINTENANCE SCENARIO MODELLING
A. Principles of an Eco-Maintenance simulator
The model is built around an event generator. The principle of this generator is to randomly assign failures on all WTs over their lifetime and deduct the planned maintenance affecting the wind farm. The generator is built around a global optimization method of the maintenance system, formalized by the SADT diagram (Figure 1) and composed by eight activity box:
The reference wind farm is first characterized (A1) through its lifetime, the number and type of WTs erected (Max power output), the location of the Farm (weather condition), availability of WTs is characterized (A2) by the reliability of the components expressed as Mean Time Between Failure (MTBF), and the 4 levels of preventive maintenance, identified by the operator. The wind farm location is assigned by sea conditions (A3) (significant wave height) and wind (average wind).
USED AT: AUTH OR: DATE:
REV: PROJ EC T: Simulator 01/04/2014 30/07/2014 NOTES: 1 2 3 4 5 6 7 8 9 10 WOR KI NG DRAFT RECOMMENDED PUBLIC ATION
READER DATE CON TEXT:
A-0
NOD E: TI TLE:
Eco-Maintenance of offshore Wind farms
NUMBER:A0
Nb of WT
Us age scenario wit h alt ernativ e sy stem
Weather data bas e
Mass balance of alt enativ e s y s tem
WT catalog Loss of power production/ CTV Sea state =< 3 Fin de v ie du WK Loss of power production/ alt ernativ e sy stem
Axes of improv ement Maximum production of wind energy Ty pe of WT Ev ent generator Nb of W T & Lif et ime
Sy stem conf iguration and maintenance sc enario opt imized
Simapro + Env ironmental database Wind Turbines (W T) Sea Stat e =< 5 Locat ion of WT Ty pe of st ruc tures Ty pe of f oundat ions
Prev entiv e maintenance sc hedule modif ied
correctiv e maint enance required (T0 : st art of int erv ention; WT to repair, ty pe of f ailure)
Elect rict y mix based on non-renewable energy Us age sc enario wit h ref erence sy st em End of Lif e of CTV Mass balance of CTV
Env ironmental impac ts & ec onomic cos ts of maint enance with optimised sy st em Env ironmental impac ts & ec onomic cos ts of maintenanc e with alternativ e sy st em Optimis ation method A1
Def ining the sit e of implantation, t he turbines and f oundat ions
of Wind Farm A2 Modeling of turbine av ailability A3 Allocation of weat her condit ions
(W av e height & wind speed) A4 Modeling of maint enance by sy st em of ref erenc e A5 Modeling of maint enance by s y stem optimized A6 Generic modeling of the non-renewable energy sy st em A7 Calc ulat e of env ironmental perf ormanc e of the maintenanc e s y s tem A8 Looking f or improv ements
Figure 1. General framework of optimization method of the maintenance system
The logistics scenarios of maintenance are then modeled: in first time reference scenario (A4), which consists of the use of fast vessels (Crew Transfer Vessels) and limited by significant wave height of 1.5 m, then the alternative scenario (A5) which consists of the use of a heavier ship more sophisticated and able to transfer on-site technicians to significant wave heights of 3m. Generic modeling of non-renewable energy production system (A6) is established for losses of production when WT is unavailable. Finally, the environmental impact of the maintenance system is evaluated (A7) and areas for improvements are identified (A8).
In this model, the event generation can identify resources to implement to perform the corrective and preventive maintenance of the WT and environmental impact generated. By combining meteorological data (wind speed and significant wave height) with the moment of occurrence of a failure enable to estimate the energy lost during the downtime of the turbine and thus the loss of revenue (and
environmental impacts due to the production non-renewable energy).
B. Definition of logistics scenarios of maintenance
A1: Characteristics of wind farm
The lifetime of the offshore wind farm is often estimated at 20 years in the literature, despite the feedback is limited on last generation WT.
There are eighty turbines, each with three blades and capable of generating 6 MW with a lifetime of 20 years.
Three wind farm configurations are considered: • 10km from land to wind farms
• 50km from land to wind farms • 100km from land to wind farms A2: Characterization of Wind Turbines
The rated power of WT is calculated by the power curve as a function of wind (m / s) [14]. Reliability of WT is a strategic data that is not usually provided by the operators. The only values currently available are those provided by the scientific community [1], [15], [16]. In our model, failures are randomly distributed from the failure rate defined by a group of experts [17].
TABLE I. GENERIRIC RELIABILITY OF WIND TURBINES [17]
Component
Annual Failure rate/ WT
Gears 0.045
Control system 0.050
Electric System 0.067
Yaw system 0.026
Blades and pitchsystem 0.052
Generator 0.021
Sensors 0.054
Hydraulics 0.061
Drive Train 0.004
Mechanical Brake 0.005
A3: Weather conditions assignement
Climatic conditions (average wind speed and significant wave height) are defined for a given wind farm location. These data are needed to evaluate the energy production of the wind farm and to plan the schedule of preventive maintenance. Climate data over long periods are generally not available; in our case, however, the wind farm for this study is located in south of the UK, whose data is known about the last 5 years [18]. For a sample of 20 years we will repeat several times the known data.
A4: Operations and Maintenance baseline scenario In baseline O&M scenario, the preventive and corrective maintenance are achieving by fast crew boat (known as Crew Transfer Vessels, CTV). The CTV transports technicians to the wind farm then remain on standby till the maintenance crew needs to return [19]. CTV allows daylight intervention (we assume from 8AM to 8PM throughout the year) to a significant wave < 1.5 m.
A5: Operations and Maintenance alternative scenario In this scenario, CTV is replaced by an alternative vessel, able of responding on a 24 hour/7 day basis and up to 3m of significant wave height. This alternative vessel stays on wind farm for a 3 months mission; at the end of each mission it returns to port to refuel.
A6: Nonrenewable energy mix
During WT downtime, wind farm suffered losses in energy production. These losses must be compensated. In environmental performance assessment, the impacts generated by electricity production from non-renewable energy sources have to be taken into account.
A7: Definition of the environmental impact (economic cost) of the wind energy production system
A wind energy production system is a complex system. The environmental (and economic) assessment of this system consists of assessing the impact of wind energy (life cycle of WT), its maintenance system (reference system or alternative system) and the production of non-renewable energy when the WTs are unavailable.
The Environmental Impact (EI) of the System of Energy Production (SEP) is described in Equations 1-7.
For the sake of clarity, we note first (1), (2) and (3):
EI (System of Energy Production) = EI (SEP).
EI (Wind energy Production) = EI (P_Wind energy).
EI (Nonrenewable energy mix Production) = EI (P_NRE mix).
Environmental Impact of SEP is defined by (4), (5), (6) and (7):
EI (SEP) = EI (P_Wind energy) + EI (P_NRE mix).
With
EI (P_Wind energy) = EI (Raw + Manufacture WT) + EI (Use WT) SM + EI (Maintenance WT) + EI (End of Life
WT).
EI (Maintenance WT) = EI (System of Maintenance) = EI (Raw SM) + IE (Man SMref) + EI (Use SMref) + EI (EoL
SMref).
And
EI (P_NRE mix) = αSM × EI (1kWh P_NRE mix).
Where αSM = non generated energy when WT is
unavailable
A8: Optimisation of system of maintenance
As environmental impact of WTs Manufacturing and End-of-Life stage are the same whatever the SM, the second term in equation (8) has to be minimized.
EI (SMref) + EI (Use WT)SMref + αSMref x EI (1kWh NRE mix)
> EI (SMopt) + EI (Use WT)SMopt + αSMopt x EI (1kWh NRE
mix).
In this article we will not discuss optimization methods to minimize the environmental impact (or economic cost). The aim here is rather to identify the constraints of wind energy
production system and the parameters of SM that will influence the overall performance of complex system.
IV. CASE STUDY :ENVIRONMENTAL ASSESSMENT OF
O&M SCENARIOS
A. Assumptions and definition of O&M scenarios
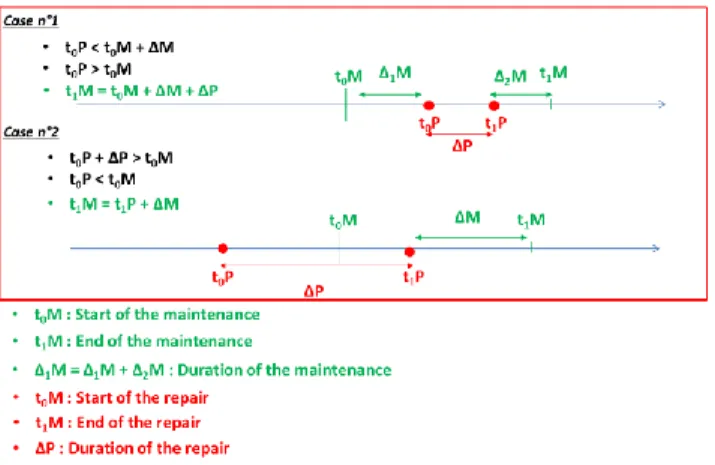
Corrective maintenance is based on the Annual Failure Rate (AFR) due to 10 failures with the highest occurrence (see Table 1). Failures generated by the simulator follow a random distribution according AFR. Each failure event requires a repair time of 6h while maintenance time is estimated at 4 hours per turbine. Preventive maintenance is interrupted in case of failure on another WT (case 1 Figure 2) maintenance resumes when the repair is complete or shifted if the failure occurs prior to maintenance (case 2 Figure 2).
Preventive maintenance is planned. Two scenarios of preventive maintenance are evaluated to test the influence of the season on the performance of SM:
• Summer scenario: Each WT is visited 1 times during the month of July.
• Winter scenario: Each WT is visited 1 times during the month of January.
It is during the winter season that energy production is the most important, while during summer the weather conditions are more favorable to maintenance operations.
Thus Table IV shows the loss of energy production during the lifetime of the wind farm, due to planned maintenance; losses are much smaller when these operations are carried out during the summer season.
Figure 2. Case of interruption or postponement of preventive maintenance.
Systems of Maintenance evaluated carry the same number of technicians, three groups of 4 technicians. The reference system is a fast crew boat (CTV) which drops 12 technicians on-site early in the day (8AM) and returns to port with technicians in the evening (8PM). During the workday the CTV remains on standby till the maintenance crew needs to return.
The alternative system is constantly on the wind farm, a team of 4 technicians working 8 hours then they are replaced by another, ect.
The data used for evaluating the use cycle of the two systems of maintenance are presented in Table II and Table III.
TABLE II. CHARACTERISTICS OF REFERENCE SMUSE CYCLE
Phase duration (min) Speed (knots) Power consumption (kW) Port derparture 10 7 43 Port-Wind farm 68-170-340 19 857 Approach phase/ 1 WT 34 5 16 Wind farm-Port 68-170-340 19 857 Port entrance 10 7 43
TABLE III. CHARCTERISTICS OF ALTERNATIVE SMUSE CYCLE
Phase duration (min) Speed (knots) Power consumption (kW) Port derparture 10 7 798 Port-Wind farm 54-270-540 12 2003 Approach phase/ 1 WT 40 5 609 Waiting time/day 120-180 0 500 Wind farm-Port 54-270-540 12 2 003 Port entrance 10 7 798 B. Results
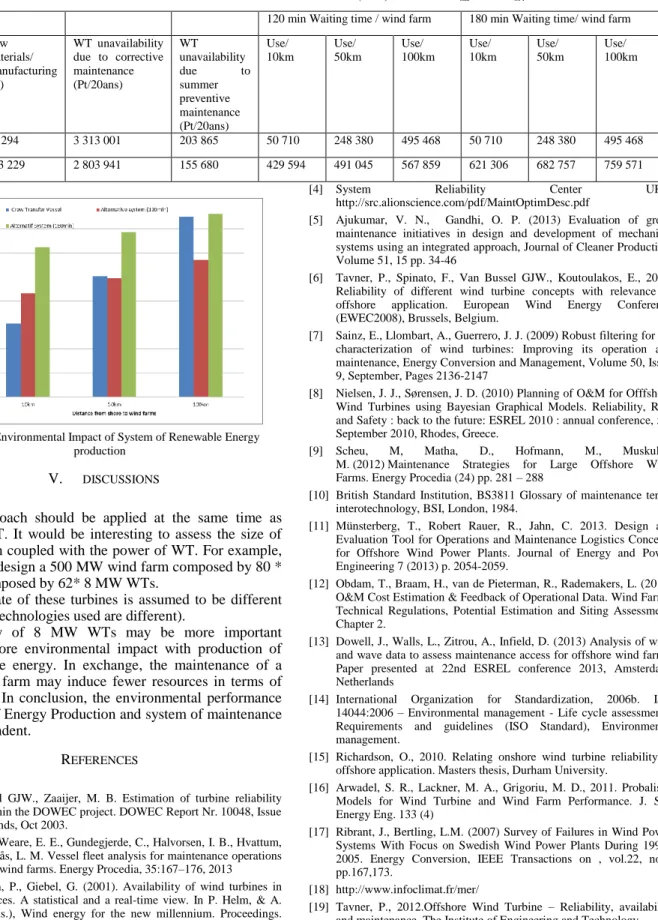
The environmental assessment of the System of Energy Production shows that the alternative SM saves 500kPt (Figure 3), corresponding to the production of 15 GWh (Table IV) of additional renewable energy. In return for the use phase the alternative SM is more fuel consumer compared to reference SM even if the CTV return to port each day and the alternative SM is present on the site constantly.
TABLE IV. NONRENEWABLE ENERGY PRODUCTION (MWH)
ACCORDING DIFFERENT SYSTÈM OF MAINTENANCE
SMref SMopt
Gains beetween SMref and SMopt
(GWh) Nonrenewable energy production (MWh) N o n r en ew ab le en er g y corrective maintenance 86 730 73 400 13,3 Preventive maintenance (Winter) 11 500 7 860 3,6 Preventive maintenance (Summer) 5 340 4 075 1,3 Total Winter 98 230 81 260 17,0 Total Summer 92 070 77 475 14,6
Furthermore, more the wind farm is far from shore more the alternative SM is competitive with CTV. Uncertainty remains about the impact of alternative system when it remains standby on the site. In fact it acts as a "boat hotel" for the crew. When the alternative SM uses its auxiliaries for operations and life on board more than 3 hours CTV is less impacting even from 100km from land to wind farms. However, when the alternative SM uses its auxiliary for life on board less than 2 hours, it becomes more advantageous, from 50km offshore.
TABLE V. COMPARISON OF ENVIRONMENTAL IMPACT (EI99) BETWEEN SMREF AND SMOPT
120 min Waiting time / wind farm 180 min Waiting time/ wind farm Impact Raw materials/ Manufacturing (Pt) WT unavailability due to corrective maintenance (Pt/20ans) WT unavailability due to summer preventive maintenance (Pt/20ans) Use/ 10km Use/ 50km Use/ 100km Use/ 10km Use/ 50km Use/ 100km SMref 38 294 3 313 001 203 865 50 710 248 380 495 468 50 710 248 380 495 468 SMopt 343 229 2 803 941 155 680 429 594 491 045 567 859 621 306 682 757 759 571
Figure 3. Environmental Impact of System of Renewable Energy production
V. DISCUSSIONS
This approach should be applied at the same time as designing WT. It would be interesting to assess the size of the wind farm coupled with the power of WT. For example, is it better to design a 500 MW wind farm composed by 80 * 6MW, or composed by 62* 8 MW WTs.
The failure rate of these turbines is assumed to be different (because the technologies used are different).
Unavailability of 8 MW WTs may be more important generating more environmental impact with production of non-renewable energy. In exchange, the maintenance of a smaller wind farm may induce fewer resources in terms of maintenance. In conclusion, the environmental performance of Systems of Energy Production and system of maintenance are interdependent.
REFERENCES
[1] Van Bussel GJW., Zaaijer, M. B. Estimation of turbine reliability figures within the DOWEC project. DOWEC Report Nr. 10048, Issue 4, Netherlands, Oct 2003.
[2] Halvorsen-Weare, E. E., Gundegjerde, C., Halvorsen, I. B., Hvattum, L. M., Nonås, L. M. Vessel fleet analysis for maintenance operations at offshore wind farms. Energy Procedia, 35:167–176, 2013 [3] Christensen, P., Giebel, G. (2001). Availability of wind turbines in
remote places. A statistical and a real-time view. In P. Helm, & A. Zervos (Eds.), Wind energy for the new millennium. Proceedings. (pp. 162-165). München: WIP Renewable Energies.
[4] System Reliability Center URL:
http://src.alionscience.com/pdf/MaintOptimDesc.pdf
[5] Ajukumar, V. N., Gandhi, O. P. (2013) Evaluation of green maintenance initiatives in design and development of mechanical systems using an integrated approach, Journal of Cleaner Production, Volume 51, 15 pp. 34-46
[6] Tavner, P., Spinato, F., Van Bussel GJW., Koutoulakos, E., 2008. Reliability of different wind turbine concepts with relevance to offshore application. European Wind Energy Conference (EWEC2008), Brussels, Belgium.
[7] Sainz, E., Llombart, A., Guerrero, J. J. (2009) Robust filtering for the characterization of wind turbines: Improving its operation and maintenance, Energy Conversion and Management, Volume 50, Issue 9, September, Pages 2136-2147
[8] Nielsen, J. J., Sørensen, J. D. (2010) Planning of O&M for Offfshore Wind Turbines using Bayesian Graphical Models. Reliability, Risk and Safety : back to the future: ESREL 2010 : annual conference, 5-9 September 2010, Rhodes, Greece.
[9] Scheu, M, Matha, D., Hofmann, M., Muskulus,
M. (2012) Maintenance Strategies for Large Offshore Wind Farms. Energy Procedia (24) pp. 281 – 288
[10] British Standard Institution, BS3811 Glossary of maintenance terms interotechnology, BSI, London, 1984.
[11] Münsterberg, T., Robert Rauer, R., Jahn, C. 2013. Design and Evaluation Tool for Operations and Maintenance Logistics Concepts for Offshore Wind Power Plants. Journal of Energy and Power Engineering 7 (2013) p. 2054-2059.
[12] Obdam, T., Braam, H., van de Pieterman, R., Rademakers, L. (2011) O&M Cost Estimation & Feedback of Operational Data. Wind Farm - Technical Regulations, Potential Estimation and Siting Assessment. Chapter 2.
[13] Dowell, J., Walls, L., Zitrou, A., Infield, D. (2013) Analysis of wind and wave data to assess maintenance access for offshore wind farms. Paper presented at 22nd ESREL conference 2013, Amsterdam, Netherlands
[14] International Organization for Standardization, 2006b. ISO 14044:2006 – Environmental management - Life cycle assessment - Requirements and guidelines (ISO Standard), Environmental management.
[15] Richardson, O., 2010. Relating onshore wind turbine reliability to offshore application. Masters thesis, Durham University.
[16] Arwadel, S. R., Lackner, M. A., Grigoriu, M. D., 2011. Probalistic Models for Wind Turbine and Wind Farm Performance. J. Sol. Energy Eng. 133 (4)
[17] Ribrant, J., Bertling, L.M. (2007) Survey of Failures in Wind Power Systems With Focus on Swedish Wind Power Plants During 1997– 2005. Energy Conversion, IEEE Transactions on , vol.22, no.1, pp.167,173.
[18] http://www.infoclimat.fr/mer/
[19] Tavner, P., 2012.Offshore Wind Turbine – Reliability, availability and maintenance. The Institute of Engineering and Technology.
![TABLE I. G ENERIRIC RELIABILITY OF W IND T URBINES [17]](https://thumb-eu.123doks.com/thumbv2/123doknet/14582159.729390/5.918.103.408.246.436/table-i-g-eneriric-reliability-w-ind-urbines.webp)