HAL Id: tel-01595953
https://tel.archives-ouvertes.fr/tel-01595953
Submitted on 27 Sep 2017HAL is a multi-disciplinary open access
archive for the deposit and dissemination of sci-entific research documents, whether they are pub-lished or not. The documents may come from teaching and research institutions in France or abroad, or from public or private research centers.
L’archive ouverte pluridisciplinaire HAL, est destinée au dépôt et à la diffusion de documents scientifiques de niveau recherche, publiés ou non, émanant des établissements d’enseignement et de recherche français ou étrangers, des laboratoires publics ou privés.
renewable energy sources
Yunbo Li
To cite this version:
Yunbo Li. Resource allocation in a Cloud partially powered by renewable energy sources. Distributed, Parallel, and Cluster Computing [cs.DC]. Ecole nationale supérieure Mines-Télécom Atlantique, 2017. English. �NNT : 2017IMTA0019�. �tel-01595953�
Yunbo L
I
Mémoire présenté en vue de l’obtention du
grade de Docteur de l’École nationale supérieure Mines-Télécom Atlantique Bretagne Pays de la Loire
sous le sceau de l’Université Bretagne Loire
École doctorale : Sciences et technologies de l’information, et mathématiques (STIM 503) Discipline : Informatique, section CNU 27
Unité de recherche : Laboratoire des Sciences du Numérique de Nantes (LS2N) & Institut de Recherche en Informatique et Systèmes Aléatoires (IRISA)
Soutenue le 12 juin 2017 Thèse numéro : 2017IMTA0019
Resource allocation in a Cloud partially
powered by renewable energy sources
JURY
Président : M. Romain ROUVOY, Professeur, Université de Lille Rapporteurs : M. Pascal BOUVRY, Professeur, Université du Luxembourg
MmePatricia STOLF, Maître de conférences (HDR), Université Toulouse Jean-Jaurès Examinateurs : M. Laurent LEFÈVRE, Chargé de recherche (HDR), Inria
M. Romain ROUVOY, Professeur, Université de Lille Directeur de thèse : M. Jean-Marc MENAUD, Professeur, IMT Atlantique
Je voudrais tout d’abord remercier tout particulièrement mes encadrants de thèse, Dr. Anne-Cécile Orgerie (CNRS) et Pr. Jean-Marc Menaud (IMT-Atlantique), qui m’ont dirigé tout au long de ces trois années de thèse. Ils ont toujours été disponibles, à l’écoute de mes nombreuses questions, et se sont toujours intéressés à l’avancée de mes travaux.
Je tiens à exprimer ma reconnaissance à Dr. Christine Morin, je suis ravi d’avoir travaillé dans son équipe Myriads. Je remercie également Pr. Jean-Louis Pazat qui m’a beaucoup apporté.
Dr. Patricia Stolf et Pr. Pascal Bouvry m’ont fait l’honneur d’être rapporteurs de ma thèse, pour le temps consacré à la lecture de cette thèse, et pour les suggestions et les remar-ques intéressantes qu’ils m’ont faites.
Je tiens à remercier Dr. Laurent Lefèvre et Pr. Romain Rouvoy pour avoir accepté de participer à mon jury de thèse.
Ayant effectué mon stage à l’Université Rutgers, je remercie Pr. Manish Parashar et Dr. Ivan Rodero avec qui j’ai eu la chance de pouvoir travailler. Leur rigueur, leurs capacités d’analyse des problèmes et leurs connaissances ont été très utiles pour me permettre de pro-gresser ainsi quel leurs réponses à mes questions.
Je remercie également tous les thésards David Guyon, Ismael Cuadrado Cordero, Anna Giannakou, Bogdan F. Cornea, Amir Teshome Wonjiga, Anca Iordache, Genc Tato et Gilles Madi-Wamba qui m’ont entouré et m’ont conseillé.
Je remercie toutes les personnes dans le projet EPOC qui j’ai partagé mes travaux et no-tamment ces années de thèse : Nicolas Beldiceanu, Bárbara Dumas Feris, Philippe Gravey, Sabbir Hasan, Claude Jard, Thomas Ledoux, Didier Lime, Gilles Madi-Wamba, Pascal Morel, Michel Morvan, Marie-Laure Moulinard, Jean-Louis Pazat, Olivier H. Roux, Ammar Sharaiha.
Mes derniers remerciements vont à mes parents et ma copine Zifan, je n’aurais rien fait de tout cela sans votre amour.
Remerciements 3
List of Tables 7
List of Figures 9
1 Introduction 13
1.1 Context . . . 13
1.2 Problem Statement and Research Challenges . . . 14
1.3 Contributions . . . 15
1.3.1 Publications . . . 16
1.3.2 Dissertation organization . . . 16
2 State of the Art 19 2.1 Introduction . . . 19
2.2 Data center: server, storage and network energy use . . . 19
2.2.1 Data center types and components . . . 20
2.2.2 Energy consumption of computing, storage and network devices . . . 21
2.2.3 Green metrics . . . 24
2.3 Energy saving approaches . . . 25
2.3.1 Energy efficiency . . . 25
2.3.2 Energy proportionality. . . 26
2.3.3 Virtualized Infrastructure for Cloud Computing . . . 28
2.3.4 A little more green . . . 34
2.3.5 Novel cloud architectures . . . 36
2.4 Summary . . . 38
3 EpoCloud data center 39 3.1 EpoCloud principles . . . 39
3.2 EpoCloud hardware architecture . . . 40
3.2.1 High throughput optical networks for VM migration . . . 41
3.2.2 Disk throughput . . . 41
3.3 Real traces . . . 43
3.3.1 Workload trace . . . 43
3.3.2 Solar energy trace . . . 45
3.4 Trace-driven simulator . . . 45
3.5 Summary . . . 46 5
4 Opportunistic scheduling (PIKA) for maximizing renewable energy consumption
in Cloud’s data centers 49
4.1 Problem formulation . . . 50
4.1.1 Job . . . 50
4.1.2 Workload . . . 50
4.2 PIKA overview . . . 51
4.3 Resource management and job scheduling. . . 53
4.3.1 Overloaded PM detection . . . 53
4.3.2 Gap . . . 54
4.3.3 VM placement . . . 56
4.3.4 Consolidation and migration . . . 56
4.4 Over-commit resource policies . . . 57
4.4.1 Non over-commit policy . . . 57
4.4.2 Over-commit RAM policy . . . 57
4.4.3 Over-commit CPU policy . . . 57
4.4.4 Optimal Over-commit CPU/RAM policy . . . 57
4.5 Experimental setup . . . 58
4.5.1 Trace-driven simulator . . . 58
4.5.2 Real-world traces . . . 58
4.6 Evaluation . . . 58
4.6.1 The performance of resource over-commitment policies. . . 58
4.6.2 Energy model . . . 60
4.6.3 Simulation results . . . 61
4.7 Conclusion . . . 63
5 Balancing the use of batteries and opportunistic scheduling policies 65 5.1 Energy Storage Devices. . . 66
5.2 Context and assumptions . . . 66
5.2.1 Small and medium data centers. . . 67
5.2.2 ESD model. . . 67
5.3 VM scheduling . . . 68
5.3.1 Baseline algorithm . . . 68
5.3.2 Opportunistic job scheduling . . . 69
5.3.3 Battery charge/discharge model . . . 69
5.4 Experimentation conditions . . . 70
5.4.1 Workload trace . . . 71
5.4.2 Solar energy trace . . . 71
5.5 Results . . . 71
5.5.1 Find the optimal solar panel dimension . . . 71
5.5.2 Find optimal battery size in ideal case . . . 72
5.5.3 Opportunistic vs. baseline when solar energy is not sufficient for the entire workload consumption . . . 73
5.5.4 Solar energy losses with variable battery size . . . 74
5.5.5 Opportunistic scheduling migration vs. baseline battery loss . . . 74
5.5.6 FFD scheduling impact . . . 75
5.5.7 Comparison of the approaches on a realistic scenario . . . 76
6 Leveraging Renewable Energy in Edge Clouds for Data Stream Analysis in IoT 79
6.1 Driving Use Case . . . 80
6.2 System model and assumptions . . . 80
6.2.1 Edge and Core model . . . 80
6.2.2 Renewable energy and ESD model . . . 82
6.3 Experimentation. . . 82
6.3.1 Setup . . . 82
6.3.2 VM size and time analysis . . . 83
6.3.3 Edge and core clouds’ energy consumption . . . 85
6.3.4 The detection accuracy and number of cameras . . . 87
6.4 Conclusion . . . 89
7 Conclusion 91 7.1 Summary of the Dissertation . . . 91
7.2 Perspective . . . 93
7.2.1 Thermal-aware job scheduling . . . 93
7.2.2 In-transit strategy . . . 93
7.2.3 Geographically distributed data centers . . . 94
A Appendix - Simplification of Equation 6.2 97 B Appendix - Simulator description 101 B.1 Data center module . . . 103
B.2 Server module . . . 103
B.3 Energy consumption module and interface . . . 103
B.4 VM module . . . 104
B.5 Web/batch Jobs module . . . 104
B.6 ESD module . . . 105 C Résumé en français 107 C.1 Contexte . . . 107 C.2 Problématique . . . 108 C.3 Contributions . . . 109 C.4 Approche opportuniste . . . 110
C.5 Combiner l’utilisation de batteries et l’approche opportuniste . . . 111
C.6 Explorer l’intégration d’énergie solaire dans le Edge Computing . . . 112
C.7 Organisation du manuscrit. . . 112
2.1 Green metrics . . . 24
3.1 Different Volume of SSD . . . 42
3.2 Performance with different number of channels for PCIe . . . 42
3.3 Initial server’s hardware configuration . . . 43
4.1 Job characteristics (Hour) . . . 58
4.2 Number of VMs on PM1 . . . 59
4.3 Number of VMs on PM2 . . . 59
4.4 Energy saving results (kWh) . . . 62
5.2 The energy consumption with a 160 m2 solar farm and 40 kWh LI battery . . 76
2.1 Estimated U.S. data center electricity consumption by market segment (data
from [WD14]) . . . 20
2.2 Typical breakdown of the data center energy consumption (data from [SBD07]) 21 2.3 Number of installed servers (data from [She+16]). . . 22
2.4 Total U.S. Annual Direct Server Electricity Consumption by Server Class (data from [She+16]) . . . 22
2.5 Total U.S. Data Center Storage Installed Base in Capacity (data from [She+16]) 22 2.6 Total U.S. Data Center Storage Electricity Consumption (data from [She+16]) 23 2.7 Total U.S. Data Center Network Equipment Electricity Consumption (data from [She+16]) . . . 23
2.8 Total Data Center Electricity Consumption (data from [She+16]) . . . 24
2.9 Traditional 2-dimensional bin packing . . . 28
2.10 VM 2-dimensional (CPU/RAM constraints) Parking Problem . . . 28
2.11 Next-fit, First-fit, Best-fit . . . 29
2.12 Architecture of inter-rack live migration [DKG12]. . . 31
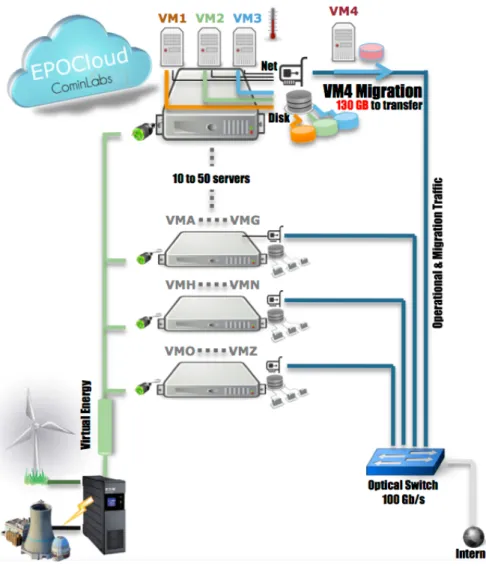
3.1 EpoCloud architecture . . . 40
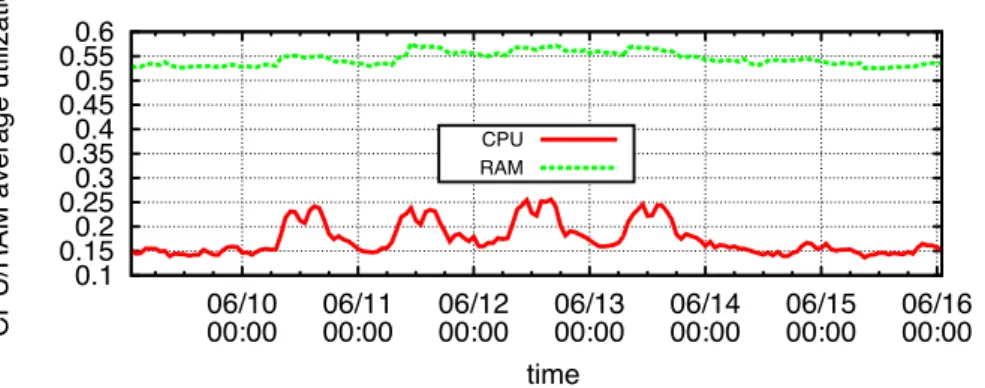
3.2 Server CPU (left) and RAM (right) average utilization (%) . . . 44
3.3 VM CDF . . . 44
3.4 A week records of solar energy (from March 1 to March 8, 2015). . . 45
4.1 CPU and RAM real utilization over one-week of real trace . . . 51
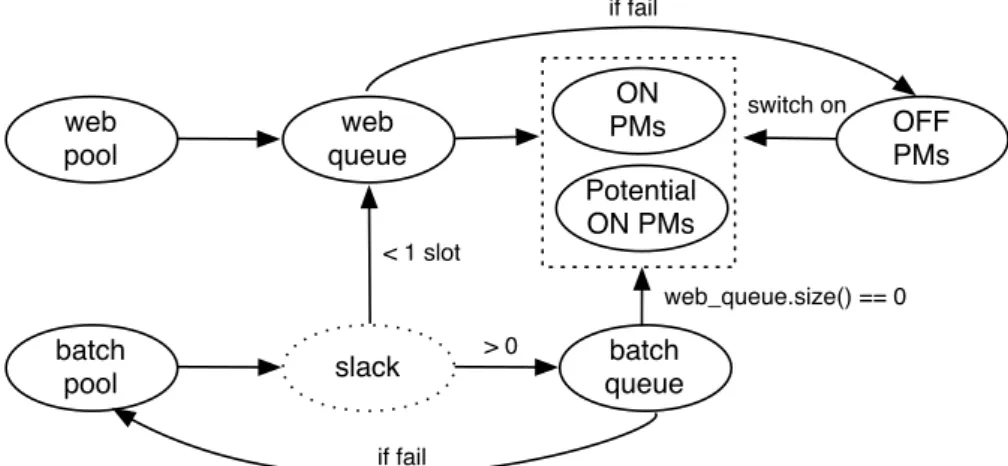
4.2 PIKA framework . . . 51
4.3 The mutation of a batch job when its deadline is approaching . . . 52
4.4 VM placement for batch and web jobs . . . 53
4.5 (a) CPU real-time utilization; (b) total VM allocation ratio for the CPU OC policy 59 4.6 (a) RAM real-time utilization; (b) total RAM allocation ratio for the CPU OC policy . . . 60
4.7 Energy consumption of a Taurus node with different number of activated cores in Watts on Grid’5000 Lyon site. It owns 12 cores, each running at 2,933 MHz. . . 60
4.8 Energy consumption : baseline vs PIKA . . . 62
5.1 Energy sources of the data center . . . 67
5.2 Workload energy consumption and solar energy production . . . 70
5.3 Solar energy production with solar panels of 5.52 m2 . . . . 71
5.4 Workload energy/solar energy supply ratio and maximum solar energy that can be generated per time unit . . . 72
5.5 First two curves (purple and green): brown energy consumption with an LI ESD. Last two curves (blue and yellow): corresponding ESD volume. . . 73
5.6 Brown energy consumption with varying battery size . . . 73 11
5.7 Solar energy lost due to the limited battery size . . . 74
5.8 Migration cost vs. battery efficiency loss . . . 75
5.9 . . . 77
6.1 Use case example for IoV with edge and core clouds . . . 81
6.2 Analysis time on different VM sizes . . . 83
6.3 Energy consumption and frame analysis resolution time in 360p, 480p and 720p 84 6.4 The renewable energy is not available at edge in Figures (a) and (b) and is available in Figures (c), (d), (e) and (f) . . . 86
6.5 Reliability . . . 88
7.1 Computing partially at edge . . . 94
B.1 Data center architecture . . . 101
B.2 UML: Trace-driven cloud simulator included ESD and multiple-data-centers extensions . . . 102
1
Introduction
1.1
Context
With the rapidly increasing demand in Cloud computing services, the usage of data cen-ters (DCs), increases dramatically [OAaL14]. Consequently, the global electricity part dedi-cated to DCs’ consumption has reached unprecedented levels. In 2012, the number of data centers worldwide was estimated at 509,147 consuming roughly the output of 30 nuclear power plants [Gla12]. In 2016, another study estimates that worldwide the data centers use 91 billion kilowatt-hours of electricity – enough to power New York City twice over – and their consumption is still growing rapidly [Res16]. This ever-growing electricity consump-tion constitutes a major concern for DC operators.
Besides the ecological impact, the energy consumption is a predominant criteria for cloud providers since it determines the daily cost of their infrastructure. As a consequence, power management becomes one of the main challenges for DC infrastructures and more generally for large-scale distributed systems [OAaL14].
In parallel to the expansion of cloud computing, since several years, a new model emerges: decentralized cloud infrastructures [Ber+14]. To improve the performance of their cloud and to leverage their available infrastructure, telecommunication operators, like Orange, try to deploy micro data center (20 to 50 servers by micro-DC) at the network border, closer to customers. In this new model, by deploying data centers closer to the user, cloud operators aim at improving the response time and throughput of applications.
One way to save energy at a data center level consists in locating it close to where the electricity is generated, hence minimizing transmission losses. For example, Western North Carolina, USA, attracts data centers with its low electricity prices due to abundant capac-ity of coal and nuclear power following the departure of the region’s textile and furniture manufacturing [Gre]. In 2011, this region had three super-size data centers from Google, Apple and Facebook with respective power demands of 60 to 100 MW, 100 MW and 40 MW [Gre] and these DCs are still in-use nowadays. However, such huge facilities repre-sent only a small fraction of the global consumption of data centers. Indeed, small- and medium-sized server rooms continue to account for nearly half the electricity consumption of the market [WD14].
Other companies opt for greener sources of energy. For example, Quincy (Washington, USA) supplies electricity to data facilities from Yahoo, Microsoft, Dell and Amazon with its
low-cost hydro-electrics left behind following the shutting down of the region’s aluminum industry [Gre]. Several renewable energy sources like wind power, solar energy, hydro-power, bio-energy, geothermal power and marine power can be considered to power up super-sized facilities. The production variability of most renewable sources leads data center facilities to only partially rely on them and to depend also on the the regular electrical grid as a backup.
While using renewable sources bring new opportunities to reduce energy costs, reduce peak power costs, or both [Goi+13], they are mostly intermittent and fluctuating over time (sun, wind, etc.). These variations may lead to electricity losses if the computing workload does not match the renewable production. Cloud infrastructures, on the other hand, can take advantage of multiple locations to increase their green consumption with approaches such as follow-the-sun and follow-the-wind [Fig+09]. As sun and wind provide renewable sources of energy whose capacity fluctuates over time, the rationale is to place computing jobs on resources using renewable energy, and migrate jobs as renewable energy becomes available on resources in other locations.
From an energy point of view, these micro-data centers allow the study of new power supply solutions based on renewable energy, like wind or sun. Using these renewable en-ergy sources can reduce the operating cost but, unfortunately, this kind of enen-ergy stays in-termittent by nature.
1.2
Problem Statement and Research Challenges
For the last decade, there has been substantial improvements in data center efficiency. Much of the progress on efficiency has been made in the domain of facility and equipment. For instance, Google and Facebook developed their own ultra-efficient server farms with free cooling solutions. While the modern server has become more power-efficient, despite massive state-of-the-art work to improve the power management of possessors, servers are still far from pure power-proportional behavior. Indeed, an idle server can consume up to 50% of its maximal power [LWW07;FWB07;MGW09].
Little progress has been done in the field of server operation efficiency with regard to server utilization. The server utilization represents the ratio between the physical resources (e.g., CPU, RAM) consumed by processing load and the maximum server capacity [BH07]. Several studies show that the average server utilization – particularly, in term of average CPU utilization – remains static around 12 to 18 percent [WK12; Sny10]. These idle or un-derutilized servers are still consuming energy while most of the time doing little work. Vir-tualization has been rapidly and widely implemented in modern data centers. This tech-nology enables a single physical machine to run multiple isolated operating systems. This also means that using fewer physical machines, one is able to handle the same quantity of computational tasks. Yet, even with virtualization, that is broadly deployed in data centers, the server’s average utilization is typically below 40 percent [WD14].
Integrating renewable energy into DCs is expected to be an important factor in the de-sign of next generation of DCs. It can offset a part of energy consumed from traditional supply (e.g. fossil fuel), thus reducing the carbon emissions. However, a major challenge for employing renewable energy sources for DCs, such as solar and wind, is their variable and intermittent nature. Unlike traditional energy sources that enable to provide a controllable and steady power, the renewable energy is difficult to meet the workload power require-ments. Another possible method for improving the effective utilization of intermittent and fluctuating renewable consists in using energy storage devices (i.e. batteries) to store green production surplus, and to use it during low production periods [Goi+13]. Typically for
solar sources, energy can be stored during the day – if not fully consumed – and be utilized during nights when there is no production. However, batteries have an inherent energy ef-ficiency (their yield) that leads to energy losses. A framework for managing Infrastructure-as-a-Service (IaaS) cloud resources of a single data center is needed to improve not only the energy-efficiency, but also to give means for optimizing the utilization of renewable energy.
Our objectives are the following:
— investigating renewable energy integration into DCs;
— providing resource management algorithms to increase energy-efficiency and to op-timize renewable energy consumption for a single Cloud DC;
— providing a framework making use of energy storage devices and resource manage-ment algorithms for maximizing renewable energy consumption in a Cloud DC; — validating this framework under realistic conditions.
1.3
Contributions
The main goal of this thesis consists in keeping a low fossil energy consumption level in the data center, thus reducing the CO2 emissions. It starts by observing real traces of solar power production that verifies the intermittent and variable nature of renewable en-ergy. Another data analysis on trace of real-world server utilization from a small data center demonstrates that the server average utilization stays in very low levels of use with regard to CPU utilization. This analysis also shows that the server average utilization trend is less variable than renewable energy that is intermittent by nature. Meanwhile, we find that part of computational tasks present slack periods of time that enables to shift the computations in time. According to these observations and analysis, we present our contributions in this thesis as follows:
1. We propose a novel framework: oPportunistic schedulIng broKer infrAstructure (PIKA) [LOM15] to save energy in small mono-site data centers. PIKA aims at reducing the brown energy consumption (ie. from non-renewable energy sources), and improves the usage of renewable energy without energy storage for mono-site data center. It exploits jobs with slack periods, and executes or suspends them depending on the renewable energy availability. By consolidating the virtual machines (VMs) on the physical servers, PIKA adjusts the number of powered-on servers in order for the overall energy consumption to match with the renewable energy supply.
2. Another approach for improving the effective utilization of intermittent and fluctu-ating renewable energy consists in using batteries to store green production surplus, and to use it during low production periods. Typically for solar sources, energy can be stored during the day – if not fully consumed – and be utilized during nights when there is no production. However, Energy Storage Devices (ESDs) have an inherent energy efficiency due to different battery technologies that leads to energy losses. In the second contribution [LOM17], we discuss both the opportunistic scheduling and ESDs-based approaches for maximizing the usage of renewable energy in small and medium data centers, and we propose a solution mixing both approaches.
3. Finally, inspired by previous works, we propose to leverage on-site renewable en-ergy production in the different edge cloud nodes to make Internet of Things (IoT) greener [Li+17]. Our aim is to evaluate, on a concrete use-case, the benefits of edge computing regarding renewable energy consumption. We propose an analytic model for deciding whether to offload computation from the objects to the edge or to the core Cloud, depending on the renewable energy availability and the desired application
Quality of Service (QoS), in particular trading-off between performance (response time) and reliability (service accuracy).
This thesis has been done in the context of the EPOC project (Energy Proportional and Opportunistic Computing systems, Labex CominLabs, http://www.epoc.cominlabs. ueb.eu, 2013-2017).
1.3.1
Publications
Peer-reviewed journal papers:
— Towards energy-proportional Clouds partially powered by renewable energy
Nicolas Beldiceanu, Bárbara Dumas Feris, Philippe Gravey, Sabbir Hasan, Claude Jard, Thomas Ledoux, Yunbo Li, Didier Lime, Gilles Madi-Wamba, Jean-Marc Menaud, Pascal Morel, Michel Morvan, Marie-Laure Moulinard, Anne-Cécile Orgerie, Jean-Louis Pazat, Olivier H. Roux, Ammar Sharaiha
Computing, Springer Verlag, volume 99, issue 1, pages 3-22, January 2017.
Peer-reviewed international conference articles:
— The EPOC project: Energy Proportional and Opportunistic Computing system Nicolas Beldiceanu, Bárbara Dumas Feris, Philippe Gravey, Sabbir Hasan, Claude Jard, Thomas Ledoux, Yunbo Li, Didier Lime, Gilles Madi-Wamba, Jean-Marc Menaud, Pascal Morel, Michel Morvan, Marie-Laure Moulinard, Anne-Cécile Orgerie, Jean-Louis Pazat, Olivier Roux, Ammar Sharaiha
International Conference on Smart Cities and Green ICT Systems (SMARTGREENS), pages 1-7, May 2015, Lisbon, Portugal.
— Opportunistic Scheduling in Clouds Partially Powered by Green Energy Yunbo Li, Anne-Cécile Orgerie, Jean-Marc Menaud
IEEE International Conference on Green Computing and Communications (GreenCom), pages 448-455, December 2015, Sydney, Australia.
— Balancing the use of batteries and opportunistic scheduling policies for maximizing
renewable energy consumption in a Cloud data center
Yunbo Li, Anne-Cécile Orgerie, Jean-Marc Menaud
Euromicro International Conference on Parallel, Distributed, and Network-Based Processing (PDP), pages 1-8, March 2017, St Petersburg, Russia.
— Leveraging Renewable Energy in Edge Clouds for Data Stream Analysis in IoT Yunbo Li, Anne-Cécile Orgerie, Ivan Rodero, Manish Parashar, Jean-Marc Menaud IEEE/ACM International Symposium on Cluster, Cloud and Grid Computing (CCGrid), May 2017, Madrid, Spain.
— Towards energy-proportional Clouds partially powered by renewable energy
Nicolas Beldiceanu, Bárbara Dumas Feris, Philippe Gravey, Sabbir Hasan, Claude Jard, Thomas Ledoux, Yunbo Li, Didier Lime, Gilles Madi-Wamba, Jean-Marc Menaud, Pascal Morel, Michel Morvan, Marie-Laure Moulinard, Anne-Cécile Orgerie, Jean-Louis Pazat, Olivier H. Roux, Ammar Sharaiha
Computing, Springer Verlag, volume 99, issue 1, pages 3-22, January 2017.
1.3.2
Dissertation organization
The rest of this manuscript is organized as follows.
Chapter 2 surveys recent green computing efforts to save energy at infrastructure level in data centers. We highlight the different mechanisms at server level to save brown en-ergy consumption, particularly with regard to power proportionality and enen-ergy efficiency. We identify opportunities for further reducing data center energy consumption that relates
to renewable energy integration. We then survey the technical landscape to increase the renewable energy usage.
Chapter 3 presents the EpoCloud architecture from hardware to middleware layers: this data center architecture has been designed within the context of the EPOC project. This prototype aims at optimizing the energy consumption of mono-site Cloud data centers con-nected to the regular electrical grid and to renewable-energy sources. Later in this chapter, we describe a self-developed trace-driven simulator implementing this prototype and that is used for parts of the experimentation done in this thesis.
Chapter 4 presents the proposed framework PIKA that consists of energy-aware oppor-tunistic scheduling algorithms based on the distinction of two kinds of tasks (web tasks and batch tasks) and that leverages renewable energy availability to perform opportunistic tasks without hampering performance.
Chapter 5 presents an ESD-based approach for increasing the renewable energy utiliza-tion. We distinguish the performance between opportunistic scheduling and ESD-only solu-tion. A hybrid solution is proposed later in this chapter that intends to find a good trade-off between these two approaches.
Chapter 6 advocates for leveraging on-site renewable energy production in the different edge cloud nodes for greening IoT systems while offering improved QoS compared to core cloud solution. We propose an analytic model to decide whether to offload computation from the objects to the edge or to the core Cloud, depending on the renewable energy avail-ability and the desired application QoS. This model is validated on our application use-case that deals with video stream analysis from vehicle cameras.
2
State of the Art
2.1
Introduction
Cloud computing represents currently the most emphasized paradigm for providing and managing the Information and Communications Technology (ICT) resources to the online user. The basic concept of Cloud computing consists in making the distribution of comput-ing resources in a large number of distributed computers, rather than the local computer or remote server. Since its appearance, the demand for computing and storage resources in data centers has rapidly grown, leading to a consequent increase of their energy consump-tion. As an example, for 2010, Google used 900,000 servers and consumed 260 million watts of electricity [Koo11]. Electricity becomes a key issue for deploying data center equipment.
Since the servers are among the primary energy consumers of data centers [SBD07], many green proposals have addressed the problem of the server’s energy-efficiency. Dy-namic voltage and frequency scaling that exploits server performance knobs is an example of such proposals. Meanwhile, virtualization technology brings new opportunity for saving energy. It enables processing multiple requests on the same server, thus making it possible to run the workload on fewer servers by consolidation. In addition, using clean energy and integrating renewable energy into data centers can result in further brown energy saving and reduces dependency on traditional energy sources (e.g. fossil fuel).
The rest of this chapter is organized as follows. Section 2.2 provides an overview of the energy consumption of different components in cloud data centers. The research ef-forts of energy-efficient technologies are presented in Section 2.3.1and energy proportion-ality are presented in Section 2.3.2. Section 2.3.3 presents virtualization technologies for energy-saving and formalizes corresponding optimization problems. Section2.3.4presents the opportunity of integrating renewable energy for further reducing energy consumption. Section 2.3.5 describes a novel cloud architecture that leverages renewable energy in edge cloud data centers. Lastly, we summarizes this chapter in Section2.4.
2.2
Data center: server, storage and network energy use
Cloud resources are gathered in data centers whose size depends on the activity of the Cloud provider. A data center (DC) is a facility used to house tens to thousands of com-puters and their associated components. These servers are used to host applications
able in the Internet, from simple web servers to multi-tier applications, but also some batch jobs [MSJ14]. Besides the ecological impact, the energy consumption is a predominant cri-teria for DC providers since it determines the daily cost of their infrastructure. As a conse-quence, power management becomes one of the main challenges for DC infrastructures and more generally for large-scale distributed systems [OAaL14]. In this section, we provide an overview of DC energy consumption worldwide.
2.2.1
Data center types and components
In Figure2.1, each segment represents the estimated energy consumption of data center market based on the number of installed servers and infrastructure electricity consump-tion [WD14]. Small- and medium-sized data centers account for nearly half the energy con-sumption of the market; they are typically composed of less than 100 servers with a light cooling system. Enterprise/Corporate data centers occupies 27 percent and multi-tenant data centers for 19 percent of global data center electricity consumption; multi-tenant data centers provide services to individual enterprises on a lease basis. The customers place and manage their own equipment while the data center provider manages the infrastructure and cooling facility.
Small- and Medium-Sized
Data Centers
49.0%
Enterprise/
Corporate
27.0%
Hyper-Scale Cloud Computing
4.0%
Multi-Tenant Data Centers
19.0%
High-Performance
Computing
1.0%
Figure 2.1 – Estimated U.S. data center electricity consumption by market segment (data from [WD14])
The energy consumption of hyper-scale cloud providers such as Google, Amazon and Facebook, only occupies 4 percent of the global data center energy consumption due to their aggressive deployment of energy efficiency mechanisms that lower their power bill. Finally, the smallest segment within data center market is high-performance computing (HPC); it is usually operated by universities and national research laboratories.
Inside the DC, the major energy consumer comprises IT (Information Technology) sys-tems and cooling facilities. As shown in Figure 2.2, the servers can consume twice more energy than cooling systems. The server utilization represents processing data on the server relative to its maximum capacity. It directly affects the data center efficiency because the
Server
46.0%
HVAC Cooling
23.0%
HVAC Fans
8.0%
Others
11.0%
UPS
8.0%
Lighting
4.0%
Figure 2.2 – Typical breakdown of the data center energy consumption (data from [SBD07]) server power efficiency drops dramatically when its utilization decreases [OAaL14]. The server’s power consumption at average utilization is also relevant to its power-proportional level. For instance, a server with a perfect power-proportionality means that it consumes 50% of server maximum power when the utilization is at 50%.
2.2.2
Energy consumption of computing, storage and network devices
This section relies on the data gathered for a 2016 study on United States data center energy usage [She+16]. It explores the energy consumption of the different data center com-ponents: the computing (servers), storage (disks) and network devices.Figure 2.3 demonstrates the number of installed servers and the future trend from the 2016 study [She+16] classified according to the number of processors (1S and 2S+) and the type of vendor (branded and unbranded, unbranded usually refers to the self-assembled or original design manufacturer (ODM) servers). This study relies on three previous studies covering the 2000-2020 period and which are used to determine the approximate lifetime of servers: for 2006-2020, the server lifetime is about 4.4 years. Then the estimated annual servers’ electricity consumption is shown in Figure2.4 under the assumption that for each server, its power consumption is a linear function of its utilization.
The installed base of data storage equipment’s estimate in terabyte (TB) is shown in Fig-ure2.5. This installed base is divided into solid-state drive (SSD) and hard disk drive (HDD) storage categories [She+16]. It uses past installed data (2010-2014) while SSD accounted for 8% in 2012, and forecast shipment data (2015-2019) revealing that SSD would grow to 22% by 2017.
The power consumption of traditional HDDs is usually higher according to per-disk level and is rarely dependent on the capacity of the disk. Instead, the power consumption of SSD units is more related to its capacity. Thus, it is more reasonable to convert both HDD and SSD storage from capacity to number of drive units to estimate the future trend. Based on industry feedback, HDDs should be able to provide a capacity of nearly 10TB per
Figure 2.3 – Number of installed servers (data from [She+16])
Figure 2.4 – Total U.S. Annual Direct Server Electricity Consumption by Server Class (data from [She+16])
drive unit in the future and SSD is assumed to reach an average capacity of 5 TB per drive unit [She+16]. The estimated energy consumption of storage is shown in Figure2.6. It shows that the energy consumption of installed HDDs will continue to grow until 2018 and after, it will begin to decrease, while the consumption of installed SSD will keep growing.
Figure 2.6 – Total U.S. Data Center Storage Electricity Consumption (data from [She+16]) The power consumption of network equipment is estimated by network port with dif-ferent port speed [She+16]. The categories of network ports can be divided into four: 100 Mb, 1000 Mb, 10 Gb, and 40 Gb. The estimate per-port wattage are 1.4 W, 2.3 W, 3.6 W and 6.12 W for 100 MB, 1000 Mb, 10 Gb and 40 Gb ports respectively. The energy consumption of network is estimated as the number of network ports and per-port power drawn for each port speed, based on the historical and forested data: the trend is displayed on Figure2.7. Basically, lower speeds (100 and 1000 Mb), which are less efficient, should almost disappear by 2020.
Figure 2.7 – Total U.S. Data Center Network Equipment Electricity Consumption (data from [She+16])
As shown in Figure 2.8, the growth rate of data center energy consumption has slowed down in recent years [She+16]. Server shipments experienced a five-year rapid growth pe-riod with 15% annual growth rate from 2000 to 2005. From 2005-2010, the annual growth rate fell to 5% probably due to economic recession and also because the energy efficiency mechanisms started to be implemented in server, storage, network and infrastructure along with virtualization techniques. After 2010, the growth rate drops to 3% and is expected to stay stable by 2020.
Figure 2.8 – Total Data Center Electricity Consumption (data from [She+16])
Through the examination of the power consumption share in DCs and the extrapolation for future trends, this study show that despite energy-efficiency improvements, the overall energy consumption of DCs will keep growing, and the server part will stay dominant.
2.2.3
Green metrics
In order to assess the energy-efficiency of data centers, several metrics have been pro-posed in literature. Table2.1details several existing green metrics for data centers.
Metric Description Formulation
PUE Power Usage Effectiveness PUE = IT equipment energyTotal facility energy CUE Carbon Usage Effectiveness CUE = IT equipment energyTotal CO2 emission WUE Water Usage Effectiveness WUE = Annual site water usageIT equipment energy
ERF Energy Reuse Factor ERF = IT equipment energyReuse energy ERE Energy Reuse Effectiveness ERE = Total energy - Reused energyIT equipment energy DCiE Data Center Infrastructure Efficiency DCiE = PUE1
DCP Data Center Productivity DCP = IT total facility powerUseful work ERP Energy-Response time Product ERPπ =E[pπ] ·E[Tπ] 1
GEC Green Energy Coefficient GEC = Total facility powerGreen power Table 2.1 – Green metrics
The most widely used and industry-acknowledged metric for current data centers is the PUE [Bel+08;Gre14]: Power Usage Effectiveness. Usually, a ideal PUE value is equal to 1.0: this indicates that the energy consumed by IT equipment is same as the total facility energy. The carbon dioxide emissions can be measured by their electrical equivalents (depending on the energy source) and multiplied their local carbon factor. The Carbon Usage Effective-ness (CUE) [Aze+10] is calculated through dividing the total carbon emission equivalents of total facility energy by the total IT energy consumption. The CUE is described in kilograms of carbon per kilowatt-hour. The lower CUE value indicates that lower carbon emission is associated with the data center operations.
1. where E[Pπ]=average power consumed under policy π, E[Tπ]=mean customer response time under
The water usage effectiveness (WUE) [ABP11] expresses water used for cooling and reg-ulating humidity. Combined, the PUE, CUE and WUE allow the data center operators to quickly evaluate the energy, carbon emission, and water aspects. While PUE has been broadly adopted in the industry, the CUE and WUE constitutes less used extensions of the xUE family.
The Energy Reuse Factor (ERF) [Pat+10] represents the ratio of the data center energy that is reused in the facility (e.g., the form of warm water or warm airflow is considered as a kind of reused energy) and the total energy consumed (including IT, cooling system, UPS, lighting, etc.). ERF will range from 0.0 to 1.0. Energy Reuse Effectiveness (ERE) is based on ERF, it is used for measuring the reusing heat generated by data center for other useful purposes.
Data Center Infrastructure Efficiency (DCiE) [Ver+07;Bel+08] is a metric used to describe the energy efficiency of a data center. DCiE is calculated by dividing the total power deliv-ered to the server racks in the data center by total facility power. In addition, DCiE can be showed as the reciprocal of PUE, where DCiE = PUE1 .
Data Center Productivity (DCP) [Bel+08] refers to quantify the useful work in relation to the energy it consumed. The data center is considered as a black box – the power goes into the box and the heat out. Similarly, the data goes into the box and the result out of the box – a net quantity of useful work has been done in this box. Energy-Response time Product (ERP) [GAL16;Cer+16] is used to capture the trade-off between the performance and energy consumption: a delay is occurred when the server switches from a sleep state to a functional state, resulting in an energy cost.
Green Energy Coefficient (GEC) is a metric providing the ratio of the energy generated by renewable sources over the energy production from all the energy sources. For example, France, on November 2015 [GOM17], has a GEC of 0.14 as 14% of the energy use is sourced from green providers2like solar, wind and hydro.
2.3
Energy saving approaches
In this section, we present recent efforts on reducing data center energy consumption. These efforts generally address the problems of: energy efficiency, energy proportionality and integrating renewable energy in DCs. The energy efficiency and energy proportionality problems in particular concentrate on optimizing the energy consumption at the server level (e.g., optimize processor used frequency, turn on/off the underutilized server). The solu-tions of integrating renewable energy are mainly divided into without-battery approaches (i.e., this relies on supply-following model with a classification of job types, their charac-teristics enabling the workload to match the renewable energy supply) and with-battery approaches (i.e., this simply stores the surplus energy from renewable energy supply into battery for future use).
2.3.1
Energy efficiency
The Dynamic Voltage Frequency Scaling (DVFS) technology is widely implemented in DC servers. It is an efficient mechanism that enables servers and other devices to increase/de-crease dynamically the operating frequency and voltage. Mathematically, the dynamic power consumption of processor [Bel+11] can be expressed as:
P = 1 4αCV
2
f (2.1)
where α is the value of switching activity and C is the capacitance, they are both physical parameters that are determined by the system design. V represents the processor voltage, and f corresponds to the clock frequency. Formula2.1 illustrates that the power consump-tion of processor is approximately proporconsump-tional to its frequency and voltage[RTZ11;Riz+10]. However, there is no free lunch. Scaling down the processor voltage and frequency in or-der to reduce the power consumption of the processor will lead to a performance degrada-tion [WCC14].
Yao et al. [YDS95] propose an off-line job scheduling algorithm in which each job has to be finished before its deadline by a single processor with variable speeds. In [IY98], T. Ishihara et al. propose a model of dynamically variable voltage processor to optimize the power-delay trade off. By determining the voltage scheduling for a given application, this model is able to minimize energy consumption without missing its deadline.
In early researches, the proposed DVFS algorithms focused on minimizing energy con-sumption while still meeting the deadlines. Quan et al. [QH01] present two off-line DVFS algorithms to save energy. The first algorithm seeks the minimum constant speed needed to satisfy each job deadline and shuts down the processor when it is idle, since the minimum constant speed usually has a lower power consumption. The second algorithm builds on the first one and integrates a global voltage schedule. The authors prove that the global voltage schedule outperforms approaches that only uses the minimum constant voltage.
Hua et al. [HQ03] propose an analytic optimal solution and a linear search algorithm for the dual-voltage system. The voltage set-up algorithm determines the optimal voltage that minimizes the total energy consumption without missing the deadline of applications. The authors also point out the hardware overhead cannot be ignored (e.g., the area and power on the voltage regulators). When there are more than two voltages available, a linear approximation algorithm is proposed for determining the optimal number of voltage lev-els taking into account the hardware overhead. The experimental results demonstrate that when the voltages are set up properly, the DVFS technique can reduce energy consumption significantly.
Several studies have shown that a high temperature in the operation of data center leads to a lower reliability of the servers and increase the cooling energy overhead. Cupertino et al.[Cup+15] addressed the problem of energy-thermal efficiency of data centers. The authors proposed a cooling model of data center to present cooling devices (chiller, fans) power consumption, in terms of ambient temperature, inlet air room operation temperature and partial load. More recently, Sun et al. [SSP17] studied the spatio-temporal thermal-aware scheduling for homogeneous data centers. In their proposed scheduling algorithm, DVFS is not only used to regulate the temperature of servers during their executions, but also to maximize the throughput (i.e., minimize the makespan for high performance computing applications), so as to optimize the energy consumption.
Although DVFS provides a way to control power consumption of the CPU, it still has lim-ited effect on power consumption in comparison with the overall power drawn by servers. Since an idle server consumes up to half of the maximal server power, the power propor-tionality needs to be considered as an important issue for energy consumption.
2.3.2
Energy proportionality
When certain electronic components enter an idle state, Dynamic Power Management (DPM) exploits this period and turns off these components to an inactive state in order to reduce energy consumption. ACPI (Advanced Configuration and Power Interface [Ind]) specification provides an open standard which can be used to perform power management of hardware components. It enables the server to switch its unused components such as
processor physical cores and Ethernet cards to sleep-mode.
If the server is able to be switched-on/off dynamically, the effect on reducing power consumption will be more obvious. Vary-on/vary-off (VOVO) policy reduces the aggregate-power consumption of a server cluster during periods of reduced workload. The VOVO policy switches-off servers so that only the minimum number of servers that can support the workload are kept alive. Yet, much of the applications, such as web applications, running in a data center must be online constantly.
Lin et al. adopt DPM schema in [Lin+13]. They consider that the servers are homoge-neous in data center and a discrete-time model. The operating costs and switching costs are both taken into account for optimizing the data center energy consumption. The operation costs model the cost incurred by an active server and the switching costs represent the cost to toggle a server into/out sleep mode. The authors propose an online algorithm called Lazy Capacity Provisioning" (LCP) to dynamically adjust the number of active servers to meet the current system requirements. The results show that LCP guarantees that the cost is not larger than 3 times more than the optimal solution and LCP algorithm is proved as 3-competitive (i.e., an algorithm is n-3-competitive means that the cost of algorithm is less than n times of the cost of optimal offline solution).
Gandhi et al. [Gan+09] investigate the problem of finding the optimal power allocation for a server farm so as to get maximum performance with a fixed power budget, by using the optimal frequencies of servers. The authors employed DFS (Dynamic Frequency Scaling), DVFS (Dynamic Voltage and Frequency Scaling) and DVFS+DFS for various workloads to measure the effects of CPU frequency scaling on power consumption of a single server. The experimental results show that the power-to-frequency relationship is linear for DFS and DVFS when the workload is CPU bound and a memory bound workload is usually cubic and the relationship for DVFS+DFS is always cubic. Meanwhile, the arrival rate, the max-imum speed of a server, the total power budget also affect the the mean response time for a server farm. They propose a queuing theoretic model to predict the mean response time that is used to determine the optimal power allocation. In their later work, they propose a class of Distributed and Robust Auto-Scaling (DRAS) policies to optimize power manage-ment for computationally intensive server farms. DRAS policies aim to lower the power consumption and to maintain a near-optimal response time. The key idea of DRAS policies consists in dynamically adjusting the server farm capacity to meet the incoming demand. The experimentation uses Intel’s LINPACK [Cor] workload and a 20-servers test-bed. The results show that waiting for some time (with the best settings in DRAS) before turning-on and off servers can reduce power consumption by as much as 30% while increasing by 4% the response time.
Niyato et al. [NCS09] propose an optimal power management (OPM) of a batch sched-uler for an individual server farm. The OPM aims to minimize the power consumption of the server while meeting the performance requirement. It observes the state of a server and dynamically switches the operation mode of the server (i.e., active or sleep) in order to re-duce power consumption. The optimization problem of OPM is formulated as a constrained Markov decision process (CMDP) and solved by transforming it into a Linear Programming (LP) problem. The authors also study the problem of job assignment to multiple server farms, ensuring the power consumption and network costs are minimized. The numerical results show that with OPM, the performance in terms of job waiting time and job blocking probability are met while the power consumption is minimized. However, although dy-namic switching on and off unused server can further reduce the energy consumption, such operations may bring several inconveniences.
Besides, Orgerie et al. [OLG08] point out that if the interval between two operations (i.e., switch on and off) is too short, this kind of operations becomes unnecessary and should be
avoided. They propose the Energy Aware Reservation Infrastructure (EARI) framework that alternatively switches on and off servers in a clever way. Similar approaches can be found in the mobile computing community [BBDM99; Che+07; KR07] where in order to reduce energy consumption a server can be left purposely idle for a bit of time before turning it off, thus avoiding some unnecessary operations (i.e. re-turn on or off).
Finally, Villebonnet et al. [Vil+14; Vil+15] propose a platform including two different physical architectures (i.e. ARM and x86) in order to archive better energy proportional-ity. Their purpose is to select the most suitable architecture to execute the application taking into account the hardware’s energy consumption. Particularly, the x86 architecture is more powerful than ARM, it is usually used to execute the applications which have higher re-quirements on performance. In contrast, the ARM processor Cortex-A15 is much less pow-erful compared with x86 processor, but its energy consumption is pretty low. Thus, once the performance demand of application is reduced, the applications can be migrated to the ARM architecture to save energy.
2.3.3
Virtualized Infrastructure for Cloud Computing
The technique of virtualization has fast become a fundamental technology in cloud data centers. Relying on virtualization technology, a physical machine (PM) can be disaggregated in many virtual machines (VMs). In other words, it enables to run multiple operating sys-tems on a single server. Each operating system is running inside a virtual machine which contains part of the server resources. Virtualization can reduce the energy consumption of data center - less servers to host, less cooling to pay for, and higher energy efficiency. In an Infrastructure as a Service (IaaS) cloud, the server allocates amounts of resources to a VM at creation time and these amounts can be expressed with relative values (i.e. a fraction of the capacity of CPU/RAM and etc.)
Packing heuristics
To save energy in a single data center, a common goal is to reduce the number of powered-on PMs (ON PMs). In cloud computing, each job has a size that is represented by virtual machine’s resource requirements. A job is assigned to run on a server. Each PM has a fixed resource capacity and the sum of actual resource requirements of all VMs on a server can-not exceed its capacity. A reasonable VM placement algorithm can effectively use server resources and reduce the number of used servers. e.g., More VMs can be placed on a single server than before. The VM placement problem is typically modeled as a n-dimensional bin-packing problem. The n represents the number of needed constraints.
free bin1 bin2 bin3 Length Height
Figure 2.9 – Traditional 2-dimensional bin packing vm1 vm2 free vm3 CPU R AM
Figure 2.10 – VM 2-dimensional (CPU/RAM constraints) Parking Problem
As shown in Figure2.9, a classic 2-dimensional bin packing problem can be seen as: how to place more bins with different sizes into a box with a fix size. Figure2.10demonstrates the difference between the classic 2-dimensional bin packing problem and VM packing problem. First, the global objective of both is to place as more bins as possible into the box. Then, in 2-dimensional bin-packing problem, the size of each bin is represented by the area of a rectangle. The problem becomes to minimize the remaining area of box (the green part). In VM packing problem, it takes into account for the side length of each rectangle (VM) instead of area, the sum of sides of all the rectangles can not exceed the length of box.
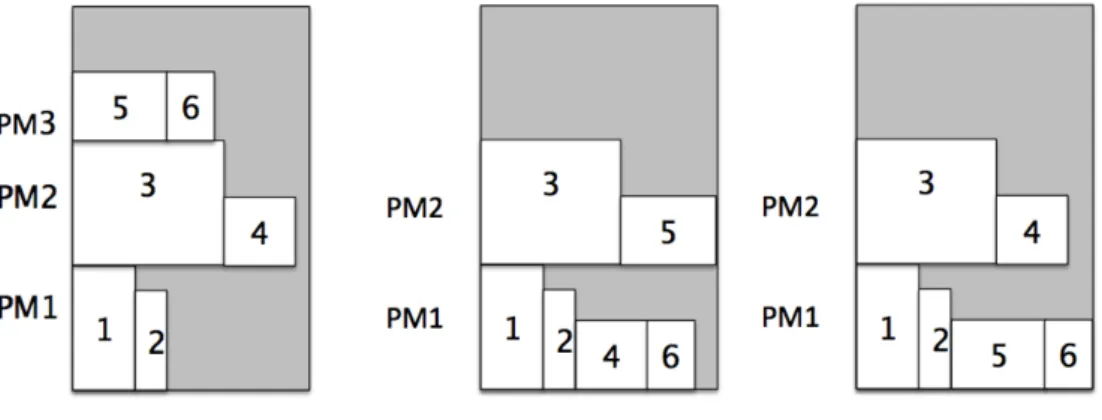
Hereafter, we list three classical heuristic algorithms to deal with the VM packing prob-lem which consider a sorted list of PMs:
— First-Fit (FF): the FF approach is allocating to the first server portion which can accom-modate the job resource requirements. FF finishes after finding the first suitable free portion. For allocating each job to a server, it begins to search from the first element of list.
— Next-Fit (NF): NF is a modified version of FF. It begins as FF to seek a free portion. When NF is called the next time, it starts searching from a server in the list from the previous allocation position, instead of searching from the beginning of list as FF. — Best-Fit (BF): the BF deals with allocating the smallest free portion which meets the
requirement of the job. This algorithm first searches the entire list of free portions and considers the smallest portion that is adequate. It then tries to find a portion which is close to actual job resources requirements.
Figure 2.11 – Next-fit, First-fit, Best-fit
These three heuristics are illustrated on Figure2.11. The classic bin packing problem aims to place a fix amount of items into a minimum number of bins. As mentioned in [CK99], the classic bin packing (BP) problem is proved to be an NP-hard problem. An online BP is different compared to an offline BP problem, it does not have any knowledge of subsequent items when it places an item. Usually, The competitive ratio [BEY05] is used for measuring the performance of online algorithms. It represents the ratio between the result of worst-case and optimal solutions.
Dynamic bin packing (DBP) is a branch of the classical bin packing problem. It assumes the items may arrive and leave at any time. An item is assigned upon arrival and it cannot move from one bin to another after it has been assigned. Li et al. [LTC14; LTC16] analyze the competitive ratios of Best fit and First fit scheduling algorithms. The authors prove that the competitive ratio of Best fit packing is not bounded for any µ where µ is the ratio of the maximum duration of an item to the minimum duration of an item. For first fit packing, it has a competitive ratio bounded above by 2µ + 7. In particular, their works indicate that First fit packing can achieve a better upper bound of β−1β · µ + β−13β + 1on competitive ratio while all the item sizes are strictly smaller than β1 of the bin capacity (β > 1 is a constant).
Ren et al. [Ren+16] prove Next fit packing has an upper bound 2µ + 1 on the competitive ratio and a new upper bound µ + 3 of First fit packing. Obviously, the First fit packing is better than Next fit packing when µ > 2. The authors also indicate First Fit packing is near optimal for the DBP problem.
It is difficult to find an online solution which can always ensure that the result is optimal or near optimal. An alternative choice consists in using the existing heuristics (described above) to solve this kind of problems. Although it cannot always offer a perfect and stable performance, these greedy heuristics are simple and efficient features are often applied to online algorithms.
Meng et al. [Men+10] leverage VM multiplexing to improve resource utilization in cloud. The authors introduce an SLA model and a joint-VM sizing algorithm to calculate the capac-ity needs for consolidating VMs. A VM selection algorithm is proposed to find the VMs with the most compatible demand patterns. The selection algorithm first builds a correlation ma-trix [DHS12] for a set of VMs based on the historical or demand behavior of each VM. Then, the correlations are used as indicators for distinguishing the compatibility among VMs. The principle of VM multiplexing is used to consolidate the VMs to increase the resources uti-lization when the utiuti-lization of VMs are temporally unaligned. The results show that these solutions improve more than 45% resource utilization.
Khosravi et al [KGB13] investigate the problem of VM placement to reduce computing energy consumption and carbon footprint. The authors propose energy and carbon-efficient (ECE) architecture which is based on distributed data centers. The different locations of distributed data centers have different carbon footprint rates and PUE values. The proposed centralized-based global broker places each VM request in the most suitable data center with taking into account energy efficiency and carbon footprint parameters. Simulation results show that ECE saves between 10% and 45% of carbon footprint compared to three other heuristics.
As multiple-dimensional bin-packing problem is NP-hard problem, genetic algorithms (GA) based on evolutionary theory can been adopted as a way for addressing the VM place-ment optimization problem. Tang et al [Wu+12; TP15] propose a hybrid genetic algorithm (HGA) for the energy-efficient VM placement problem. The HGA extends the GA, it uses a repairing procedure to migrate the VMs from the current server to other servers until all the constraint violations are resolved. Meanwhile, a local optimization procedure is designed in the HGA to accelerate the convergence speed. Compared with the original GA, the re-sults show that HGA has better exploitation capacity and convergence speed. Similarly, Wang et al [WWZ12] use a modified genetic algorithm to solve the energy-efficient multi-job scheduling problem.
Making advantage of live migration
Placing several VMs on a single PM can provide better use of PM resources. Consolidat-ing VMs to fewer PMs enables to switch off some underutilized servers. Clark et al. propose to employ live migration of VM [Cla+05] as it allows to migrate a running VM from one PM to another and guarantees that VM performance does not degrade excessively during the mi-gration. The principle of live migration is to transfer the VM’s memory state from the source PM to the destination PM without stopping the execution of VM in pre-copy way [TLC85]. The memory pages are iteratively copied to the destination PM, a set of pages which is mod-ified frequently is called dirty pages. Thereby, the VM has to be paused for a short time while copying all the dirty pages to the destination. Then the VM is resumed on the destination side.
1. Push phase: the VM on the source PM keeps running and the memory pages are repeatedly copied to the destination over the network. The dirty pages must be re-transferred iteratively during this phase.
2. Stop-and-copy phase: the source VM is stopped and the CPU state and any remaining memory pages are transferred to the destination, then the destination VM is executed. 3. Pull phase: if the destination VM found that it misses any memory pages, the source
VM then transfers these missing pages.
As shown in Figure 2.12, Deshpande et al proposed a system for parallel live migration of multiple VMs across racks. The system exploits deduplication of VMs’ memory images during multiple VM migrations in order to reduce the amount of data transferred over the network, thus saving energy. The results show that this system can reduce by up to 44% the network traffic load and by 27% the total migration time in comparison with the default live migration technique in QEMU/KVM.
Figure 2.12 – Architecture of inter-rack live migration [DKG12].
The electricity price vary over time and across different locations, several prior stud-ies [Liu+15; Rao+12; Yao+12; Guo+11; Pol+14; XL12] explore the opportunity of schedul-ing the jobs in multiple geographically distributed data centers. Polverini et al. [Pol+14] proposed a provably-efficient online algorithm which migrates computation across the geo-graphical locations and employs real-time electricity prices.
Since in Cloud environments, each job has different arrival time and lifetime, the static VM placement algorithm is no more satisfying for the dynamicity of the system. It necessi-tates adequate optimization operations to adjust the number of ON PMs in the current sys-tem. The dynamic VM consolidation techniques have now been widely employed in mod-ern data centers as they enable the data center to decrease the number of ON PMs [OAaL14]. As shown in [LWW07;FWB07;MGW09], an idle or underutilized server consumes nearly 50% of total server power. The study [BH07] shows that the average utilization of servers in data center are roughly between 10% and 50%. It is crucial to reduce the number of un-derutilized or idle servers to improve the data center energy-efficiency. On the purpose of switching-off several underutilized servers, the cloud resource manager needs to consoli-date the workload into less servers.
Hermenier et al propose a constraint-programming based approach [Her+09], called En-tropy, for consolidation for homogeneous clusters. Entropy mainly focus on solving the problem of VM placement and the problem of VM migration to reduce the use of physical machines. Entropy first computes a placement plan which aims at optimizing the number
of used physical machines. It then takes into account the migration overhead for consolida-tion to improve the plan and check the plan’s feasibility, where the number of migraconsolida-tions required is decreased. The two phases are based on constraint solving [RVBW06; BJO13]. The first phase takes into account the VM CPU and RAM constraints and the second phase is based on sequential constraints and cyclic constraints. Their results show that Entropy can reduce by 50% the energy consumption of clusters as compared to static allocation.
Verma et al [Ver+09] analyze the server workload from a large data center. A number of characteristics relevant for semi-static (days, weeks) and static (monthly, yearly) consolida-tion is investigated. The study shows that there is a significant potential for energy savings if consolidation uses off-peak metrics for applications demand. The authors indicate that there is a strong correlation between applications and different hosted servers. The pro-posed correlation-aware consolidation method Peak Clustering based Placement (PCP) that takes into account the off-peak metrics can achieve energy savings and low SLA violation across powered-on servers.
Beloglazov et al [BB10a] propose an adaptive threshold-based dynamic server consol-idation framework to ensure a high level of meeting the SLA. T-distribution is used for modeling the distribution of the server’s utilization. Using statistical analysis of the histor-ical data collected from each VM and the inverse cumulative probability function for the t-distribution enables the framework to auto-adjust the upper and lower utilization thresh-olds for each server. The idea of setting the lower utilization threshold is to migrate some VMs to other servers and switch-off the under-utilized server when the server’s utilization lower threshold is violated. If the server utilization exceeds the upper threshold, some VMs are migrated from the server to others to avoid potential SLA violation. The VM placement problem is modeled as bin packing and exploit a Modification of the Best Fit Decreasing (MBFD) algorithm in order to solve the problem. The experimental results demonstrate that the proposed technique can reduce energy consumption and maintain the level of SLA violation < 1%.
Chaisiri et al [CLN09] assume that every cloud provider offers two payment plans (i.e., reservation and on-demand plans) for users. Initially, the price in reservation plan is cheaper than on-demand plan. If the amount of reserved computational resources is not sufficient to meet the real-time demand, the user can buy additional resources in on-demand plan. The problem is formulated as a stochastic integer programming (SIP) to optimize the trade-off between the two plans and to minimize the number of used servers. The proposed VM placement algorithm solves SIP with two-stage recourse. Speitkamp and Bichler et al [BSS06;
SB10] investigate the problem of server consolidation on using linear programming (LP) for-mulations. The authors formulate the problem as Static Server Allocation Problem (SSAP) and prove SSAP is strongly NP-hard. They propose SSAPv (i.e., v = with variable work-load) model and design extension constraints for allocating VMs onto a set of servers, that ensures each VM is assigned to a target server without exceeding server’s capacity and lim-iting the number of migrations so as to minimize the server cost. As NP-hard is hard to solve in polynomial-time, they propose an LP-relaxation-based heuristic to solve the linear programming formulations.
Meta-heuristics
Meta-heuristics have also been employed to solve the energy-efficient VM placement problem. Feller et al [FRM11] propose a dynamic workload placement algorithm based on the Ant Colony Optimization (ACO) meta-heuristic, to solve the workload consolidation problem. In their study, the VM placement problem is modeled as a multi-dimensional bin-packing (MDBP) problem. They propose a probabilistic decision rule that is used to guide
the ants choice towards the optimal solution. In each iteration of ACO, the ant chooses the VM with highest amount of pheromone and an heuristic information is employed to place the VM on the current server.
Pacini et al propose a particle swarm optimization (PSO) [PMGG14] scheduler to allocate VMs to servers under the IaaS model. In PSO approach, a VM is seen as a bee and a server corresponds to a space in a field of flowers. The density of flowers in the field represents the load that refers to total CPU utilization of servers (e.g. a lower density of flowers means that this server has more available resources). The results demonstrates that the PSO scheduler yields a better balance between throughput and response time than some simpler policies such as random policy. It also requires higher CPU, RAM and network usages in PSO thus leading to higher demands for energy. In addition, the authors also investigate the perfor-mance in terms of serviced users and created VMs when using the priority-based policy at the VM-level.
Over-commit resources technology
The above proposals investigate the bin packing problem to save energy by switching off unused resources. Another recognized reason of wasting the server resources (e.g., CPU and RAM) is due to lower VM resource utilization. Recent studies show that data center servers’ average utilization are between 10% and 50%. As mentioned in [BH07], an idle or underutilized server consumes nearly 50% of total server power. A classical approach consists in running a fix amount of jobs using less servers thus optimizing the energy con-sumption of the data center. The resource over-commitment technique can directly increase the resource utilization of servers to optimize their energy-efficiency. Over-commit resource technique allows the broker to allocate VMs with a total configured resources, such as CPU and RAM, to the servers that exceeds their actual capacities. It allows servers to place more VMs than permitted. Consequently, it increases these servers’ resource utilization and re-duces the number of powered-on servers. However, over-commit resources technique may lead to servers overloading. Because the resource requirement of VMs placed on the server exceeds the server’s available capacity, the VMs actual resource utilization varies with time and potentially increases the risk of server overloading. As a result of server overloading, it implies performance degradation of the VMs which are executing on this server. The over-loading servers then need to migrate some of their VMs to other underutilized servers. The more the resource requirement of VM exceed the servers’ capacity, the larger the probability of overloading. Further, it potentially increases the number of VM migrations that leads to an additional energy overhead.
In [Zha+12], Zhang et al. propose an online migration algorithm, called Scattered, to minimize migrations in the context of over-committed cloud environments. When a server is overload due to an aggressive resource over-commitment, Scattered measures the corre-lation between VMs and selects the best VM to migrate to the appropriate target server. The simulation results show that Scattered can maximize the number of over-committed VMs and reduce the number of migrations.
Ghosh et al. [GN12] study the risks associated with over-commit resources techniques. The authors present a statistical approach to quantify the risk of server overloading due to the fact that the VMs exceeded the capacity of allocated server. They determine the pre-dicted upper bound on aggregate utilization by leveraging the one-sided upper tolerance limit [Gor+11]. The risk of exceeding server’s capacity is then defined as the relative differ-ence between the predicted upper bound and the set threshold (i.e., the value of empirical probability).
![Figure 2.2 – Typical breakdown of the data center energy consumption (data from [SBD07]) server power efficiency drops dramatically when its utilization decreases [OAaL14]](https://thumb-eu.123doks.com/thumbv2/123doknet/14590586.730087/22.892.266.743.105.470/figure-typical-breakdown-consumption-efficiency-dramatically-utilization-decreases.webp)
![Figure 2.5 – Total U.S. Data Center Storage Installed Base in Capacity (data from [She+16])](https://thumb-eu.123doks.com/thumbv2/123doknet/14590586.730087/23.892.159.747.490.754/figure-total-data-center-storage-installed-base-capacity.webp)
![Figure 2.6 – Total U.S. Data Center Storage Electricity Consumption (data from [She+16]) The power consumption of network equipment is estimated by network port with dif-ferent port speed [She+16]](https://thumb-eu.123doks.com/thumbv2/123doknet/14590586.730087/24.892.234.654.198.446/figure-center-storage-electricity-consumption-consumption-equipment-estimated.webp)
![Figure 2.8 – Total Data Center Electricity Consumption (data from [She+16])](https://thumb-eu.123doks.com/thumbv2/123doknet/14590586.730087/25.892.233.650.86.350/figure-total-data-center-electricity-consumption-data.webp)
![Figure 2.12 – Architecture of inter-rack live migration [DKG12].](https://thumb-eu.123doks.com/thumbv2/123doknet/14590586.730087/32.892.253.654.422.675/figure-architecture-inter-rack-live-migration-dkg.webp)