HAL Id: tel-03145374
https://tel.archives-ouvertes.fr/tel-03145374
Submitted on 18 Feb 2021HAL is a multi-disciplinary open access
archive for the deposit and dissemination of sci-entific research documents, whether they are pub-lished or not. The documents may come from teaching and research institutions in France or abroad, or from public or private research centers.
L’archive ouverte pluridisciplinaire HAL, est destinée au dépôt et à la diffusion de documents scientifiques de niveau recherche, publiés ou non, émanant des établissements d’enseignement et de recherche français ou étrangers, des laboratoires publics ou privés.
Weizhu Qian
To cite this version:
Weizhu Qian. Discovering human mobility from mobile data : probabilistic models and learning algo-rithms. Other [cs.OH]. Université Bourgogne Franche-Comté, 2020. English. �NNT : 2020UBFCA025�. �tel-03145374�
´
Ecole doctorale n°37
Sciences Pour l’Ing ´enieur et Microtechniques
Doctorat d’Informatique
par
WEIZHU
QIAN
Discovering Human Mobility from Mobile Data: Probabilistic Models and
Learning Algorithms
Th `ese pr ´esent ´ee et soutenue `a Belfort, le 7 d ´ecembre 2020
Composition du Jury :
SIDI-MOHAMMEDSENOUCI Professeur `a Universit ´e de Bourgogne Pr ´esident GERMAINFORESTIER Professeur `a Universit ´e de Haute Alsace Rapporteur YACINEOUZROUT Professeur `a Universit ´e Lumi `ere Lyon 2 Rapporteur YE-QIONGSONG Professeur `a Universit ´e de Lorraine Examinateur FABRICELAURI MCF `a Universit ´e de Technologie de Belfort
Montb ´eliard, UBFC
Examinateur FRANCKGECHTER MCF-HDR `a Universit ´e de Technologie de
Belfort Montb ´eliar, UBFC
Directeur de th `ese
Universit ´e Bourgogne Franche-Comt ´e 32, avenue de l’Observatoire 25000 Besanc¸on, France
Title: Discovering Human Mobility from Mobile Data: Probabilistic Models and Learning Algorithms Keywords: Machine Learning, Deep Learning, Probabilistic Models, Variational Inference, Mobile Data
Abstract:
Smartphone usage data can be used to study human indoor and outdoor mobility. In our work, we investigate both aspects in proposing machine learning-based algorithms adapted to the different information sources that can be collected. In terms of outdoor mobility, we use the collected GPS coordinate data to discover the daily mobility patterns of the users. To this end, we propose an automatic clustering algorithm using the Dirichlet Process Gaussian Mixture Model (DPGMM) so as to cluster the daily GPS trajectories. This clustering method is based on estimating probability densities of the trajectories, which alleviate the problems caused by the data noise. By contrast, we utilize the collected WiFi fingerprint data to study indoor human mobility. In order to predict the indoor user location at the next time points, we devise a hybrid deep learning model, called the Convolutional Mixture Density Recurrent Neural Network (CMDRNN), which combines the advantages of different multiple deep neural networks. Moreover, as for accurate
indoor location recognition, we presume that there exists a latent distribution governing the input and output at the same time. Based on this assumption, we develop a Variational Autoencoder (VAE)-based semi-supervised learning model. In the unsupervised learning procedure, we employ a VAE model to learn a latent distribution of the input, the WiFi fingerprint data. In the supervised learning procedure, we use a neural network to compute the target, the user coordinates. Furthermore, based on the same assumption used in the VAE-based semi-supervised learning model, we leverage the Information Bottleneck theory to devise a Variational Information Bottleneck (VIB)-based model. This is an end-to-end deep learning model which is easier to train and has better performance. Finally, we validate these proposed methods on several public real-world datasets providing the results that verify the efficiencies of our methods as compared to other existing methods generally used.
Titre : Discovering Human Mobility from Mobile Data: Probabilistic Models and Learning Algorithms Mots-cl ´es : Machine Learning, Deep Learning, Probabilistic Models, Variational Inference, Mobile Data
R ´esum ´e :
Les donn ´ees d’utilisation des smartphones peuvent ˆetre utilis ´ees pour ´etudier la mobilit ´e humaine que ce soit en environnement ext ´erieur ouvert ou `a l’int ´erieur de b ˆatiments. Dans ce travail, nous ´etudions ces deux aspects de la mobilit ´e humaine en proposant des algorithmes de machine learning adapt ´e aux sources d’information disponibles dans chacun des contextes. Pour l’ ´etude de la mobilit ´e en environnement ext ´erieur, nous utilisons les donn ´ees de coordonn ´ees GPS collect ´ees pour d ´ecouvrir les sch ´emas de mobilit ´e quotidiens des utilisateurs. Pour cela, nous proposons un algorithme de clustering automatique utilisant le Dirichlet process Gaussian Mixture Model (DPGMM) afin de regrouper les trajectoires GPS quotidiennes. Cette m ´ethode de segmentation est bas ´ee sur l’estimation des densit ´es de probabilit ´e des trajectoires, ce qui att ´enue les probl `emes caus ´es par le bruit des donn ´ees. Concernant l’ ´etude de la mobilit ´e humaine dans les b ˆatiments, nous utilisons les donn ´ees d’empreintes digitales WiFi collect ´ees par les smartphones. Afin de pr ´edire la trajectoire d’un individu `a l’int ´erieur d’un b ˆatiment, nous avons conc¸u un mod `ele hybride d’apprentissage profond, appel ´e le Convolutional Mixture Density Recurrent Neural Network (CMDRNN), qui combine les avantages de
diff ´erents r ´eseaux de neurones profonds multiples. De plus, en ce qui concerne la localisation pr ´ecise en int ´erieur, nous supposons qu’il existe une distribution latente r ´egissant l’entr ´ee et la sortie en m ˆeme temps. Sur la base de cette hypoth `ese, nous avons d ´evelopp ´e un mod `ele d’apprentissage semi-supervis ´e bas ´e sur le Variational Autoencoder (VAE). Dans la proc ´edure d’apprentissage non supervis ´e, nous utilisons un mod `ele VAE pour apprendre une distribution latente de l’entr ´ee qui est compos ´ee de donn ´ees d’empreintes digitales WiFi. Dans la proc ´edure d’apprentissage supervis ´e, nous utilisons un r ´eseau de neurones pour calculer la cible, coordonn ´ees par l’utilisateur. De plus, sur la base de la m ˆeme hypoth `ese utilis ´ee dans le mod `ele d’apprentissage semi-supervis ´e bas ´e sur le VAE, nous exploitons la th ´eorie des goulots d’ ´etranglement de l’information pour concevoir un mod `ele bas ´e sur le Variational Information Bottleneck (VIB). Il s’agit d’un mod `ele d’apprentissage en profondeur de bout en bout plus facile `a former et offrant de meilleures performances. Enfin, les m ´ethodes propos ´ees ont ´et ´e valid ´ees sur plusieurs jeux de donn ´ees publics acquis en situation r ´eelle. Les r ´esultats obtenus ont permis de v ´erifier l’efficacit ´e de nos m ´ethodes par rapport `a l’existant.
This thesis would not have been possible without the guidance, insight and encourage-ment of my PhD advisor, Dr. Franck Gechter. Therefore I would like first to thank Dr. Franck Gechter for his efforts during my pursuit of PhD. I would like to thank Dr. Fabrice Lauri for his suggestions to my work. Also, many thanks for other colleges, the secretary of the computer science department, the secretary of CIAD, the secretary of PhD student office and other staffs working at CIAD and UTBM. I also would thank for the reviewers who are willing to spend their time to provide their valuable suggestions about my thesis.
I would like to thank Dr. Bowei Chen at University of Glasgow. It is a great time for me to work and discus scientific problems with him. I would like thank my land lord, Mr. Marc Stori. He had always been very kind and helpful to me. I also would like to thank the PhD students working together at UTBM, Chen Liu, Jian Zhang, Yong Shi, Tao Yang, Rongrong Liu, Hailong Wu, Hanqing Wang, Yang Zhou and many other students. We had a great time together in France, which prevent me being consumed by work completely. Some of them already graduated and I wish them all have a bright future. Thank other friends I met in France for their help for my work and life during the last three years.
Finally, I would like to thank my friends in China and my family for their long-time support and encouragement. Especially, I want to thank my mother for all her efforts to raise and educate me.
1 Introduction 1
1.1 Context . . . 1
1.2 Main Issues of the Thesis . . . 3
1.2.1 Discovering Daily Mobility Patterns from GPS data . . . 3
1.2.2 WiFi Fingerprint-based Location Prediction . . . 4
1.2.3 WiFi Fingerprint-based Location Recognition . . . 6
1.3 Main Contributions of the Thesis . . . 7
1.3.1 DPGMM-based Clustering Algorithm . . . 7
1.3.2 CMDRNN for Sequential Location Prediction . . . 8
1.3.3 VAE-based Model for Location Recognition . . . 9
1.3.4 VIB-based Model for Location Recognition . . . 9
1.4 Thesis Organization . . . 10
2 State of the Art 11 2.1 Discovering User Mobility Patterns from GPS Data . . . 11
2.1.1 Discovering Frequently Visited Places . . . 12
2.1.2 Clustering GPS Trajectories . . . 15
2.2 Predicting Next User Location . . . 16
2.2.1 Machine Learning-based Prediction Methods . . . 17
2.2.2 Deep Learning-based Prediction Methods . . . 20
2.3 Indoor User Location Recognition . . . 21
2.3.1 Classification-based Location Recognition . . . 21
2.3.2 Accurate Location Recognition . . . 23
3 Discovering Daily Outdoor Mobility Patterns 31 3.1 Introduction . . . 31
3.2 Method . . . 33
3.2.1 Probability Estimation . . . 33
3.2.1.1 Gaussian Mixture Models . . . 34
3.2.1.2 Dirichlet Process Gaussian Mixture Model . . . 35
3.2.2 Computing KL Divergence . . . 37
3.2.3 DPGMM-based Trajectory Clustering Algorithm . . . 38
3.3 Experiments and Results . . . 41
3.3.1 Dataset Description . . . 41
3.3.2 Experimental Setup . . . 41
3.3.3 Task 1: Probability Density Estimation . . . 44
3.3.4 Task 2: Measuring Daily Trajectories Similarities . . . 45
3.3.5 Task 3: Discovering Daily Mobility Patterns . . . 48
3.3.5.1 Discovered Patterns . . . 48
3.3.5.2 Number of Patterns and Trajectories . . . 51
3.3.5.3 Number of members for each patterns . . . 51
3.3.6 Task 4: Comparison to other Models . . . 52
3.3.7 Task 5: Varying Data Lengths . . . 53
3.4 Conclusion . . . 53
4 Predicting Indoor Location with WiFi Fingerprints 55 4.1 Introduction . . . 55
4.2 Method . . . 56
4.2.1.1 1D Convolutional Neural Network . . . 56
4.2.2 Recurrent Neural Network . . . 57
4.2.2.1 Vanilla RNN . . . 58
4.2.2.2 LSTM . . . 58
4.2.2.3 GRU . . . 60
4.2.3 Mixture Density Network . . . 61
4.2.4 Convolutional Mixture Density Recurrent Neural Network . . . 63
4.2.5 Optimizers . . . 65
4.2.5.1 Adam . . . 65
4.2.5.2 RMSProp . . . 66
4.3 Experiments and Results . . . 66
4.3.1 Dataset Description . . . 66
4.3.2 Model Implementation Details . . . 67
4.3.3 Choice of Hypermeters . . . 67
4.3.4 Comparisons with Other Methods . . . 70
4.4 Conclusion . . . 73
5 Recognizing Indoor Location via Semi-supervised Learning 75 5.1 Introduction . . . 75
5.2 Method . . . 76
5.2.1 Model Setup . . . 77
5.2.2 Unsupervised Learning Procedure . . . 78
5.2.2.1 Evidence Lower Bound of VAEs . . . 79
5.2.2.2 Learning Method of VAEs . . . 80
5.2.3 Supervised Learning Procedure . . . 81
5.2.3.2 Probabilistic Predictor (M2 Model) . . . 82
5.3 Experiments and Results . . . 85
5.3.1 Dataset Description . . . 85
5.3.2 Model Implementation Details . . . 85
5.3.3 Results . . . 87
5.4 Conclusion . . . 90
6 Recognizing Indoor Location via End-to-End Learning 91 6.1 Introduction . . . 91 6.2 Method . . . 92 6.2.1 Model Setup . . . 92 6.2.2 Model . . . 93 6.2.2.1 Variational Approximation . . . 95 6.2.2.2 Solving Model . . . 97 6.2.2.3 Predicting . . . 98 6.3 Experimental Results . . . 99 6.3.1 Dataset Description . . . 99
6.3.2 Model Implementation Details . . . 99
6.3.3 Experiment 1 . . . 99
6.3.4 Experiment 2 . . . 104
6.3.5 Experiment 3 . . . 104
6.3.6 Discussion . . . 106
6.4 Conclusion . . . 106
7 Conclusions and Perspectives 109 7.1 Conclusions . . . 109
I
NTRODUCTION
1.1/
C
ONTEXTDiscovering human mobility using user data collected from smartphones has become a critical challenge especially in the recent similar context. Thanks to the recent advances in hardware and software technology, smartphone devices now integrated with various types of built-in sensors, such as cameras, accelerators, gyroscopes, Bluetooth, GPS modules and WiFi modules, etc., can offer various functions to users. Smartphone hand-sets are portable so that they can be used by their owners almost anytime and anywhere. For many people, smartphones have become important tools in their daily life. Conse-quently, the usage of smartphones reflects the daily life of the smartphone users as well. Therefore, some researchers attempt to take advantage of mobile data to study human behavior. Mobile data in this thesis is referring to smartphone usage data, including
making phone calls, texting, taking photos, listening to music, etc.
In recent years, Location-Based Service (LBS) [Schiller et al., 2004] has been an im-portant part of many applications, such as advertisement, social network and nav-igation. LBS is a type of technology that uses geographic information to provide users services. These services include health care, advertising, entertainment and indoor localization. Studying human mobility is essential for developing LBS applica-tions. In this thesis, we want to study human mobility in both outdoor and indoor en-vironment with mobile data. Hence, among all the aforementioned usage data, the location-related data attracts our attention the most. In literature, there are various types of data one can use for studying human mobility, such as GPS, WiFi and cell-IDs [Trevisani et al., 2004], [Bazzani et al., 2010], [Lin et al., 2005], [Zheng et al., 2008],
[Yavas¸ et al., 2005], [Su et al., 2000].
The Global Positioning System (GPS) is a satellite-based navigation system developed and owned by the United States, which can provide both geological and temporal informa-tion when users stay outdoors [Hofmann-Wellenhof et al., 2012]. The advantage of using GPS data is that it is more convenient than other indirect methods, such as cell-ID based methods and WiFi based methods which need further interpretation to acquire geological information. However, the drawback is that GPS modules do not work well in an indoor environment.
Fortunately, in recent decades, wireless networking technology has rapidly developed so we can consider WiFi-based localization techniques as an alternative. WiFi is a type of wireless networking technologies based on the IEEE 802.11 family of standards, which is used to local area networking and internet access [Gast, 2005]. When the WiFi module in a smartphone is turned on, it will automatically scan the WiFi access points (WAPs) near the device. Then, the WiFi scan list will show the Received Signal Strength Indicator (RSSI) values of each detected WAP. Normally, the RSSI values are lower as the WAP are farther from the device. Thank to this characteristic, we can localize the user position based on the corresponding RSSI values. The data obtained via such method is called
WiFi fingerprint data.
To acquire GPS and WiFi fingerprint data, researchers can resort to the crowd-sourcing technique [Brabham, 2013]. The crowd-sourcing technique, in the context of this thesis, is to use the help of voluntary smartphone users to collect a large scale of data from a large group of users. This kind of databases can also be regarded as Big Data. Usually, more data means more information. Hence, training models with more data results in better results.
In order to build a large database more easily, a widely used approach in previous research work is to launch a campaign by asking volunteers to install the ad hoc applications developed by researchers on their smartphone devices. Such appli-cations includes Mobile Data Challenge [Laurila et al., 2012], [Laurila et al., 2013], Device Analyzer [Wagner et al., 2013], [Wagner et al., 2014], UJIIndoor-Loc [Torres-Sospedra et al., 2014] and Tampere [Lohan et al., 2017b]. These kinds of applications usually are designed to record the smartphone device usage. By contrast with traditional data collecting methods, crowd-sourcing does not need stand-alone
devices, i.g., GPS devices, to record human behavior. Instead, the practitioners can take advantage of the built-in sensors to collect user behavior data so that the normal daily life of the user will not be affected. As a result, the obtained data are more reliable for reflecting real human behavior.
Finally, with the access to the GPS and WiFi fingerprint data collected from smartphone users, the main objective of this thesis is to discover human mobility from the data. To this end, we will propose several machine learning and deep learning based methods in our work.
1.2/
M
AINI
SSUES OF THET
HESISIn this thesis, the main goal is to discover the user mobility from the collected smartphone usage data. In order to have a comprehensive understanding of human mobility, we need to investigate both indoor and outdoor mobility of smartphone users. The data utilized in our work are GPS data and WiFi fingerprint data. When studying outdoor user mobility, using GPS data is more convenient though WiFi hotspots can be detected outdoors in some cases. As for studying indoor user mobility using WiFi fingerprint data is a feasible choice.
1.2.1/ DISCOVERING DAILYMOBILITY PATTERNS FROM GPS DATA
We want first to shed some light on the outdoor mobility of smartphone users. Because by doing this, we can have general knowledge of human mobility and behavior. In this work, in particular, we focus on discovering the daily mobility of the users. We believe that daily mobility can reflect life styles of smartphone users, which will help us to understand human behavior better. Nowadays, GPS modules are widely built in smartphone devices so as to provide the geographical location information for location-based services, such as navigation, advertisement and entertainment. Naturally, we can leverage these GPS modules to collect GPS data from smartphones in order to study human mobility.
In order to investigate daily activity patterns of people more thoroughly and precisely, we choose to resort to a considerable amount of GPS data enables us to study the human mobility at a large spatial and temporal scale. Thus for the GPS data-based method, we
want to analyze these patterns along a relatively long period (in our case, up to several months). Here daily mobility patterns refer to the most common trajectories users pass every day. Also, in order to make our method more convincing, we need to verify our method on sufficient user data. It means that we need to adopt a dataset collected from a number of different users. In our experiments, we take advantage of the Mobile Data Challenge (MDC) database [Laurila et al., 2012], [Laurila et al., 2013].
In this thesis, especially, we choose to study user mobility at the time slot of one day. It is because we argue that human mobility repeat daily, e.g., home → work place/school → home. In our work, we aim to discover mobility patterns in particular. Here,mobility pat-terns refer to the common trajectories used by users. Therefore, this can be regarded as
a clustering daily trajectories problem. We can apply some machine learning techniques to this issue. A trajectory here is a set of GPS data points recording the mobility of the
smartphone user during a certain time period. In this task, we do not treat these data points as sequences.
Moreover, we also should be aware of that the trajectories of users vary largely in space and time. For example, we may stay home on weekends and go to work on work days. Or on the way we go back to home, we may take a detour to go shopping. Consequently, these behaviors cause the uncertainty of human mobility. This issue will make some conventional clustering techniques, such as K-means, DBSCAN and Gaussian Mixture Models, unsuitable for this task.
By clustering user daily trajectories, we can understand human behavior, analyze people daily routines and activities, arrange better advertising strategies and analyze specific regions. In order to discover the daily mobility patterns, we propose a Dirichlet Process Gaussian Mixture Model-based model for clustering daily user GPS trajectories.
1.2.2/ WIFI FINGERPRINT-BASED LOCATION PREDICTION
Apart from the GPS data-based outdoor mobility problem, we also want to address the indoor user mobility issues by using smartphone usage data. However, the difficulty is that GPS modules are malfunctional when users stay indoor, thus we cannot use GPS data to model indoor user mobility.
ac-cess points are widely installed in modern buildings so as to provide Internet connection. And the signal strength of WiFi access points is related to the physical distance between the devices and the WiFi hotspots. Naturally, we can use this property for indoor localiza-tion.
In our work, we want to utilize WiFi fingerprint data for accurate location prediction. Here ”accurate” means that we will use the real user coordinates (which can be seen as the target of a regression task), instead of building IDs or floor IDs (which can be seen as the target of a classification task). More specifically, in our task, we want to do thelocation prediction task, which is to predict the next user location by using the WiFi fingerprint
at the current time point. This task can be treated as a time series prediction. The input of this problem is the WiFi fingerprints and the target is the real coordinates of users. They are both sequential data. The WiFi fingerprint-based time series applications can be used for the services such as indoor navigation and advertisement.
Predicting user next location with WiFi fingerprints is a tricky problem because the input data is not easy to process. First, generally, for the purpose of providing high quality Internet connection, public buildings, such as office building, school buildings and super malls, are equipped with a large number of WiFi hotspots. Nevertheless, this also leads to the high dimensionality problem, which make the models prone to be overfitting and hard to converge. Furthermore, WiFi the signal fluctuations is detrimental to the accuracy of WiFi-based positioning methods. Theses challenges require us to adopt some feature detection techniques to extract the useful information from the input data.
Moreover, the relationship between RSSI values and actual user location is not trivial. Es-pecially when the number of the WiFi access points and the amount of the data are large, using conventional machine learning methods is not easy to tune [Nowicki et al., 2017]. Thus a better approach is to utilize a model scalable enough, for example, a deep learn-ing model. Therefore, in order to tackle with the aforementioned problems, we resort to the advanced deep learning techniques, to propose a novel deep learning-based method in our work, which is called the Convolutional Mixture Density Recurrent Neural Network.
1.2.3/ WIFI FINGERPRINT-BASED LOCATION RECOGNITION
In this work, we want to improve the WiFi fingerprint-based method even further, which means interpreting the WiFi fingerprints into real user coordinates more accurately. We treat this problem as a high dimensional regression task whose learning targets are nu-merical values. This task can be supervised, which means the targets are learned directly from the input, or semi-supervised, which means the targets are learned from a repre-sentation of the input. Accordingly, this problem is named aslocation recognition in this
work.
To solve this problem, we can use some conventional machine learning models, such as k-nearest neighbours, Decision Trees and Random Forests, etc. These methods attempt to model the relationship between the input and the output directly. However, the modeling accuracies will be largely affected by the noise of the data. This issue remains the same even for some probabilistic models, such as Mixture Density Networks (MDNs), Gaussian Processes (GPs) and Bayesian Neural Networks (BNNs).
In order to address this issue, we find that both the input of the model, i.e., WiFi finger-prints, and the target of the model, i.e., the user coordinates, are related to the actual user location. Based on this idea, we can utilize a latent distribution to connect the input with the output instead of directly modeling the relationship between the input and the output. By doing so, we can obtain the useful information for learning the task from the original WiFi fingerprint data so as to circumvent the overfitting problem and improve the modeling accuracy.
We can use Generative Latent Variable Models (GLVMs) to implement our idea. In our approach, we use a encoder-decoder structure. We can either use a unsupervised deep learning model, for instance, a Variational Autoencoder (VAE), to do learn the latent repre-sentation first. Or we can use supervised deep learning model, for instance, a Variational Information Bottleneck (VIB), to proceed end-to-end learning.
Finally, we propose a Variational Autoencoder-based semi-supervised learning model for WiFi fingerprint-based accurate indoor positioning. Furthermore, we combine the Infor-mation Bottleneck method with Variational Inference to devise a new model, the Varia-tional Information Bottleneck model for WiFi fingerprint-based accurate indoor location recognition.
1.3/
M
AINC
ONTRIBUTIONS OF THET
HESISTo address the problems in last section, we propose several methods in this thesis. They are the Dirichlet Process Gaussian Mixture Model-based algorithm for clustering GPS tra-jectories, the Convolutional Mixture Density Recurrent Neural Network for sequential lo-cation prediction, the Variational Autoencoder-based semi-supervised model for lolo-cation recognition and the Variational Information Bottleneck-based model for location recogni-tion. The overview of our contributions in this thesis is exhibited in Fig. 1.1.
Figure 1.1: Overview of the thesis contributions.
1.3.1/ DPGMM-BASED CLUSTERING ALGORITHM
In order to discover daily mobility patterns, we can cluster daily GPS trajectories. How-ever,there are several issues when we try to cluster GPS data. One issue is that in some occasions the GPS modules do not function normally during the data collecting process,
for example, when the user is in a tunnel or stay indoor. Due to this, some part of the GPS data are missing, which cause the data sparsity problem. The other issue is that the GPS data are not distributed evenly space because the users stay in different places for different time periods. For instance, people stay at home or work places for longer time than in supermarkets.
For discovering daily mobility patterns, we propose a Dirichlet Process Gaussian Mixture Model (DPGMM)-based clustering method to cluster daily trajectories. This method has several advantages. First, this method adopts a probabilistic approach. It calculates the probability density of each trajectory and uses the Kullback-Leibler divergences as the clustering metrics instead of using the conventional Euclidean distance. By doing this, we can circumvent the data sparsity problem.
Furthermore, for estimating the probability densities more accurately, we use the Gaus-sian Mixture Model with a Dirichlet Process prior, this can avoid pre-defining the number of mixture models. Moreover, our algorithm is an automatic clustering algorithms, which means it does not need the prior knowledge of the cluster number.
1.3.2/ CMDRNN FOR SEQUENTIAL LOCATION PREDICTION
Since each element of the high dimensional features of the WiFi fingerprint data con-tributes equally (each element relates to one WiFi access point) to the user location in-formation, Principal Component Analysis (PCA), a kind of dimension reduction method, is not suitable for such tasks [Nowicki et al., 2017]. Instead, we can resort to deep learn-ing based techniques, for example, Autoencoders and Convolutional Neural Networks. In practice, we find that the Convolutional Neural Network outperforms the Autoencoder [Ibrahim et al., 2018].
Since the state transition information of the time-series data is implicit and the possible state space is very large, conventional approaches, such as Markov Models and Hidden Markov Models are not feasible for our tasks. Alternatively, we can use a deep learning model, such as a Recurrent Neural Network, to model the state transitions.
We also find that computing the user coordinates with a conventional neural network di-rectly will result in severe overfitting. To solve this problem, we employ a Mixture Density Network in our model. The Mixture Density Network uses a set of mixed Gaussian
dis-tributions to sample the final output rather than compute it directly like a deterministic function. We deploy a Mixture Density Network at the final output layer of our model, which make the proposed model a Maximum Likelihood Estimation (MLE) model.
Finally, in order to predict user next location with WiFi fingerprints, through combining the advantages of the aforementioned deep learning models, we propose a novel deep learning-based model, called the Convolutional Mixture Density Recurrent Neural Net-work (CMDRNN). The proposed model is an end-to-end model, which means that it can be trained straightforwardly.
1.3.3/ VAE-BASED MODEL FOR LOCATION RECOGNITION
In order to localize user location with WiFi fingerprint data, we design a semi-supervised learning model based on Variational Autoencoders (VAEs) [Kingma et al., 2014b]. Our approach consists of two learning procedures, the first learning procedure is unsuper-vised learning which is used to learn a latent representation of the input data. In this procedure, we make use of a Variational Autoencoder to achieve the learning task.
The second learning procedure is a supervised learning process aiming to calculating the final user coordinates. To this end, we devise two neural network predictors. One predictor is a deterministic model whose loss function is root mean squared error and the other predictor is a stochastic model whose loss function is the negative log-likelihood.
1.3.4/ VIB-BASED MODEL FORLOCATION RECOGNITION
We propose another deep learning model for accurate location recognition, which is called the Variational Information Bottleneck (VIB)-based model. This model combine the Infor-mation Bottleneck method and the Variational Inference. According to the InforInfor-mation Bottleneck theory, through learning a latent distribution, we can solely have the task-related information from the original data so as to alleviate the overfitting problem. How-ever, implementing the Information Bottleneck method via neural network directly is not easy. Therefore, we leverage Variational Inference to derive a variational lower bound as the optimization target.
as the representation of the input as well. But the difference is the VIB-based model is supervised learning model. Its advantage is that it does not need an unsupervised learning process to learn the latent representation. It is an end-to-end model and able to learn directly the latent representation of the input data during the supervised learning process. This make its training process more straightforward than the VAE-based semi-supervised model.
1.4/
T
HESISO
RGANIZATIONThe thesis includes 7 chapters and the remainder of the thesis is organized as follows:
Chapter 2: State of the Art. In this chapter, we review the previous work, both
GPS-based methods and WiFi-GPS-based methods in literature.
Chapter 3: Discovering Daily Outdoor Mobility Patterns. In this chapter, we present
the Dirichlet Process Gaussian Mixture Model-based algorithm for clustering daily GPS trajectory data to discover the outdoor mobility patterns of the users.
Chapter 4: Predicting Indoor Location with WiFi Fingerprints. In this chapter, we
in-troduce the Convolutional Mixture Density Recurrent Neural Network for predicting indoor next location.
Chapter 5: Recognizing Indoor Location via Semi-Supervised Learning. In this
chapter, we propose the Variational Autoencoder-based semi-supervised learning model for accurate user location recognition.
Chapter 6: Recognizing Indoor Location via End-to-End Learning. In this chapter, we
develop the Variational Information Bottleneck-based model to compute the user location.
Chapter 7: Conclusions and Perspectives. In this chapter, we draw the final
S
TATE OF THE
A
RT
In this chapter, we will review prior works using GPS data and WiFi fingerprint data to study human mobility. Generally, the problems in theses works can be framed as different types of learning tasks, for instance, clustering, classification, regression and sequential prediction. Accordingly, we can adopt some techniques, such as conventional machine learning (ML) methods and deep learning (DL) methods, to address these problems. Ma-chine learning [Bishop, 2006], [Murphy, 2012] is a class of algorithms that is used for data analysis, pattern recognition (PR), computer vision (CV), signal processing, natural lan-guage processing (NLP), etc. Thanks to the recent advances in hardware technology, computers are becoming more powerful and more adaptive to specific algorithms based on vectoral processing. Due to this reason, a group of machine learning algorithms, called deep learning [LeCun et al., 2015], [Goodfellow et al., 2016], has been rapidly de-veloped. Deep learning models have very powerful modeling ability because they can have very deep structures with multiple hidden layers. In this chapter, we will introduce both machine learning and deep learning approaches previously applied to discover hu-man mobility from mobile data.
2.1/
D
ISCOVERINGU
SERM
OBILITYP
ATTERNS FROMGPS D
ATAGPS data contains the information of latitudes and longitudes, which is able to directly provide relatively accurate the coordinates of users when users stay outdoors. Moreover, GPS data can record user mobility from a large range of space and time, which en-ables the researchers to unveil the human mobility patterns. Many previous researchers have developed various methods based on GPS data. In literature, previous research
such as [Lu et al., 2013], [Ye et al., 2012], [Lin et al., 2014], [Pirozmand et al., 2014], [Zheng, 2015] and [Cao et al., 2007], have studied human mobility by using GPS data collected form smartphone users. These works mainly focused on the tasks such as extracting significant visiting places, clustering trajectories, discovering travel sequences and so on.
2.1.1/ DISCOVERING FREQUENTLYVISITED PLACES
Through discovering frequently visited places, we can reveal how people behave in their daily life. To some extent, it can be seen as a task of clustering GPS data in our context. Clustering is a type of unsupervised learning approach with unlabeled data. The purpose of a clustering task is to separate datapoints into a number of different groups and the datapoints within the same groups share some kinds of similarities based on the distance metrics we choose.
In our study, the original GPS data collected from the users is not labeled semantically, thus practitioners need to label the raw data first, to find the frequently visited places, which can be regarded as a clustering task in some sense. Here, frequently visited places refer to the places where the users visit frequently and stay for a relatively long time period. For example, a frequently visited place can be someone’s home, his/her workplace or his/her school.
Figure 2.1: A GPS trajectory and a stay point.
represent the GPS data points and the shaded area, S , denotes the stay point which contains 4 GPS datapoints, p3∼ p6.
There are numerous machine learning methods which can be used for clustering GPS datapoints. For instance, K-means [Wu et al., 2008] is a widely used method for many clustering tasks. It measures the closeness between datapoints through calculating the
Euclidean distances. The main advantage of K-means is that it is computationally
effi-cient. But it cannot handle data with complex shapes and it is sensitive to noises because it uses Euclidean distances. If we want to find the frequently visited places, then we only care about the GPS data collected in the significant places and ignore the less important data. However, we cannot achieve this goal through using K-means because it cannot distinguish useful datapoints from noise datapoints. Moreover, it needs to set the clus-ter number properly in advance, otherwise the obtained result will not be as expected. However, we do not access to such prior knowledge in many cases.
One alternative is to use Gaussian Mixture Models (GMMs) [Reynolds, 2015]. GMMs are Probabilistic Graphical Models (PGMs). As opposed to K-means, in a GMM, each sub-Gaussian distribution represents a cluster and the category assignments of the datapoints depend on the corresponding likelihoods. GMMs are usually solved by the Expectation Maximization (EM) algorithm [Moon, 1996]. Like K-means, GMMs also need the prior knowledge of the cluster number. However, it is not acquirable in many real-world cases. In [Cho, 2016], the author modified the standard GMM to make the algorithm more ro-bust to noise so as to cluster the original GPS datapoints. In addition, by using the Dirichlet process prior [Neal, 2000], GMMs can be even further developed as a nonpara-metric hierarchical model, called Hierarchical Dirichlet Process (HDP) [Teh et al., 2005], in which the number of sub-Gaussian models does not need to be specified in advance. In [McInerney et al., 2013], the authors developed a location HDP-based approach to model heterogeneous location habits and tackled with the data sparsity issue success-fully.
Another feasible method is called Density-based Spatial Clustering of Applications with Noise (DBSCAN) [Ester et al., 1996], which is a density-based clustering algorithm. DB-SCAN recognizes the core areas by setting the minimum points number and neighbour-hood radius. In contrast with K-means, DBSCAN can handle data with complex shapes and is robust to noise. Moreover, it does not require to know the number of cluster in
ad-vance. However, it still needs to set some parameters properly, i.e., the minimum points number and the neighbourhood radius, to recognize the core areas and it treats the non-core data points as noise. Due to this reason, DBSCAN is not suitable for clustering the GPS data that is unevenly distributed in space.
Fig. 2.2 illustrates how the DBSACN algorithm works, where E ps is the neighbourhood radius.
Figure 2.2: DBSCAN.
As for other methods proposed in literature, in [Do et al., 2012], the researchers proposed a grid clustering method to labeled GPS data. This grid clustering algorithm separates the GPS data via grids and it focuses on detecting the stay points within a set of square regions, while fails to reveal the mobility at a larger scale. Another possible approach is proposed by [Zheng et al., 2009], which is a hypertext induced topic search (HITS)-based inference model. It is proposed to mine interesting locations and travel sequences through using a GPS dataset of large scale in a certain region. In this model, especially, the travel interests and the travel experiences of the users are taken into account. In the work of [Zheng et al., 2010a], the authors took advantage of a real-world GPS dataset collected from more than 150 users over a time period of 2.5 years, to devise a location recommendation model. This model is able to discover both the interesting locations and possible activities.
Table 2.1: Comparisons of Different Clustering Methods
Method Distance metrics Parameter K-means Euclidean Cluster number
GMM Log-likelihood Cluster number
DBSCAN Density Minimum points, radius HDP Log-likelihood Concentration parameter
HITS Euclidean Cluster number, hierarchy number
2.1.2/ CLUSTERING GPS TRAJECTORIES
Although through discovering frequently visited places can reveal human mobility patterns in a sense, we attempt to shed some light on human mobility patterns in a more detailed manner. That is to say, we want to use not only the data collected from the frequently visited places but also all the user mobility data. Therefore, in this thesis, one of our goal is to cluster GPS trajectories so as to find the common patterns existing in GPS data. A applicable way to achieve this goal is to cluster GPS trajectories.
Researchers have developed many methods for clustering GPS trajectories [Bian et al., 2018], [Castro et al., 2013]. Some researchers used K-means [Jiang et al., 2012], [Ashbrook et al., 2003] in their work. However, K-means cannot handle the trajectories with complex data shapes or noise because its clustering metrics is based on the Euclidean distance. Besides, similar to Gaussian Mixture Models, it also needs the prior knowledge of cluster number as we mentioned before.
DBSCAN is capable of dealing with the data with arbitrary shapes, therefore it can be used to cluster GPS trajectories [Tang et al., 2015], [Yu et al., 2017]. However, it treats the non-core data points as noise so it cannot deal with unevenly distributed data. From our study, we argue that the trajectory parts with less data density are also essential to demonstrate the human mobility, thus DBSCAN is not suitable for our task. Dynamic Time Warping (DTW) is a sequence aligned approach that is able to measure the simi-larity between two different time series regardless of sequence lengths and time order-ing [Agrawal et al., 1993]. However, when it is used to measures the similarity of two GPS trajectories, it can be easily affected by noise. Therefor DTW is not suitable for our task either.
In particular, some researchers focus on discovering the correlations between locations through the use of the user location history [Khetarpaul et al., 2011], [Zheng et al., 2011]. Furthermore, they utilized the travel experiences of the users and the correlations be-tween the visited locations to construct a personalized location recommendation system. In the work of [Xiao et al., 2010], the researchers attempted to find the similar users by estimating the closeness of their GPS trajectories. To this end, first, they build the seman-tic location history (SLH), for instance, ’school’ → ’bus stop’ → ’home’. Then, they esti-mated the similarities between different users by using the maximal travel match (MTM) algorithm. [Lou et al., 2009] proposed a global map-matching method, ST-Matching algo-rithm. Compared to other methods, this algorithm considers both the spatial and topolog-ical structure of the road networks. In addition, it takes the speed and temporal constraint of the GPS trajectories into count. In the study of [Zheng et al., 2010b], the authors aimed to construct a user-specific recommendation system through estimating the correlations between different trajectories. In order to do so, they used the travel experiences of the users and the sequentiality of the locations.
However, the aforementioned methods have their limitations. Clustering real-world GPS trajectory data is a very tricky problem because, firstly, different trajectories may have different data lengths due to the data collecting mechanism; secondly, the shapes of the trajectories may be very complex and unevenly distibuted in space in some cases; thirdly, GPS data may contain noisy information. Therefore, in order to handle these problems, we need to devise a novel method to achieve our goal. In our work, we propose a prob-abilistic approach, in which we estimate the probability densities of the GPS trajectories first, then use the Kullback-Leibler divergences as the distance metrics to cluster the GPS trajectory data. By doing so, we can avoid the aforementioned issues successfully.
2.2/
P
REDICTINGN
EXTU
SERL
OCATIONForecasting the next places that users will visit is an interesting research topic. It can be useful for many applications. For instance, it can be used for travel destination recom-mendation for tourists. Moreover, human behavior is highly related to locations, thereby we can improve the predicting accuracy by using the smartphone usage contextual in-formation, e.g., temporal inin-formation, application usage, call logs and WiFi status, etc.
The next-place prediction can be classified into two groups of learning tasks. One is to predict the next time-slot location, the other kind is to predict the next visit location. The predicting task of next time-slot location is to predict the place where the users stay in the next-time slots.
2.2.1/ MACHINE LEARNING-BASED PREDICTIONMETHODS
In [Baumann et al., 2018] and [Do et al., 2014], the authors applied various machine learning techniques to accomplish both the next time-slot location prediction and the next-place prediction. In particular, they exploited how different combinations of contex-tual features related to smartphone usage can affect the predicting accuracy. Meanwhile, they also compared the predicting performance of individual models and generic models. One class of the task is to predict the transitions among the places, i.e., the next visit location. In the task, different tasks are regarded as a set of separated places and the data related to these places can be either semantic labels or spatial coordinates.
In this thesis, in particular, we focus on predicting next visited places. This task can be regarded as a time series prediction task. A time series is a series of datapoints indexed in the order of time appearance. Since human behavior is stochastic by nature, thus deterministic may cause the overfitting issue. Overfitting is a phenomena that after we train a the model, the trained model fits the training data too well but fails to have good performance on the testing data. This may be due to the limited amount training data or noise in the training data. To overcome this difficulty, some probabilistic models, which leverage the conditional probabilities to make predictions, can be the alternative options. For the events A and B, the conditional probability P(A|B) is defined as:
P(A|B)= P(A, B)
P(B) (2.1)
where P(A, B) is the joint probability and P(B) is the marginal probability.
In the context of predicting the location of users, one can let B be some context events related to the location information, for instance, the hour of the day or the day of the week, and A be the next visit place. If we can calculate the marginal probability P(B) and the joint probability P(A, B), then we can leverage Eq. (2.1) to predict the next visit place via computing the conditional probability P(A|B).
Based on this idea, in [Do et al., 2012], the researchers developed the contextual condi-tional models for both the next-place prediction and the visit duration prediction by cal-culating the conditional probabilities between contextual features. The duration model is based on mixed log-Normal distributions of relation contextual information. In order to increase the fidelity of the prediction, they developed a general model and personalized model.
In [Do et al., 2015] and [Peddemors et al., 2010], the researchers presented the probabilistic prediction frameworks based on Kernel Density Estimation (KDE) [Davis et al., 2011]. KDE is a non-parametric method in statistics to esti-mate Probability Density Function (PDF). KDE casts the problem of PDF estimation into data smoothing task and one of the key issue is choosing the proper band-width. [Do et al., 2015] utilized conditional KDE to predict the mobility events and [Peddemors et al., 2010] devised a set of ad hoc kernels for different context information types. Additionally, [Scellato et al., 2011] proposed to use nonlinear time series analysis of the arrival time and residence time for location prediction.
Various machine learning models have been applied to next-place prediction, such as Naive Bayes (NB) [Muhlenbrock et al., 2004], Markov models [Yu et al., 2017], Hidden Markov Models (HMMs) [Cho, 2016], Dynamic Bayesian Networks (DBNs) [Etter et al., 2013], [Patterson et al., 2003], etc. These models attempt to forecast the future states of human behavior by computing the state transition proba-bilities. Nevertheless, these methods have their disadvantages, when the number of possible states expands, the calculation load will grow exponentially.
[Liao et al., 2007] introduced a hierarchical Markov model which can model a the daily moments of users in urban areas. This model utilizes not only raw GPS data but also semantic information, such as different transportation modes. The author also used the Rao–Blackwellized particle filter [Doucet et al., 2013] to improve inference efficiencies.
Bayesian Networks [Heckerman, 2008] are a kind of Probabilistic Graphical Models (PGMs). Bayesian network represents the variables and the dependencies between them by using Directed Acyclic Graph (DAG). Normally, devising a Bayesian Network requires domain knowledge from experts, which is not always easy to do.
Figure 2.3: The structure of a Bayesian Network.
The model structure of a classic Bayesian network is illustrated in Fig. 2.3, where A ∼ G represent different variables and the arrows denote the dependencies between the variables.
Figure 2.4: The structure of a Dynamic Bayesian Network.
The model structure of a Dynamic Bayesian Network is illustrated in Fig. 2.4, where t is the time point, A, B and C represent different variables and as opposed to classic Bayesian networks, the dependencies between variables are related to time in the Dy-namic Bayesian Network.
However, the aforementioned conventional machine learning models are not applicable to WiFi fingerprint-based user location prediction. Because to represent the time series state transition, due to the complex relationship between the WiFi RSSI values and the co-ordinates, neither Kalman filter-based approaches [Yang et al., 2019], Bayesian network-based model or hidden Markov model-network-based approaches [Krogh et al., 2001] are suitable for the tasks.
2.2.2/ DEEP LEARNING-BASED PREDICTION METHODS
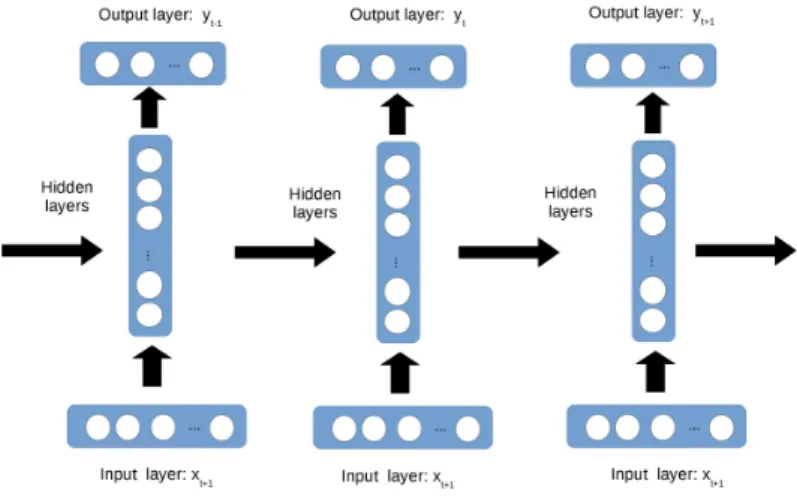
In order to solve this problem, we can resort to deep learning techniques, for instance, Recurrent Neural Networks (RNNs) [Elman, 1990]. The RNN is a widely used deep learning model specializing in time series prediction. The unfold structure of a RNN is depicted as in Fig. 2.5. The model structure of a RNN consists of the input layer, the hidden layer and the output layer as shown in Fig. 2.5. RNNs have other two variants, the Long Short-Term Memory (LSTM) [Gers et al., 1999] and Gated Recurrent Units (GRUs) [Chung et al., 2014]. LSTM solves the dependency problem in RNNs using a special structure. A LSTM unit has three gates, namely, an input gate, an output gate and a forget gate. These gates regulate the cell states of the LSTM. The GRU adopts a lighter struc-ture compared to the LSTM while they has similar performance. In [Hoang et al., 2019], the authors compared different types of Recurrent Neural Networks including the vanilla RNN model, the Long Short-Term Memory model, the Gated Recurrent Unit model and the bidirectional LSTM [Graves et al., 2005] for accurate RSSI indoor localization. They also employed a weighted filter for both input and output layers to enhance the sequential modeling accuracy.
2.3/
I
NDOORU
SERL
OCATIONR
ECOGNITIONThough GPS can provide the accurate information of user position, the disadvantage of GPS data-based methods is that GPS modules only function outdoors. Therefore, in in-door environment, we need to utilize WiFi fingerprint-based approaches as an alternative to study human mobility (other methods, for instance, laser-based methods, could be the options as well, however, in this thesis we only focus on smartphone usage data). WiFi fingerprint data records the Received Signal Strength Indicator (RSSI) values, which are numerical vectors related to the actual geographic location of smartphone users. Since WiFi fingerprints cannot directly be used to localize smartphone users, it needs to be labeled manually. The label values can be the building IDs, floor IDs or GPS coordinates.
In the literature, researchers have explored various types of machine learning techniques, both conventional machine learning and deep learning methods, on location recognition and prediction with WiFi fingerprint data. There are different kinds of research tasks related to WiFi fingerprints. Some researchers used WiFi fingerprints to identify building IDs and floor IDs, which can be regarded as classification tasks.
2.3.1/ CLASSIFICATION-BASED LOCATIONRECOGNITION
For classification tasks, WiFi fingerprint data is labeled with building IDs and Floor IDs. Many conventional machine learning algorithm can be used for this type of clas-sification task, for example, Decision Tree (DT) [Wu et al., 2008], K-nearest neighbors (KNN) [Bozkurt et al., 2015], Naive Bayes (NB) [Wu et al., 2008], Neural Networks (NNs) [Nowicki et al., 2017], Support Vector Machine (SVM) [Cortes et al., 1995], etc.
One widely used method is called the Classification and Regression Tree (CART) [Loh, 2011]. It is a kind of decision tree model, which can be used for both classifica-tion and regression tasks. CART is prone to be overfitting in practice. Therefore, in order to improve the performance, the CART method can be used as the basic esti-mators for the bagging method [Breiman, 1996] or the boosting method [Zhou, 2012]. For instance, Random Forest (RF) is a frequently used ensemble method called bag-ging [Breiman, 1996]. To overcome the overfitting problem, Random Forests utilize the bootstrap aggregating technique to decrease the variance of each decision tree.
Support Vector Machine (SVM) [Cortes et al., 1995] is another popular method. SVM is a kernel method which can be applied for both classification and regression. In a classification problem, SVM aims to find the optimal hyperplane to separate data.
In the work of [Bozkurt et al., 2015], the authors compared many traditional machine learning methods, for classifying buildings, floors and regions. In [Cramariuc et al., 2016], the authors clustered the 3D coordinates data by K-means and clustered the RSSI data by the affinity clustering algorithm, respectively.
Since WiFi fingerprint data are usually high dimensional, some deep learning tech-niques can be utilized for dimension reduction. Dimension reduction is to trans-form data from a high dimensional space to a rather low dimensional space while the information in the data retains. Because using high dimensional data to train models directly may be too computationally expensive and easy to be overfitting. In [Nowicki et al., 2017], [Kim et al., 2018], the authors used auto-encoders to reduce the input dimension before using a Multi-Layer Perceptron (MLP) to classify buildings and floors.
One essential issue of using WiFi fingerprint data is to deal with the high dimen-sionality issue. Therefore, in some tasks, training a model to predicting the tar-gets through using the learnt low latent representation is more accurate than us-ing the original input data. In order to reduce the dimension, some deep learning-based dimension-reduction methods like Autoencoders (AEs) can be an appropri-ate choice [Nowicki et al., 2017], [Song et al., 2019], [Kim et al., 2018]. Autoencoders (AEs) [Hinton et al., 2006] are unsupervised deep learning models used to compress input data. An Autoencoder contains an encoder and a decoder as shown in Fig. 2.6. During the training process, the encoder aims to learn a low-dimension representation of the input while the decoder is to reconstruct the original input. After the training pro-cess, we can obtain the latent representation of the input. Therefore, Autoencoders are commonly used for dimension reduction.
Figure 2.6: The architecture of an Autoencoder.
2.3.2/ ACCURATE LOCATION RECOGNITION
However, treating user the location recognition problem as classification tasks is only able to localize users at the accuracy level of buildings or floors. In some cases, we need to know the exact coordinates of users to proceed some tasks, for example, indoor navigation. In this case, we ought to frame location recognition as a regression problem. It means that we use WiFi RSSI vectors as the learning input and use the actual user location coordinates as learning targets of the proposed models.
Conventional machine learning models such as, Decision Tree, K-nearest neigh-bors and Random Forests can be used for such regression tasks. Specially, in [Torres-Sospedra et al., 2015], the researchers compared 51 different distance met-rics to investigate the most suitable distance functions for accurate WiFi-based in-door localization. Some researchers used Gaussian Processes (GPs) to model the relations between the WiFi signal strengths and the corresponding indoor locations [Ferris et al., 2007], [H ¨ahnel et al., 2006], [Yiu et al., 2015]. The Gaussian process is a type of stochastic process. The GP uses the kernel methods to measure the similarity between datapoints and to predict new values. The main drawback of the GP is that it is highly computationally expensive thus it is not suitable for datasets with large scales.
Besides, the aforementioned conventional machine learning models, we can also adopt advanced deep learning methods to slove the WiFi fingerprint-based location recognition problems. For accurate positioning, namely, interpreting WiFi RSSI values into actual numerical coordinates, the main issue of using conventional neural networks is overfitting.
For a traditional neural network, once it is trained, it can be regarded as a deterministic model (even the training process is stochastic). The neural network can be described as follow:
y= F (x; w) (2.2)
where x and y are the input and output of the NN, respectively, F represents the neural network structure and w are the weights of the NN.
Accordingly, the training loss (for instance, typically, mean squared errors) of NNs can be described as follow: Loss= 1 N N X n=1 ( ˆyn− yn)2 (2.3)
where N is the total number of the input, ˆy is the model target and n is the mini batch size.
In the research of [Song et al., 2019], the authors used an auto-encoder network to re-duce the data dimension, then used a CNN to proceed accurate user positioning. Deep learning methods, such as Convolutional Neural Networks (CNNs) [LeCun et al., 1998], Autoencoders (AEs) [Hinton et al., 2006] and Recurrent Neural Networks (RNNs) also have been utilized in WiFi fingerprint data-based positioning tasks. For instance, [Ibrahim et al., 2018] used a CNN model for time-series analysis. Generally, in order to provide good wireless Internet connection, modern buildings have many different WiFi access points, thus RSSI value data in many situations, can be very high dimensional. Due to this reason, it is reasonable to reduce the data dimension before carrying out a regression or classification task using WiFi fingerprints.
Principal Component Analysis (PCA) [Abdi et al., 2010] is a dimension reduction tech-nique. PCA calculates the correlation matrix of original input data first, and then proceeds eigenvalue decomposition on the correlation matrix. However, in our case, each feature of the WiFi RSSI data has the equal contribution to the output, therefore PCA is not suitable for our problem.
Convolutional Neural Networks are a kind of deep neural networks that are widely used for images analysing, signal processing and natural language processing. The CNN in-cludes various operations such as convolution operation, pooling operation and flatting operation. Each input channel of the CNN represents different colors of images. Convo-lution operation is to use a filter, which is a matrix, to detect the features of images. The
size of the matrix is called the kernel size. The stride is the shift length of the kernel in the convolution operation. After convolution operation is pooling operation, which aims to reduce the dimension of the convolved features and find the dominant features. There are two types of pooling, max pooling and average pooling. The difference is that max pooling is to return the maximum values of the convolved features while average pooling is to return the average values of all convolved features. After the pooling is to use a flat-ten layer to connect a MLP, for example, a classifier or a regressor. The model structure of a typical CNN is illustrated in Fig. 2.7.
Figure 2.7: The architecture of a Convolutional Neural Network.
In many situations, a NN model is powerful enough to obtain satisfying results. However, in some cases, for instance, to solve a high non-Gaussian inverse problem (which means that a input value may correspond to multiple possible output values), using a traditional deterministic neural networks will lead to very poor modeling results [Bishop, 2006]. A good solution to this issue is to seek for a probabilistic framework that can calculate conditional probability distributions between input and output.
A class of probabilistic methods is called Maximum Likelihood Estimation (MLE), which uses likelihood as the optimization objective. The MLE methods are flexible but prone to be overfitting, especially when it comes to the cases in which the data are sparse or noisy.
p(θ|D) ∝ p(D|θ) (2.4)
where D is the dataset and θ is the model parameters. p(θ|D) is the posterior and p(D|θ) is the likelihood.
Mixture Density Networks (MDNs) are deep learning models using the Maximum Like-lihood Estimation method [Bishop, Christopher M, 1994]. In a MDN, the final output is sampled by a mixture distribution rather than computed directly as opposed to conven-tional neural networks. One advantage of MDNs is that they can be applied to an estima-tion situaestima-tion in which a large variety lies. For instance, we can incorporate more mixture modles of Gaussians to a MDN to enhance its estimating capacity for more complex dis-tributions. However, as a MLE approach, MDNs also have obvious disadvantages. First, it needs to set some hyper-parameters properly (i.g., the mixture number of for a MDN), otherwise, it may not provide the desirable results due the underfitting or overfitting is-sue. Moreover, MLE methods may be severely biased when the training sample number are small, thus MDNs are not suitable for some tasks, for instance, the supervised step in semi-supervised learning. In practice, we find that MDNs suffer from computational instability when the mixture number at the output layer is large as well.
Figure 2.8: The architecture of a Mixture Density Network.
As demonstrated in Fig. 2.8, k is the mixture number, πkis the weight of the Gaussian, µk
is the mean and σkis the variance. In contrast to conventional neural networks, a Mixture
Density Network deploys a mixed Gaussian distributions at the final output layer, so the MDN acquires the final output by sample from the mixed Gaussian distributions instead of using deterministic functions. This enables the MDN to solve the inverse-Gaussian problem.
In contrast with MLE methods, Maximum A Posteriori (MAP) methods consider not only the likelihood but also the prior of model parameters. MAP methods can be described as
follow:
p(θ|D) ∝ p(D|θ)q(θ) (2.5)
where, p(θ|D) is the prior of the model parameters q(θ).
Compared to MLE, MAP is less easily to be overfitting and more robust to noise because it takes the prior of model parameters in count. MAP models can be solved by Varia-tional Inference (VI) [Blei et al., 2017], [Zhang et al., 2018] or Markov chain Monte Carlo (MCMC) [Gilks et al., 1995].
Based on the idea of MAP, to alleviate the disadvantages of MDNs, Bayesian Neu-ral Networks (BNNs), which apply Bayesian inference, have been introduced in [Hern ´andez-Lobato et al., 2015]. BNNs follow the scheme of Maximum A Posterior esti-mation, in which the prior knowledge of model parameters and likelihood are both consid-ered. As a result, MAP has the regularizing effect which can prevent overfitting. Unfortu-nately, in practice, we find that BNNs are not flexible enough for very complex distribution like our cases, i.e., recognizing user coordinates with WiFi fingerprints.
Figure 2.9: The architecture of a Bayesian Neural Network.
As for other MAP deep learning models, Variational Autoencoders (VAEs) [Kingma et al., 2013] are deep latent generative models trained in a unsupervised man-ner. Like conventional Autoencoders, a VAE consists of an encoder network and a de-coder network. While the difference is that VAEs are designed to generative new image
samples and the latent variables of VAEs are stochastic. VAEs adopt two special tech-niques to infer the model parameters, one is called Variational Inference and the other is called the reparameterization trick. The structure of a VAE is depicted as in Fig. 2.10.
Figure 2.10: The architecture of a Variational Autoencoder.
Table 2.2: Comparisons of Different Deep Learning Models
Model Learning Scheme Learning Purpose Autoencoders Unsupervised Dimension reduction Convolutional Neural Networks Supervised Feature extraction
Mixture Density Networks Supervised Regression Bayesian Neural Networks Supervised Regression/classification Recurrent Neural Networks Supervised Sequential prediction
Variational Autoencoders Unsupervised Data generation
Table 2.2 summarises the differences between the popularly used deep learning models.
As we explained before, the data used for our study are GPS coordinate data and WiFi fingerprint data. These data commonly have the issues of sparsity, noise and high dimen-sionality. If we use conventional methods, it will result in poor modelling performance. For this reason, in this thesis, we propose a series of probabilistic methods to solve the afore-mentioned problems. First, for clustering GPS trajectories, we devise a novel method using Dirichlet Process Gaussian Mixture Models to estimate the probability densities of the trajectories instead of computing the Euclidean distances. Second, to predict the next indoor location, we design a deep learning model combining a CNN sub-model, a RNN
sub-model and a MDN sub-model, which allows us to detect the high dimensional fea-tures and avoid overfitting. Third, in order to recognize accurate indoor user location, we suggest that, compared to use the WiFi fingerprint data directly, it is better to use a rep-resentation of the input data. Based on this idea, we devise a Variational Autoencoder-based semi-supervised learning model and a Variational Information Bottleneck-Autoencoder-based model, respectively. In the following chapters, the proposed methods in our work will be introduced.
D
ISCOVERING
D
AILY
O
UTDOOR
M
OBILITY
P
ATTERNS
3.1/
I
NTRODUCTIONIn this chapter, we focus on discovering the daily mobility patterns of multiple users in a specific region. Our purpose is to discover the mobility patterns for each individual based on their GPS location data. In order to do so, we need to cluster the daily trajectories of the users.
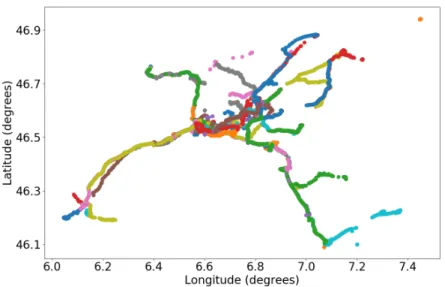
Figure 3.1: GPS data collected from a randomly selected user, different colors represent different data-collecting days.
As shown in Fig. 3.1, the mobility patterns of one individual consists of many different
jectories (this data is from the MDC dataset [Kiukkonen et al., 2010], [Laurila et al., 2012], the detailed data description will be presented in the later section).
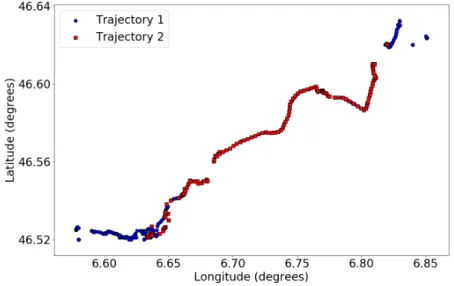
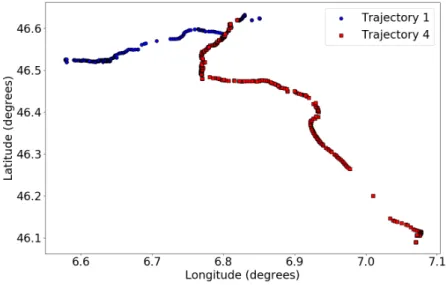
We hypothesize that the daily mobility of a user is rather regular and there are common mobility patterns shared among different daily trajectories. Generally, one may follow the regular daily itineraries, for instance, home → work place/school → home. Yet, on different days, the daily itineraries may not be the same. For instance, on the way to home, one may take a detour to do shopping in a supermarket. Hence, the objective of our research is to discover all the potential daily mobility from the data with the location information.
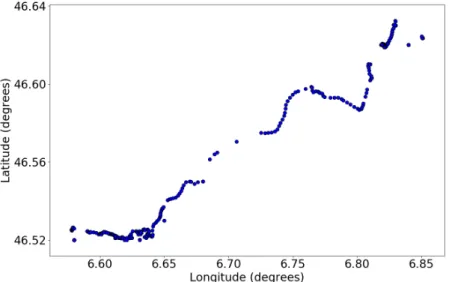
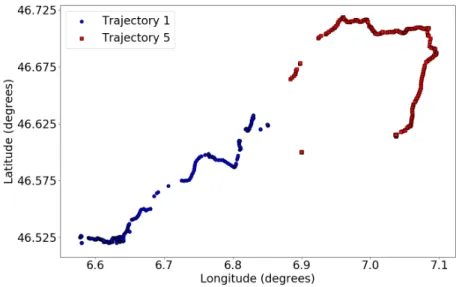
Figure 3.2: One randomly selected daily trajectory from a user.
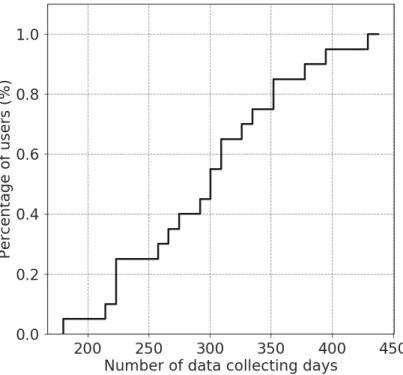
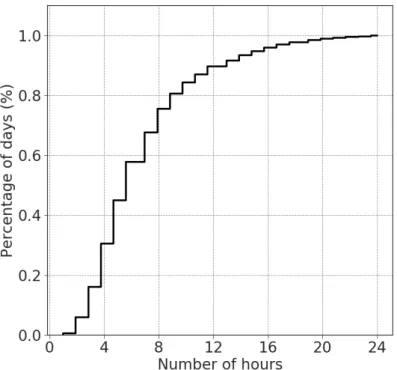
We extract each day’s trajectory from the whole dataset as shown in Fig. 3.2. It reveals that a daily trajectories recorded by GPS data is not distributed evenly in space, and is even not continuous in some areas. It may be caused by the data collecting procedure: some data collecting time range is actually relatively short (less than 24 hours, in fact, only few hours in some occasions), which leads to the data sparsity problem.
In order to overcome the data sparsity issue and to exploit as much information as pos-sible from the available GPS data, we argue that a reasonable way to describe the daily trajectories is to estimate the probability density of the location data. And the relationships among the trajectories can be represented by their probability densities. As a result, we can discover all the mobility patterns for each user.
The tasks in this chapter are summarized as follows:
• Task 1: Estimating the probability density of each day. We will compare the results of the Gaussian Mixture Model (GMM) and the Dirichlet Process Gaussian Mixture Model (DPGMM) [Rasmussen, 2000];
• Task 2: Measuring the closeness between different trajectories. We will use the KL divergences as the metrics;
• Task 3: Discovering the similar mobility patterns among all the recorded daily tra-jectories. This can be regarded as a clustering problem;
• Task 4: Comparing the DPGMM-based algorithm with the GMM-based algorithms;
• Task 5: Identifying the minimum data length for discovering all the mobility patterns.
3.2/
M
ETHODFrom Fig. 3.1 and Fig. 3.2, we can see that the GPS location data points are randomly spatially distributed. Besides, the distribution of each day consists of unknown number of heterogeneous sub-distributions. Therefore, it is reasonable to adopt the mixed Gaussian models to estimate the probability densities of daily mobility. The proposed clustering algorithm is summarized as follows:
• First, we estimate the probability densities of the trajectories via the Dirichlet Pro-cess Gaussian Mixture Models [Rasmussen, 2000];
• Second, we use the Kullback-Leibler (KL) divergence (computed via Monte Carlo sampling) as the distance metrics;
• Finally, we propose an automatic clustering algorithm based on DPGMM and KL divergence.
3.2.1/ PROBABILITY ESTIMATION
Since the daily trajectories are composed of different geo-locations, such as roads, homes, schools and offices, we need to use different sub-models to represent these