20/09/10 1
Robustness of the Average Power Ratios in
damping estimation: application in SHM of
composites beams
Joseph Morlier
Associate Professor, Isae, institut Clément ADER Université de Toulouse
Honore Yin
Research engineer, ENPC, Institut NAVIER Université Paris Est
2
SHM in Smart Structures (Composites)
Boeing 787 50% of Structure made of Composite
Aim of Using Composites
Increase the specific stiffness and strength Reduce the weight
Damage in Composites fabrication stress
environmental loadings
handling and foreign object impact damage
Goals
Better understanding of performance of composites beams versus LOW ENERGY impact damages (foreign objects, bird strikes, ice …) around BVID (Barely Visible Impact Damage). Correlate modal parameters shifts with damage density and
level
High Quality vibration tests and drop weight (impact) tests
Results of preliminary works on laminates composites [SHM09] Model updating and diagnosis tool [SHM10]
Today: Verify new Damping estimator; simple tool for engineer who does not have modal analysis software (LMS, B&K …)
4
Choice of SHM Detection Techniques
Ultrasonic testing Radiography
Eddy current testing
Liquid penetrant testing Infrared thermography Visual testing (optical) Vibration testing
Purpose of vibration based damage detection
Damage in a structure changes the modal parameters in the following way: Decrease in natural frequency
Increase in damping ratio
BACKGROUND OF THE RESEARCH
POLE CONTAINS INFORMATION ON DAMPING AND
Outlines
1. Damping estimation using AIPR 2. Vibration Tests & Impact Tests
3. Significance of damage by shifts in modal parameters 4. Conclusions & Future works
6
8
Classical bandwidth method and average inverse power ratio method
Inverse power ratio defined from a FRF Classical bandwidth method
Average inverse power ratio method 2 2 max
)
(
)
(
!
!
"
H
H
=
)
(
)
(
!
a"
!
b"
"
=
=
1
4
2 max 2 2!
!
"
#
$
$
$
%
b a!
"
"
±=
max±
1
4
max2 2 2!
!
"
+ !#
$
$
$
%
[
(
)
(
)
]
2 1 ! ++
=
#
"
#
"
#
10 function [etha,rho]=average_power_ratio(H,f,fn,fr) %H, FRF %f, Frequency vector %fn, Resonance %fr, Sampling frequency res=0.25
%frequency resolution for interpolation
-> MODE ISOLATION (left side)
-> FIND peak: omega_max H1 INTERPOLATION of H H1=H(ima:imb); f=f(ima:imb); fi = f(1):res:f(end); Hi = interp1(f,H1,fi,'linear'); H1=Hi; f=fi; df=f(end)-f(1); n2=round(df/res)
for n=1:n2/2;% every interpolate distance
of omega-max rho_m=(max(H1)/abs(H1(1+n)))^2; f_m=f(1+n); rho_p=(max(H1)/abs(H1(end-n)))^2; f_p=f(end-n); rho_a=0.5*(rho_m+rho_p); rho(n)=rho_a; etha_a=-(f_m-f_p)/(2*fn*sqrt(rho_a-1)); etha(n)=etha_a; end 200 250 300 350 400 450 500 550 600 0 0.1 0.2 0.3 0.4 0.5 0.6 0.7 0.8 0.9 1
mode isolation !!! l'amplitude du mode isolé est unitaire !!!
200 250 300 350 400 450 500 550 0 0.1 0.2 0.3 0.4 0.5 0.6 0.7 0.8 0.9 1
A simple model testing case HP Yin MSSP 2009
3 plexiglass beams and the FRF amplitude
PR x vs AIPR + vs curve fitting
---12
Numerical experiments
Synthetised data
Our numerical supervised experiments principally focus on the evaluation of AIPR sensitivity against frequency
resolution, SNR (Gaussian White Noise). For comparison we added a well established algorithm RFP
60 30
20 Signal to Noise Ratio (dB)
2 0.5 0.1 Damping Level (%) 1.5 0.625 0.25 Frequency Resolution (Hz) 508.5 341.1 318.6 Natural Frequency (Hz)
Damping estimation Vs frequency resolution
Figure 1: Identified damping ratio on theoretical damping ratio 2% (a) and 0.5% (b) for several value of power ratio for first mode isolated at 318.6 Hz (a) and for third mode (b) at 508.5 Hz. . Thin red line is FR of 1.5 Hz, orange thick line is 0.625 Hz,
yellow dotted line is 1 Hz. RFP is represented by blue line very close to theoretical value. AIPR is above 5% of error but always cross the real value at high power ratio.
14
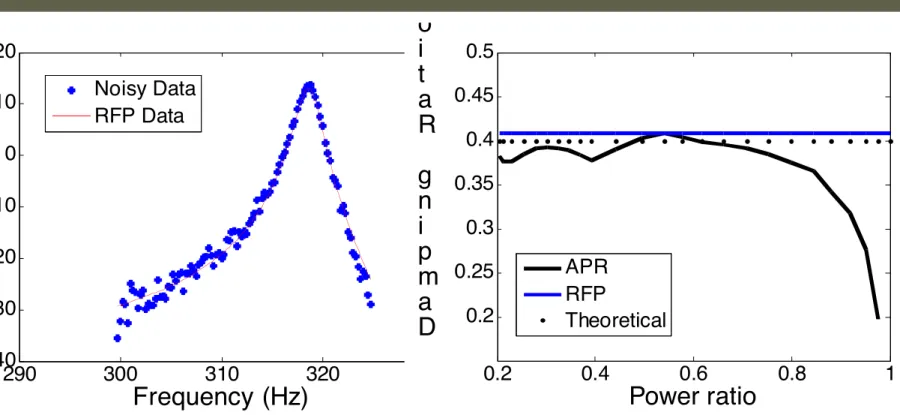
Damping estimation Vs SNR
290 300 310 320 330 -40 -30 -20 -10 0 10 20 Frequency (Hz) F R F ( d B ) Noisy Data RFP Data 0.2 0.4 0.6 0.8 1 0.2 0.25 0.3 0.35 0.4 0.45 0.5 Power ratio D a m p i n g R a t i o ( % ) APR RFP TheoreticalFigure 6: Damping estimation (0.4%) under different realization of a Gaussian noise process (SNR=20dB). Theoretical value is just in the middle of the 2 estimators but
the noise has less effect as damping becomes smaller (0.4%)
For low damping (composites material), low power ratio should be preferred (around 0.3), notably dealing with high noise.
Vibration Tests:
Testing Methodology
Vibration test based on Oberst Beam method
[0/90/45/-45]3s Lay-up
24 No of plies
480 x 50 x 3 mm Dimensions of the beam
T300/914 Type of material
Acquisition Parameters for both BR and SD
excitations)
Frequency Resolution = 0.25Hz Excitation level = 1N
Same number of measurement points for each beam
(33 symmetric points)
As the damages are symmetrical, We can compare the sum of FRF
Excitation: shacker point 17 Laser Vibrometer Measurement point 1 Measurement point 33
16
Experiments on 5 identical composites beams
First four bending modes Modes of interest 0-1600 Hz Frequency bandwidth 0.25 Hz Resolution Burst Random Type of Excitation
Modal Test Parameters Impact Test Parameters
6 8 10 (0.55mm) 12 14 1 2 3(BVID) 4 5 Energy of Impact (J) Beam No
Vibration tests carried out after each of the three states i.e., Undamaged (UD), Damage at 4 points (D1) and at 8 points (D2)
Parameters of the 5x2 Full Factorial DOE
NDT results for impact tests (repetitivity)
Damage zones:
local loss of rigidity ( decrease in frequency ) and
increase the surface of friction
( increase in damping ) due to delamination
C_SCAN
18
Shifts in Natural Frequency
For all modes: Decrease in frequency increases with damage Shift in frequency is higher for higher modes
MODE 1 MODE
19
Composite Laminates
Shift in Damping Ratio
Generally damping increase with damage but sometimes not consistent with damage
Better results with Sine Dwell excitation (non-linearity effects)
MODE
1 MODE2
MODE
20
Comparison
Generally damping estimation by AIPR is correlated with polymax But
polymax (use 33FRFs) and
AIPR (5 random FRFs selected with
large amplitude of mode)
))
Conclusions
Which Modal Parameter is more sensitive to damage ? Change in natural frequency = Less than 12%
Change in damping ratio = Up to 200 %
Good correlation between polymax and AIPR For engineer one advantage of AIPR is the simplicity: No numerical interpolations
Results shows AIPR is sufficiently accurate respecting several criteria: キ coupling effects are not strong
キ frequency resolution is high enough to determine accurately the peak amplitude
キ Processing mode by mode, FRF by FRF