HAL Id: hal-01805225
https://hal.archives-ouvertes.fr/hal-01805225
Submitted on 16 Sep 2020
HAL is a multi-disciplinary open access
archive for the deposit and dissemination of
sci-entific research documents, whether they are
pub-lished or not. The documents may come from
teaching and research institutions in France or
abroad, or from public or private research centers.
L’archive ouverte pluridisciplinaire HAL, est
destinée au dépôt et à la diffusion de documents
scientifiques de niveau recherche, publiés ou non,
émanant des établissements d’enseignement et de
recherche français ou étrangers, des laboratoires
publics ou privés.
Distributed under a Creative Commons Attribution| 4.0 International License
Disentangling climatic and anthropogenic controls on
global terrestrial evapotranspiration trends
Jiafu Mao, Wenting Fu, Xiaoying Shi, Daniel Ricciuto, Joshua Fisher, Robert
Dickinson, Yaxing Wei, Willis Shem, Shilong Piao, Kaicun Wang, et al.
To cite this version:
Jiafu Mao, Wenting Fu, Xiaoying Shi, Daniel Ricciuto, Joshua Fisher, et al.. Disentangling climatic
and anthropogenic controls on global terrestrial evapotranspiration trends. Environmental Research
Letters, IOP Publishing, 2015, 10 (9), �10.1088/1748-9326/10/9/094008�. �hal-01805225�
LETTER • OPEN ACCESS
Disentangling climatic and anthropogenic controls
on global terrestrial evapotranspiration trends
To cite this article: Jiafu Mao et al 2015 Environ. Res. Lett. 10 094008
View the article online for updates and enhancements.
Related content
Contribution of environmental forcings to US runoff changes for the period 1950–2010
-Spatiotemporal patterns of
evapotranspiration in response to multiple environmental factors simulated by the Community Land Model
-Spatio-temporal dynamics of
evapotranspiration on the Tibetan Plateau from 2000 to 2010
-Recent citations
An isotopic approach to partition evapotranspiration in a mixed deciduous forest
Phoebe G. Aron et al
-Uncertainty analysis of artificial intelligence modeling daily reference
evapotranspiration in the northwest end of China
Haijiao Yu et al
-Investigating Wetland and Nonwetland Soil Methane Emissions and Sinks Across the Contiguous United States Using a Land Surface Model
Shijie Shu et al
Environ. Res. Lett. 10(2015) 094008 doi:10.1088/1748-9326/10/9/094008
LETTER
Disentangling climatic and anthropogenic controls on global
terrestrial evapotranspiration trends
Jiafu Mao1 , Wenting Fu2 , Xiaoying Shi1 , Daniel M Ricciuto1 , Joshua B Fisher3 , Robert E Dickinson2 , Yaxing Wei1 , Willis Shem1 , Shilong Piao4 , Kaicun Wang5 , Christopher R Schwalm6,7 , Hanqin Tian8 , Mingquan Mu9, Altaf Arain10, Philippe Ciais11, Robert Cook1, Yongjiu Dai5, Daniel Hayes1,
Forrest M Hoffman12, Maoyi Huang13, Suo Huang10, Deborah N Huntzinger7,14, Akihiko Ito15, Atul Jain16,
Anthony W King1, Huimin Lei17, Chaoqun Lu8, Anna M Michalak18, Nicholas Parazoo3, Changhui Peng19,
Shushi Peng11, Benjamin Poulter20, Kevin Schaefer21, Elchin Jafarov21, Peter E Thornton1, Weile Wang22,
Ning Zeng23, Zhenzhong Zeng4, Fang Zhao23, Qiuan Zhu19and Zaichun Zhu24
1 Environmental Sciences Division and Climate Change Science Institute, Oak Ridge National Laboratory, Oak Ridge, TN, USA 2 Jackson School of Geosciences, the University of Texas, Austin, TX, USA
3 Jet Propulsion Laboratory, California Institute of Technology, Pasadena, CA, USA
4 Sino-French Institute for Earth System Science, College of Urban and Environmental Sciences, Peking University, Beijing 100871,
People’s Republic of China
5 College of Global Change and Earth System Science, Beijing Normal University, Beijing, People’s Republic of China 6 Center for Ecosystem Science and Society, Northern Arizona University, Flagstaff, AZ 86011, USA
7 School of Earth Sciences and Environmental Sustainability, Northern Arizona University, Flagstaff, AZ 86011, USA
8 International Center for Climate and Global Change Research and School of Forestry and Wildlife Sciences, Auburn University, Auburn,
AL 36849, USA
9 Department of Earth System Science, University of California, Irvine, CA, USA
10 School of Geography and Earth Sciences and McMaster Centre for Climate Change, McMaster University, Hamilton, Ontario, Canada 11 Laboratoire des Sciences du Climat et de l’Environnement, LSCE, F-91191 Gif sur Yvette, France
12 Climate Change Science Institute and Computer Science and Mathematics Division, Oak Ridge National Laboratory, Oak Ridge, TN
37831, USA
13 Atmospheric Sciences and Global Change Division, Pacific Northwest National Laboratory, Richland, WA 99354, USA
14 Department of Civil Engineering, Construction Management, and Environmental Engineering, Northern Arizona University, Flagstaff,
AZ 86011, USA
15 National Institute for Environmental Studies, Tsukuba, Ibaraki 305-8506, Japan 16 Department of Atmospheric Sciences, University of Illinois, Urbana, IL 61801, USA
17 Department of Hydraulic Engineering, Tsinghua University, Beijing 100084, People’s Republic of China 18 Department of Global Ecology, Carnegie Institution for Science, Stanford, CA 94305, USA
19 Institute of Environmental Sciences, University of Quebec at Montreal(UQAM), Case postale 8888, succ Centre-Ville, Montréal, QC
H3C 3P8, Canada
20 Department of Ecology, Montana State University, Bozeman, MT 59717, USA
21 National Snow and Ice Data Center, Cooperative Institute for Research in Environmental Sciences, University of Colorado at Boulder,
Boulder, CO 80309, USA
22 Ames Research Center, National Aeronautics and Space Administration, Moffett Field, Mountain View, CA 94035, USA 23 Department of Atmospheric and Oceanic Science, University of Maryland, College Park, MD 20742, USA
24 State Key Laboratory of Soil Erosion and Dryland Farming on the Loess Plateau, Northwest A&F University, Yangling 712100, People’s
Republic of China E-mail:maoj@ornl.gov
Keywords: evapotranspiration, natural and anthropogenic controls, factorial analysis, MsTMIP Supplementary material for this article is availableonline
Abstract
We examined natural and anthropogenic controls on terrestrial evapotranspiration
(ET) changes
from 1982 to 2010 using multiple estimates from remote sensing-based datasets and process-oriented
land surface models. A significant increasing trend of ET in each hemisphere was consistently revealed
by observationally-constrained data and multi-model ensembles that considered historic natural and
anthropogenic drivers. The climate impacts were simulated to determine the spatiotemporal
variations in ET. Globally, rising CO
2ranked second in these models after the predominant climatic
influences, and yielded decreasing trends in canopy transpiration and ET, especially for tropical forests
and high-latitude shrub land. Increasing nitrogen deposition slightly amplified global ET via enhanced
OPEN ACCESS
RECEIVED
16 June 2015
REVISED
17 August 2015
ACCEPTED FOR PUBLICATION
18 August 2015
PUBLISHED
8 September 2015
Content from this work may be used under the terms of theCreative Commons Attribution 3.0 licence.
Any further distribution of this work must maintain attribution to the author(s) and the title of the work, journal citation and DOI.
plant growth. Land-use-induced ET responses, albeit with substantial uncertainties across the factorial
analysis, were minor globally, but pronounced locally, particularly over regions with intensive
land-cover changes. Our study highlights the importance of employing multi-stream ET and
ET-component estimates to quantify the strengthening anthropogenic
fingerprint in the global hydrologic
cycle.
1. Introduction
Intensified global hydrological cycle has been observed and modeled during the past few years (Hunting-ton2006, Gerten et al2008, Wang et al2010, Durack et al2012, Douville et al2013, Sterling et al2013, Wu et al2013, Gedney et al2014). Terrestrial
evapotran-spiration(ET) is arguably the central component of this changing hydrologic cycle, and functions as a vital link between energy, water and carbon cycles, thereby having important implications for the availability and usage of fresh water resources by humans and terrestrial ecosystems (Seneviratne et al2006, Tren-berth et al 2009, Fisher et al 2011, Wang and Dickinson2012).
Natural environmental factors(e.g. precipitation, temperature, incident solar radiation, soil moisture, wind and atmospheric teleconnections) regulate ET and its variability across different terrestrial ecosys-tems (Teuling et al 2009, Jung et al 2010, Wang et al2010, Vinukollu et al2011, Zhang et al2012, Mir-alles et al 2014). These natural controls and
limita-tions/co-limitations of ET are scale-dependent. Their mechanistic understanding is very important to pre-dict the tendency and variability of ET (Wang and Dickinson 2012). Human-induced land use/land
cover change, ground water withdrawals, and irriga-tion can directly alter the amount and timing of ET by modifying the local water and energy balances(Piao et al2007, Gerten2013, Leng et al2013,2014a,2014b, Lo and Famiglietti 2013, Sterling et al 2013, Lei et al2014c). Human activities that contribute to
green-house gas emissions, atmospheric nitrogen deposition (NDE), and ozone pollution can also alter ET indir-ectly through changes in physiological, structural and compositional responses of plants(Gedney et al2006, Betts et al2007, Sitch et al2007, Cao et al2009, Leakey et al2009). Discriminating these anthropogenic
per-turbations from natural factors is expected to increase in importance as anthropogenic transformation of the Earth System becomes more pervasive (Seneviratne et al2010, Gerten2013).
Based on mechanistic and empirical algorithms that are driven by remotely sensed observations, a variety of globally gridded diagnostic ET products have been compiled and evaluated in recent years (Willmott et al 1985, Fisher et al 2008, Jiménez et al2009, Jung et al2009, Sheffield et al2010, Zhang et al 2010b, Miralles et al2011, Mueller et al2011, Vinukollu et al 2011, Zeng et al 2012, Schwalm
et al2013). These gridded ET estimates offer crucial
sources and benchmarks for quantitative investiga-tions of historical ET dynamics over the land surface. However, the accuracy of these observation-based ET products has yet to be reconciled due to limitations in underlying hypotheses and errors in input datasets (Mueller et al2011,2013, Polhamus et al2012).
More-over, due to their reliance on the satellite observations, these datasets offer a limited historical temporal record that encompasses only a few decades(Badgley et al2015).
To predict future changes in ET patterns, process-based simulation and understanding of the magni-tudes, mechanisms and interactions that control his-torical ET dynamics will be required and should be within uncertainty of both historical and present-day observations. Mechanistic land surface models (LSMs), driven by measurement-based environmental properties, are useful tools for the detection and attri-bution of natural and anthropogenic effects on ET dynamics. For the past decade, global factorial LSM experiments have been conducted and analyzed by dif-ferent modeling groups to investigate the separate effects of environmental stresses on land surface and subsurface runoff, riverflow, ET and water use effi-ciency(Gedney et al2006,2014, Piao et al2007, Shi et al2011,2013, Tian et al2011, Liu et al2012, Tao et al2014). The role of climate impacts on these
hydro-logic variables has been characterized predominantly across different regions of the globe. The relative role of natural environmental change versus anthro-pogenic activities, however, was modeled to be hetero-geneous and geographically dependent. Nevertheless, due to large differences in initial model conditions, driver data, and complex parameterizations that gov-ern models, the simulated ET was demonstrated to vary in magnitudes and responses across models at both temporal and spatial scales(Wang et al2010).
To disentangle these differences in simulated ET patterns and the relative role of model sensitivity and structure, the experimental setup and boundary/ initial data must be similar among different participat-ing models. We leveraged the controlled factorial experiments and model simulation protocol from the Multi-Scale Synthesis and Terrestrial Model Inter-comparison Project (MsTMIP) (Huntzinger et al2013). Further, we synthesized a global ET time
series(1982–2010) based on a diverse set of diagnostic ET products(table1), and the methodology reported
Table 1. Overview of the diagnostic ET datasets used for the merged ET of this study, and the simulated ET from MsTMIP models. Factorial results of the MsTMIP multi-model are ALL: the impact from all historical forcing factors, CLI: the
impact from historical climate only, OTH: all anthropogenic impacts, CO2: the historical CO2impact only, NDE: the historical nitrogen deposition impact only, LUC: the historical land use/land cover change impact only, Y: the
availability of ET simulation for the particular impact, and N: the non-availability of ET simulation for the particular impact.
Group Name Algorithm Spatial resolution Precipitation data Time period Citation
GLEAM Modified Priestley–Taylor 0.25°×0.25° GPCP CMORPH 1982–2010 Miralles et al(2011)
CSIRO Modified Penman–Monteith 0.5°×0.5° SILO 1984–2005 Zhang et al(2010b)
MPI Empirically derived from FLUXNET 0.5°×0.5° GPCC 1982–2008 Jung et al(2009)
NTSG Modified Penman–Monteith 0.5°×0.5° GPCC 1983–2006 Zhang et al(2010a)
Diagnostic ET PRUNI(3 sets
of data) Penman–Monteith/Priestley–Taylor (ISCCP, AVHRR, SRB) 0.25°×0.25° Sheffield et al(2006) 1984–2007 Sheffield et al (2010)
PT-JPL Modified Priestley–Taylor 0.5°×0.5° Not required 1984–2006 Fisher et al(2008)
UDEL Modified Thornthwaite water budget 0.5°×0.5° GHCN2 1980–2008 Willmott et al(1985)
PUB Empirical method(TWSA, CRU) 0.5°×0.5° GRACE 1982–2009 Zeng et al(2012)
AWB Water balance 0.5°×0.5° GPCP 1990–2006 Mueller et al(2011)
Group Name Algorithm Spatial Resolution Time Period Citation CLI LUC CO2 NDE ALL OTH
CLM4 Modified Penman–Monteith 0.5°×0.5° CRUNCEP 1982–2010 Lawrence et al(2007), Mao
et al(2012)
Y Y Y Y Y Y
DLEM Penman–Monteith 0.5°×0.5° CRUNCEP 1982–2010 Tian et al(2011,2012) Y Y Y Y Y Y
BIOME-BGC Penman–Monteith 0.5°×0.5° CRUNCEP 1982–2010 Thornton et al(2002) Y N N N Y Y
CLASS-CTEM-N+ Modified Penman–Monteith 0.5°×0.5° CRUNCEP 1982–2010 Huang et al(2011), Bartlett
et al(2006)
Y Y Y Y Y Y
CLM4-VIC Modified Penman–Monteith 0.5°×0.5° CRUNCEP 1982–2010 Lei et al(2014a) Y Y Y Y Y Y
ISAM Modified Penman–Monteith 0.5°×0.5° CRUNCEP 1982–2010 Jain et al(1996) Y Y Y Y Y Y
MsTMIP ET LPJ-WSL Modified Penman–Monteith 0.5°×0.5° CRUNCEP 1982–2010 Sitch et al(2003) Y Y Y N Y Y
ORCHIDEE-LSCE Modified Penman–Monteith 0.5°×0.5° CRUNCEP 1982–2010 Krinner et al(2005) Y Y Y N Y Y
SiB3-JPL Penman–Monteith 0.5°×0.5° CRUNCEP 1982–2010 Baker et al(2008) Y Y Y N Y Y
SiBCASA Penman–Monteith 0.5°×0.5° CRUNCEP 1982–2010 Schaefer et al(2008,2009) Y Y Y N Y Y
TRIPLEX-GHG Modified Penman–Monteith 0.5°×0.5° CRUNCEP 1982–2010 Peng et al(2011) N N Y Y Y N
VEGAS Bulk transfer formula 0.5°×0.5° CRUNCEP 1982–2010 Zeng et al(2005) Y Y Y N Y Y
VISIT Penman–Monteith 0.5°×0.5° CRUNCEP 1982–2010 Ito and Inatomi(2012) Y Y Y N Y Y
3 Environ. Res. Lett. 10 (2015 ) 094008 J Mao et al
(e.g canopy transpiration (Tr) and evaporation from wet canopy and bare soil(ET–Tr)) and the variation of those ET components are poorly understood and less constrained by observations (Lawrence et al 2007, Jasechko et al 2013, Swenson and Lawrence 2014, Wang et al2014). The MsTMIP modeling framework
can advance our understanding of trends in ET by pro-viding predictions of the individual ET components. In this study, we thus further investigated the con-tribution of individual influencing factors to the spa-tial and temporal characteristics of these ET constituents.
2. Datasets and methods
We created a merged diagnostic ET data(DIA) from 11 long-term diagnostic datasets, all based on different assumptions and constrained with extensive in situ observations or satellite retrievals or both(table1). We
remapped the monthly raw datasets from their origi-nal spatial resolutions to the half-degree resolution of the model output from 1982 through 2010 based on data availability. Following Mueller et al (2013), we
applied both physical and statistical constraints for quality control and bias corrections. For the physical constraint, we developed a dataset of seasonal net radiation maxima using the surface radiation budget (SRB3.0) datasets (Gupta 1983). We then excluded
grid points with values exceeding net radiation max-ima by more than 25%. The outliers were identified as values that exceed ±3 standard deviations (Wee-don 2011). Then the median values of these quality-controlled multiple ET estimates were treated as the merged product, and were comprehensively com-pared with the LSM results in this study. As shown in figure S1, the annual anomalies of the previously synthesized ET in Mueller et al(2013) are well within
the spread of this newly-merged diagnostic data product. This updated product however, provides longer-term dynamics and is more amenable for studies at multi-decadal timescales.
To isolate the contributions of environmental dri-vers to multi-year ET variations, we utilized the factor-ial ET simulations from the MsTMIP data archive. Driven by the same environmental forcing(climate variability and trends, rising atmospheric CO2
con-centrations causing fertilization and reducing stomatal opening, nitrogen deposition, land use/land cover change, and soil texture and vegetation types), these state-of-the-art LSMs were employed to identify the principal drivers of interannual variability and multi-decadal changes of ET. Because the evaporation com-ponent for canopy and soil, and the snow sublimation, were not separately archived in the standard model outputs in the MsTMIP I protocol (Huntzinger et al 2013,2015), we included all relevant available
outputs, namely the ET, Tr and the total evaporation (ET–Tr). Four model experiments: (1) SG1 (time
varying climate), (2) SG2 (time-varying climate and land use change history), (3) SG3 (time-varying cli-mate, land use, and atmospheric CO2), and (4) BG1
(time-varying climate, land-use, atmospheric CO2and
nitrogen deposition), were analyzed to quantify the effects of each environmental forcing factor on the study variables for the years 1982 through 2010. The transient simulations began in 1901, turning on one time-varying driver at a time. Simulations BG1 or SG3 were used to address the combined impacts from var-ious historical forcing agents for models with(BG1) or without(SG3) an explicit nitrogen cycle. Simulation or simulation differencing was used to quantify the contribution to ET and ET component changes from climate change(CLI) (derived from SG1), land use/ land cover change(LUC) (derived from SG2-SG1), ris-ing atmospheric CO2(CO2) (derived from SG3-SG2),
NDE(derived from BG1-SG3), or all forcing (ALL) (derived from BG1 or SG3) (table1). To account for
the overall effects from human activity (OTH), we derived the human-induced ET to be the difference between the BG1 and SG1 or SG3 and SG1 simulations.
Annual cropland area and total tree coverage infor-mation for the 1982–2010 period were derived from the merged product of the SYNergetic land cover MAP (Jung et al2006) and the annual time series of the land
use harmonization data(Hurtt et al2011). Additional
details on the aforementioned driver data and experi-mental design can be found in Wei et al(2014a,2014b)
and Huntzinger et al(2013,2015).
Growing season ET generally dominates the annual sum over the vegetated area of land(Wang et al2007). We focused our analysis on growing season
ET for all observational and modeled data. The dynamic annual growing season information, used to mask the monthly ET between 1982 and 2010, was first determined from the global inventory modeling and mapping studies normalized difference vegetation index (NDVI3g) dataset (Pinzon and Tucker 2014)
using a Savitzky–Golay filter (Chen et al2004, Jonsson and Eklundh2004). It was then refined by excluding
the freeze period identified by the Freeze/Thaw Earth System Data Record(Kim et al2011,2012). In
parti-cular, the growing season of tropical rainforests was set to 12 months and it started in January.
3. Results
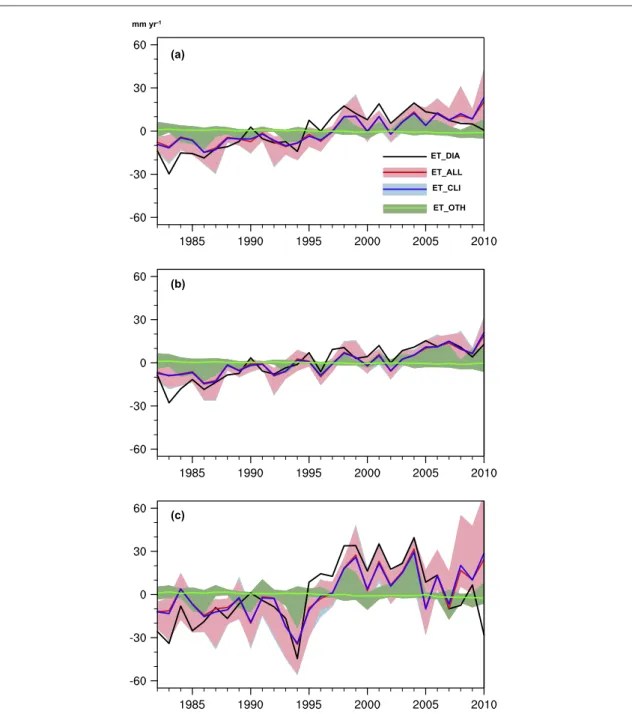
Across the globe, statistically significant increasing trends of ET were recorded from 1982 to 2010 in the observation-based ET estimates(DIA) (1.18 mm yr−2) and modeled ET from the ALL simulation (0.93±0.31 mm yr−2) (figures 1 and S2, and table
S1). Significantly positive annual correlations between the simulated ALL ET and the observed ET were obtained, particularly in the Northern hemisphere (NH) (Land: R2=0.58, p<0.01, NH: R2=0.72,
p<0.01, and the Southern hemisphere (SH): R2=0.46, p<0.01). The simulated multiyear increasing trend and interannual variability of the ALL ET were mainly explained by the CLI ET. In contrast, the overall human-induced OTH ET was predicted to decrease somewhat, and to exhibit relatively small interannual variations.
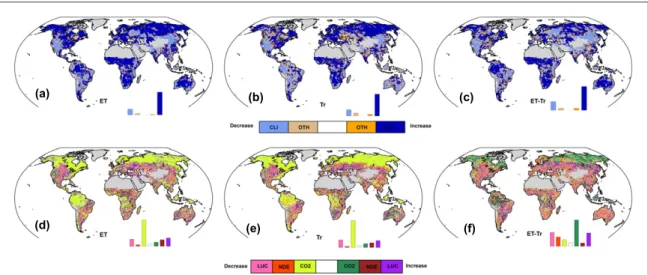
Spatial analysis of linear trends of ET for the merged observation product revealed remarkably consistent increasing tendency over most continents (figure2(a)). Local hotspots of reduced ET were
diag-nosed to occur in the arid regions of Western North America, central Africa, Northern China and South-eastern Asia. By contrast, the modeled changes of ALL ET underestimated the magnitude of ET changes in
Eastern North America and Western Europe, and mis-sed the ET decreases in central Africa. But the place-ment of increasing or decreasing trends in ALL ET largely agreed favorably with those of the observed ET trends, indicating the suitability of examining multi-year ET trends using the all-factor simulations.
Spatial patterns of ET changes that are consistent between the ALL and CLM estimates confirm the dominance of climate forcing in explaining annual ET trends(figures2(b), (c) and3(a)). This dominant
cli-matic response of ET trends was chiefly associated with concurrent annual precipitation changes(spatial R2=0.34 for ALL ET and precipitation trend, and spatial R2=0.30 for CLI ET and precipitation trends, respectively, P<0.01), and tended to show large
Figure 1. Time series of annual anomalies of growing season ET(mm yr−1) over (a) the globe, (b) the NH, and (c) the SH from 1982 to 2010. Solid lines are the median values of the merged ET(ET_DIA, black), MsTMIP ET of ALL (ET_ALL, red), CLI (ET_CLI, blue), and OTH(ET_OTH, green). Shaded areas indicate the ET range of independent MsTMIP models.
5
spatial heterogeneities of sign and magnitude (figure4(a)). The spatial dominance patterns based on
the partial correlations among the total growing sea-son ET, precipitation, temperature and incident solar radiation affirmed that for the MsTMIP models, annual precipitation drove not only the interannual variability of ET, but primarily accounted for the mul-tiyear ET trends over most land areas(figures4(e) and
(f)). Combined anthropogenic effects tended to decrease ET, most notably in Northeastern North America, Western Amazon, Northwestern Europe and tropical Asia(figure2(d)). These effects were
sub-ject primarily to the net physiological and structural
impacts of CO2concentration on the growth of plants
in ecosystems(figures2(e),3(d), S2 and S3(a)).
Increasing nitrogen deposition led to increasing leaf area index(LAI) (figures4(b) and S3(b)), and
con-sequently to enhanced terrestrial ET, particularly over South America, Africa and Southeastern China (figures 2(f) and S2). The areas undergoing strong
increase in forest fraction and decrease in cropland fraction, such as in central Eastern North America and central Europe, clearly showed increasing annual ET (figures2(g),4(c) and (d)). In contrast, regions with
evident loss of trees, such as Eastern China and South-eastern South America, show a downtrend of annual
Figure 2. Spatial distribution of the linear trends in ET median values(mm yr−2) for (a) ET_DIA, (b) ET_ALL, (c) ET_CLI, (d) ET_OTH,(e) CO2(ET_CO2), (f) NDE (ET_NDE), and (g) LUC (ET_LUC) from 1982 to 2010. The stippled areas represent the trends
ET. Compared to the CO2 and nitrogen deposition
effects, however, the effect of LUC on land ET was important locally. Relatively large uncertainties from the LUC were also found between individual models (figures S2 and S6).
Trends for the Tr and total ET–Tr were dominated by the climatic changes across various continents. For Tr, 85.4% of the study area was impacted by the cli-matic changes, and 88.7% for ET–Tr (figures3(b), (c),
S4(a)–(f)). Congruent with the response of ET changes to rising CO2 (48.4 ppm during the period
1982–2010), most areas, especially these regions cov-ered by tropical broadleaf evergreen trees and high latitude shrubs, showed decreasing Tr. This is due to the CO2-induced reduction in stomatal conductance
overwhelming the LAI-induced increase of canopy evaporation and transpiration under elevated CO2
concentration(figures 3(e) and S4(j)). On the other
hand, CO2 fertilization would enhance canopy LAI
through increasing photosynthate allocation to leaves, and caused more canopy transpiration and evapora-tion than the reduced transpiraevapora-tion by CO2
physiolo-gical effects, especially over dry areas with sparse vegetation(e.g. the Western North America, central Eurasia, and Australia) (figures S3(a) and S4(j)). Reversed ET–Tr trends in these arid regions imply that decreasing soil evaporation was the dominant factor in changing ET–Tr (figures S4(j)–(l)). For most areas that showed decreasing Tr but increasing ET–Tr under CO2enrichment, the augmented evaporation of
inter-cepted rainfall and increasing soil evaporation may have been coincidental.
Increasing ET caused by nitrogen deposition was due to enhanced Tr(figures 2(f), S4(m) and S5). A
decrease of ET–Tr caused by the nitrogen deposition effect, as seen in central North America and in Wes-tern Europe, was due to reduced soil evaporation (figures S4(n) and S5). The latter is a consequence of the increasing LAI providing more shade and so
reducing solar energy for soil evaporation. In addition, the increasing Tr further depleted soil water, which reduced soil evaporation. In the evergreen broadleaf forests of the Western Amazon and Congo basin, nitrogen deposition and higher LAI resulted in increasing canopy evaporation. The increase in canopy evaporation more than offset the decrease in soil eva-poration and hence dominated the increasing ET–Tr and even the nitrogen-induced increase in total ET (figures S4(m)–(o)).
LUC led to a decreasing trend in Tr across densely inhabited regions that had experienced substantial land use perturbations(e.g. clearing trees for crops) during the study period. These occurred mainly in Southeastern South America and the Eastern China (figures4(c), (d), S4(p) and S5). Tr trends showed a
general negative sign over central Eastern North America and Western Europe, where croplands had been replaced mainly by forests and woodlands. This reduction of Tr with reforestation implies that the tree species that replaced the crops had lower stomatal conductance than the crop species, the younger and smaller trees of the returning forests had lower LAI than the croplands they replaced, or the available soil water for plants decreased because of the removal of irrigation. These aspects deserve further study.
4. Discussion
Between 1982 and 2010, the observation-based and simulated ALL ET consistently showed a significantly increasing trend across the globe. Thesefindings are consistent with previous studies, which reported an intensified global hydrological cycle in response to global warming following the Clausius–Clapeyron law (the relationship between equilibrium water vapor pressure and temperature, about 7% per °C of warming) (Held and Soden2006), as well as increasing Figure 3. Spatial distribution of the dominant drivers for the ET, Tr and ET–Tr changes for the period 1982–2010. (a)–(c) Dominant drivers for the ET, Tr and ET–Tr trends of the ALL results, and (d)–(f) dominant drivers for the ET, Tr and ET–Tr trends of the OTH results.
7
importance of the radiative component of ET (John-son and Sharma2010). Climatic factors accounted for
much of the spatial and temporal variations in terrestrial ET, Tr and ET–Tr. This supports previous studies regarding the prevalent climatic mechanisms controlling the long-term ET trends such as tempera-ture, precipitation, soil moistempera-ture, energy and internal climate variability(Teuling et al2009, Jung et al2010, Wang et al 2010, Vinukollu et al 2011, Zhang et al 2012, Ukkola and Prentice 2013, Miralles et al2014).
In our study, the rising atmospheric CO2
con-centration, as tested by model factorial experiments, induced an overall suppression of Tr and hence a gen-eral decreasing ET. Our results further suggest that the sign of change and regional pattern of these CO2
phy-siological effects on ET were moderated by changes in LAI. The overall response of ET was eventually deter-mined by the balance among the changes of Tr, canopy evaporation and soil evaporation. These results are consistent with modeled and observed plant physiological responses to the increase of CO2
concentration in the atmosphere (Betts et al 2007,
Leakey et al2009). They also reiterate previous
find-ings that show the concurrent physiological and struc-tural responses of vegetation to rising CO2, and
associated hydrological effects (Gedney et al 2006, Leipprand and Gerten 2006, Ainsworth and Rogers2007, Betts et al2007, Kurc and Small2007, Piao et al2007, Cao et al2009, Leakey et al2009, Lei et al2014b).
Simulation experiments that consider NDE showed enhanced global LAI as a result of increasing nutrient availability (figures 4(b) and S3(b)). The
nitrogen-induced enhancement of canopy Tr and canopy evaporation, however, was regionally offset by decreasing soil evaporation, and led to lower ET for the nitrogen fertilization effect. Nonetheless, miner-alized nitrogen in the rooting system was governed by not only the amount of deposited N, but also by leach-ing and denitrification, which are affected by environ-mental conditions (Hovenden et al 2014). This
highlights the necessity of better understanding the interactions among these environmental drivers, and the underlying mechanisms responsible for biogeo-chemical and hydrologic cycles.
Figure 4. Spatial distribution of trends in(a) precipitation (PRE, mm/yr−2), (b) nitrogen deposition (NDE, mg N m−2yr−2), (c) fractional tree coverage(TREE, %/yr−2), and (d) fractional crop coverage (CROP, %/yr−2) over the period 1982–2010, and spatial distribution of dominant climatic variable(precipitation, temperature (TEM) and incident solar radiation (RAD)) responsible for (e) ET variability, and(f) both variability and trend. For (e), the dominance was derived by comparing the R2of the partial correlations
between detrended ET and individual climatic factor. For(f), the dominance was derived by comparing the R2of the partial correlations between un-detrended ET and individual climatic factor. Both(e) and (f) share the same color legend in (f).
Previous modeling studies(Boisier et al2012,2014, Shi et al2013, Sterling et al2013, Tao et al2014) agree
with our results that anthropogenic activities modified ET and its components locally, and human-induced LUC effects tended to counteract each other at a global scale. We found large uncertainties associated with LUC impacts among the MsTMIP LSMs, particularly over the NH and areas having marked land cover con-versions. Though based on the same merged LUC dataset, different LSM groups prescribed the dynamic evolution of plant functional types with model-spe-cific classifications (Wei et al2014a,2014b). The
sensi-tivity of biophysical and biogeochemical processes to the reconstructed historical scenario of LUC, more-over, varied considerably from model to model (Huntzinger et al2013). For example, for the SIB3-JPL
models, abnormally higher LUC ET was simulated over the NH and global land compared to that of other models(figure S6). In SIB3-JPL, ET is a function of stomatal conductance and is sensitive to changes in photosynthetically active radiation (PAR). In LUC simulations, plant functional type changes over time, but the PAR is prescribed from present day NDVI cli-matology and is thusfixed to modern vegetation. This can lead to a bias in gross primary production in cases where grasslands are converted to forests, since the NDVI and resulting fraction of incident PAR absorbed by green leaving in the canopy(fPAR) are calculated from a modern day forest ecosystem but used to esti-mate stomatal conductance and ET for the historical grassland it replaced. The sensitivity to land-use change and cultivated ecosystems(e.g., irrigated crop-lands) reinforce the need for better LUC characteriza-tion, improved parameterization of ET in croplands, and the development of forcing datasets(e.g., PAR) that are not artificially dependent upon land cover. Improvements in these areas may help reduce the large inter-model spreads in the responses of ET to LUC.
Quantitative estimation of ET partitioning has been refined recently, but information on long-term variations and the precise drivers of each ET compo-nent are lacking(Jasechko et al2013, Wang et al2014).
By using a multi-model ensemble, we assessed the annual trends of the Tr and ET–Tr over nearly three decades, and further estimated their spatial-temporal responses to various environmental stresses. These modeled results, however, remain rather uncertain without observational constrains that are sufficiently long and representative. Comprehensive synthesis of long-term observation-constrained ET components is needed to improve our understanding of the control-ling mechanisms, and to better characterize the parti-tioning schemes.
5. Conclusions
The relative contribution of climate and anthropo-genic activities to the spatio-temporal changes in ET
was quantitatively characterized with the newly-merged ET and multifactor ensemble simulations from MsTMIP. In the LSMs, climate, CO2, nitrogen
deposition, and land use impacts were separated experimentally to determine the ET variations between 1982 and 2010. Climate, and in particular, changes in precipitation, was the dominant control of multi-year ET trends and variability. The overall CO2
physiological and structural effect induced decreasing plants transpiration and the total ET, especially in areas where vegetation was dense. Compared to climate change and the elevated CO2 effects, the
impacts of nitrogen deposition and land use change on ET were less important and acted locally. Other detailed explorations are needed, such as the imple-mentation of more compelling statistical techniques and fully-coupled modeling systems (Douville et al2013, Wu et al2013, Gedney et al2014) to detect
and attribute the natural and anthropogenic effects on ET with more certainty. ET-related feedback studies are also required to account for land-atmosphere interactions and anthropogenic impacts in the inte-grated earth system models(Seneviratne et al2010, Bond-Lamberty et al 2014, Collins et al2015) and to
understand future trajectories of drought (Sheffield et al 2012, Zarch et al 2015). Given that human
activities continue to grow and intensify in the Anthropocene Epoch, we emphasize utilizing multi-stream datasets and multi-modeling frameworks to better diagnose and project anthropogenic influences on terrestrial ET, hydrologic cycle and overall climate change.
Acknowledgments
This research was supported partially by the Terrestrial Ecosystem Science Scientific Focus Area (SFA), which is sponsored by the Terrestrial Ecosystem Science (TES) Program in the Climate and Environmental Sciences Division (CESD) of the Biological and Environmental Research Program in the US Depart-ment of Energy Office of Science. This research was supported partially by the Biogeochemistry–Climate Feedbacks SFA and project under contract of DE-SC0012534, which are both sponsored by the Regional and Global Climate Modeling(RGCM) Program in the Climate and Environmental Sciences Division (CESD) of the Biological and Environmental Research Program in the US Department of Energy Office of Science. CRS was supported by National Aeronautics and Space Administration (NASA) Grants #NNX12AP74G, #NNX10AG01A, and #NNX11AO08A. JBF carried out this research at the Jet Propulsion Laboratory, California Institute of Technology, under a contract with NASA. Funding for the Multi-scale synthesis and Terrestrial Model Inter-comparison Project(MsTMIP,http://nacp.ornl.gov/
MsTMIP.shtml) activity was provided through NASA
9
ROSES Grant #NNX10AG01A. Data management support for preparing, documenting, and distributing model driver and output data was performed by the Modeling and Synthesis Thematic Data Center at Oak Ridge National Laboratory(ORNL,http://nacp.ornl.
gov), with funding through NASA ROSES Grant
#NNH10AN681. Finalized MsTMIP data products are archived at the ORNL DAAC (http://daac.ornl.
gov). This is MsTMIP contribution #5.
Acknowledgments for specific MsTMIP partici-pating models:
Biome-BGC: Biome-BGC code was provided by the Numerical Terradynamic Simulation Group at University of Montana. The computational facilities provided by NASA Earth Exchange at NASA Ames Research Center.
CLASS-CTEM-N+: This research was funded by the Natural Sciences and Engineering
Research Council(NSERC) of Canada Discovery and Strategic grants. CLASS and CTEM models were originally developed by the Climate Research Branch and Canadian Centre for Climate Modelling and Ana-lysis(CCCMa) of Environment Canada, respectively.
CLM: This research is supported in part by the US Department of Energy(DOE), Office of Science, Bio-logical and Environmental Research. Oak Ridge National Laboratory is managed by UT-Battelle, LLC for DOE under contract DE-AC05-00OR22725.
CLM4VIC: CLM4VIC simulations were sup-ported in part by the US Department of Energy(DOE), Office of Science, Biological and Environmental Research(BER) through the Earth System Modeling program, and performed using the Environmental Molecular Sciences Laboratory(EMSL), a national sci-entific user facility sponsored by the U.S.DOE-BER and located at Pacific Northwest National Laboratory (PNNL). Participation of M Huang in the MsTMIP synthesis is supported by the U.S.DOE-BER through the Subsurface Biogeochemical Research Program (SBR) as part of the SBR Scientific Focus Area (SFA) at the Pacific Northwest National Laboratory (PNNL). PNNL is operated for the US DOE by BATTELLE Memorial Institute under contract DE-AC05-76RLO1830.
DLEM: The Dynamic Land Ecosystem Model (DLEM) developed in the International Center for Cli-mate and Global Change Research at Auburn Uni-versity has been supported by NASA Interdisciplinary Science Program(IDS), NASA Land Cover/Land Use Change Program(LCLUC), NASA Terrestrial Ecology Program, NASA Atmospheric Composition Modeling and Analysis Program(ACMAP); NSF Dynamics of Coupled Natural-Human System Program (CNH), Decadal and Regional Climate Prediction using Earth System Models (EaSM); DOE National Institute for Climate Change Research; USDA AFRI Program and EPA STAR Program.
Integrated Science Assessment Model (ISAM) simulations were supported by the US National
Science Foundation (AGS-12-43071 and NSF-EFRI-083598), the USDA National Institute of Food and Agriculture(NIFA) (2011-68002-30220), the US Department of Energy(DOE) Office of Science (DOE-DE-SC0006706) and the NASA Land cover and Land Use Change Program(NNX14AD94G). ISAM simula-tions were carried out at the National Energy Research Scientific Computing Center (NERSC), which is sup-ported by the Office of Science of the US Department of Energy under contract DE-AC02-05CH11231, and at the Blue Waters sustained-petascale computing, University of Illinois at Urbana- Champaign, which is supported by the National Science Foundation (awards OCI-0725070 and ACI-1238993) and the state of Illinois.
LPJ-wsl: This work was conducted at LSCE, France, using a modified version of the LPJ version 3.1 model, originally made available by the Potsdam Insti-tute for Climate Impact Research.
ORCHIDEE-LSCE: ORCHIDEE is a global land surface model developed at the IPSL institute in France. The simulations were performed with the sup-port of the GhG Europe FP7 grant with computing facilities provided by LSCE(Laboratoire des Sciences du Climat et de l’Environnement) or TGCC (Très Grand Centre de Calcul).
VISIT: VISIT was developed at the National Insti-tute for Environmental Studies, Japan. This work was mostly conducted during a visiting stay at Oak Ridge National Laboratory.
This manuscript has been authored by UT-Bat-telle, LLC under Contract No. DE-AC05-00OR22725 with the US Department of Energy. The United States Government retains and the publisher, by accepting the article for publication, acknowledges that the Uni-ted States Government retains a non-exclusive, paid-up, irrevocable, world-wide license to publish or reproduce the published form of this manuscript, or allow others to do so, for United States Government purposes. The Department of Energy will provide public access to these results of federally sponsored research in accordance with the DOE Public Access
Plan (
http://energy.gov/downloads/doe-public-access-plan).
References
Ainsworth E A and Rogers A 2007 The response of photosynthesis and stomatal conductance to rising(CO2): mechanisms and
environmental interactions Plant, Cell Environ.30 258–70 Badgley G, Fisher J B, Jiménez C, Tu K P and Vinukollu R 2015 On
uncertainty in global evapotranspiration estimates from choice of input forcing datasets J. Hydrometeorol.16 1449–55 Baker I T, Prihodko L, Denning A S, Goulden M, Miller S and
Da Rocha H R 2008 Seasonal drought stress in the amazon: reconciling models and observations J. Geophys. Res. Biogeo. 114 1–10
Bartlett P A, MacKay M D and Verseghy D L 2006 Modified snow algorithms in the Canadian land surface scheme: model runs and sensitivity analysis at three boreal forest stands Atmos. Ocean44 207–22
Betts R A et al 2007 Projected increase in continental runoff due to plant responses to increasing carbon dioxide Nature448 1037–U5
Boisier J P, de Noblet-Ducoudré N, Pitman A J, Cruz F T, Delire C, van Den Hurk B J J M, van der Molen M K, Mueller C and Voldoire A 2012 Attributing the impacts of land-cover changes in temperate regions on surface temperature and heatfluxes to specific causes: results from the first LUCID set of simulations J. Geophys. Res. Atmos.117 D12116
Boisier J P, de Noblet-Ducoudré N and Ciais P 2014 Historical land-use induced evapotranspiration changes estimated from present-day observations and reconstructed land-cover maps Hydrol. Earth Syst. Sci. Discuss.11 2045–89
Bond-Lamberty B et al 2014 On linking an Earth system model to the equilibrium carbon representation of an economically optimizing land use modelGeosci. Model Devel.7 2545–55 Cao L, Bala G, Caldeira K, Nemani R and Ban-Weiss G 2009 Climate
response to physiological forcing of carbon dioxide simulated by the coupled community atmosphere model(CAM3.1) and community land model(CLM3.0) Geophys. Res. Lett.36 1–5 Chen J, Jonsson P, Tamura M, Gu Z H, Matsushita B and Eklundh L
2004 A simple method for reconstructing a high-quality NDVI time-series data set based on the Savitzky–Golay filter Remote Sens. Environ.91 332–44
Collins W D et al 2015 The integrated Earth system model(iESM): formulation and functionality Geosci. Model Dev. Discuss.8 381–427
Douville H, Ribes A, Decharme B, Alkama R and Sheffield J 2013 Anthropogenic influence on multidecadal changes in reconstructed global evapotranspiration Nat. Clim. Change3 59–62
Durack P J, Wijffels S E and Matear R J 2012 Ocean salinities reveal strong global water cycle intensification during 1950–2000 Science336 455–8
Fisher J B, Tu K P and Baldocchi D D 2008 Global estimates of the land-atmosphere waterflux based on monthly AVHRR and ISLSCP-II data, validated at 16 FLUXNET sites Remote Sens. Environ.112 901–19
Fisher J B, Whittaker R and Malhi Y 2011 ET come home: potential evapotranspiration in geographical ecology Glob. Ecology Biogeography20 1–18
Gedney N, Cox P M, Betts R A, Boucher O, Huntingford C and Stott P A 2006 Detection of a direct carbon dioxide effect in continental river runoff records Nature439 835–8
Gedney N, Huntingford C, Weedon G P, Bellouin N, Boucher O and Cox P M 2014 Detection of solar dimming and brightening effects on Northern hemisphere riverflow Nature Geosci.7 796–800
Gerten D 2013 A vital link: water and vegetation in the anthropocene Hydrol. Earth Syst. Sci.17 3841–52
Gerten D, Rost S, von Bloh W and Lucht W 2008 Causes of change in 20th century global river discharge Geophys. Res. Lett.35 1–5 Gupta S K 1983 A radiative transfer model for surface radiation
budget studies J. Quant. Spectrosc. Radiat. Trans.29 419–27 Held I M and Soden B J 2006 Robust responses of the hydrological
cycle to global warming J. Clim.19 5686–99
Hovenden M J, Newton P C D and Wills K E 2014 Seasonal not annual rainfall determines grassland biomass response to carbon dioxide Nature511 583–6
Huang S, Arain M A, Arora V K, Yuan F, Brodeur J and Peichl M 2011 Analysis of nitrogen controls on carbon and water exchanges in a conifer forest using the CLASS-CTEM N+ model Ecol. Modell.222 3743–60
Huntington T G 2006 Evidence for intensification of the global water cycle: review and synthesis J. Hydrol.319 83–95 Huntzinger D N et al 2013 The North American carbon program
multi-scale synthesis and terrestrial model intercomparison project—:1. Overview and experimental design Geosci. Model Dev.6 2121–33
Huntzinger D N et al 2015 NACP MsTMIP: Global 0.5-deg Terrestrial Biosphere Model Outputs(version 1) in Standard Format(Tennessee, USA: Oak Ridge National Laboratory
Distributed Active Archive Center, Oak Ridge) data set (http://daac.ornl.gov)
Hurtt G C et al 2011 Harmonization of land-use scenarios for the period 1500–2100: 600 years of global gridded annual land-use transitions, wood harvest, and resulting secondary lands Clim. Change109 117–61
Ito A and Inatomi M 2012 Use of a process-based model for assessing the methane budgets of global terrestrial ecosystems and evaluation of uncertaintyBiogeosci.9 759–73
Jain A K, Kheshgi H S and Wuebbles D J 1996 A globally aggregated reconstruction of cycles of carbon and its isotopes Tellus B48 583–600
Jasechko S, Sharp Z D, Gibson J J, Birks S J, Yi Y and Fawcett P J 2013 Terrestrial waterfluxes dominated by transpiration Nature 496 347–50
Jiménez C, Prigent C and Aires F 2009 Toward an estimation of global land surface heatfluxes from multisatellite observations J. Geophys. Res.114 D06305
Jonsson P and Eklundh L 2004 TIMESAT—a program for analyzing time-series of satellite sensor data Comput. Geosci.30 833–45
Johhnson F and Sharma A 2010 A Comparison of Australian open water body evaporation trends for current and future climates estimated from class A evaporation pans and general circulation models J. Hydrometeorol.11 105–21
Jung M, Henkel K, Herold M and Churkina G 2006 Exploiting synergies of global land cover products for carbon cycle modeling Remote Sens. Environ.101 534–53
Jung M, Reichstein M and Bondeau A 2009 Towards global empirical upscaling of FLUXNET eddy covariance observations: validation of a model tree ensemble approach using a biosphere model Biogeosciences Discuss.6 5271–304 Jung M et al 2010 Recent decline in the global land
evapotranspiration trend due to limited moisture supply Nature467 951–4
Kim Y, Kimball J S, McDonald K C and Glassy J 2011 Developing a global data record of daily landscape freeze/thaw status using satellite passive microwave remote sensing IEEE Trans. Geosci. Remote49 949–60
Kim Y, Kimball J S, Zhang K and McDonald K C 2012 Satellite detection of increasing Northern hemisphere non-frozen seasons from 1979 to 2008: implications for regional vegetation growth Remote Sens. Environ.121 472–87 Krinner G, Viovy N, de Noblet-Ducoudré N, Ogée J, Polcher J,
Friedlingstein P, Ciais P, Sitch S and Prentice I C 2005 A dynamic global vegetation model for studies of the coupled atmosphere–biosphere system Glob. Biogeochem. Cycles19 1–33
Kurc S A and Small E E 2007 Soil moisture variations and ecosystem-scalefluxes of water and carbon in semiarid grassland and shrubland Water Resour. Res.43 W06416 Lawrence D M, Thornton P, Oleson K W and Bonan G B 2007 The
partitioning of evapotranspiration into transpiration, soil evaporation, and canopy evaporation in a gcm: impacts on land–atmosphere interaction J. Hydrometeorol.8 862–80 Leakey A D B, Ainsworth E A, Bernacchi C J, Rogers A, Long S P and
Ort D R 2009 Elevated CO2effects on plant carbon, nitrogen,
and water relations: six important lessons from FACE J. Exp. Bot.60 2859–76
Lei H, Huang M, Leung L R, Yang D, Shi X, Mao J, Hayes D J, Schwalm C, Wei Y and Liu S 2014a Sensitivity of global terrestrial gross primary production to hydrologic states simulated by the community land model using two runoff parameterizations J. Adv. Model. Earth Syst.6 658–79 Lei H, Yang D and Huang M 2014b Impacts of climate change and
vegetation dynamics on runoff in the mountainous region of the Haihe River basin in the pastfive decades J. Hydrol.511 786–99
Lei H, Yang D, Yang H, Yuan Z and Lv H 2014c Simulated impacts of irrigation on evapotranspiration in a strongly exploited region: a case study of the Haihe River Basin China Hydrol. Process.29 2704–19
11
Leipprand A and Gerten D 2006 Content on evapotranspiration, soil moisture and runoff under potential natural vegetation Hydrol. Sci. J.51 171–85
Leng G, Huang M, Tang Q, Sacks W J, Lei H and Leung L Y R 2013 Modeling the effects of irrigation on land surfacefluxes and states over the conterminous United States: sensitivity to input data and model parameters J. Geophys. Res.-Atmos.118 9789–803
Leng G, Huang M, Tang Q, Gao H and Leung L Y R 2014a Modeling the effects of groundwater-fed irrigation on terrestrial hydrology over the conterminous United States J. Hydrometeorol.15 957–72
Leng G, Tang Q, Huang M and Leung L R 2014b A comparative analysis of the impacts of climate change and irrigation on land surface and subsurface hydrology in the North China plain Reg. Environ. Change15 251–63
Liu M, Tian H, Lu C, Xu X, Chen G and Ren W 2012 Effects of multiple environment stresses on evapotranspiration and runoff over Eastern China J. Hydrol.426–7 39–54 Lo M H and Famiglietti J S 2013 Irrigation in California’s central
valley strengthens the Southwestern US water cycle Geophys. Res. Lett.40 301–6
Mao J, Thornton P E, Shi X, Zhao M and Post W M 2012 Remote sensing evaluation of CLM4 GPP for the period 2000–09 J. Clim.25 5327–42
Miralles D G, Holmes T R H, De Jeu R A M, Gash J H,
Meesters A G C A and Dolman A J 2011 Global land-surface evaporation estimated from satellite-based observations Hydrol. Earth Syst. Sci.15 453–69
Miralles D G et al 2014 El Niño–La Niña cycle and recent trends in continental evaporation Nat. Clim. Change4 122–6 Mueller B et al 2011 Evaluation of global observations-based
evapotranspiration datasets and IPCC AR4 simulations Geophys. Res. Lett.38 L06402
Mueller B et al 2013 Benchmark products for land
evapotranspiration: LandFlux-EVAL multi-data set synthesis Hydrol. Earth Syst. Sci.17 3707–20
Peng C, Ma Z, Lei X, Zhu Q, Chen H, Wang W, Liu S, Li W, Fang X and Zhou X 2011 A drought-induced pervasive increase in tree mortality across Canada’s boreal forests Nat. Clim. Change1 467–71
Piao S, Friedlingstein P, Ciais P, de Noblet-Ducoudré N, Labat D and Zaehle S 2007 Changes in climate and land use have a larger direct impact than rising CO2on global river
runoff trends Proc. Natl Acad. Sci. USA104 15242–7 Pinzon J and Tucker C 2014 A non-stationary 1981–2012 AVHRR
NDVI3g time series Remote Sens.6 6929–60
Polhamus A M, Fisher J B and Tu K P 2012 What controls the error structure in evapotranspiration models? Agric. Forest Meteorol.169 12–24
Schaefer K, Collatz G J, Tans P, Denning A S, Baker I, Berry J, Prihodko L, Suits N and Philpott A 2008 Combined simple biosphere/carnegie-ames-stanford approach terrestrial carbon cycle model J. Geophys. Res. Biogeo.113 G03034
Schaefer K, Zhang T, Slater A G, Lu L, Etringer A and Baker I 2009 Improving simulated soil temperatures and soil freeze/thaw at high-latitude regions in the simple biosphere/carnegie ames-stanford approach model J. Geophys. Res. Earth Surf. 114 F02021
Schwalm C R, Huntinzger D N, Michalak A M, Fisher J B, Kimball J S, Mueller B, Zhang K and Zhang Y 2013 Sensitivity of inferred climate model skill to evaluation decisions: a case study using CMIP5 evapotranspiration Environ. Res. Lett.8 024–8
Seneviratne S I, Lüthi D, Litschi M and Schär C 2006 Land-atmosphere coupling and climate change in Europe Nature 443 205–9
Seneviratne S I, Corti T, Davin E L, Hirschi M, Jaeger E B, Lehner I, Orlowsky B and Teuling A J 2010 Investigating soil moisture– climate interactions in a changing climate: a review Earth-Science Rev.99 125–61
Sheffield J, Goteti G and Wood E F 2006 Development of a 50-year high-resolution global dataset of meteorological forcings for land surface modeling J. Climate19 3088–111
Sheffield J, Wood E F and Munoz-Arriola F 2010 Long-term regional estimates of evapotranspiration for Mexico based on downscaled ISCCP data J. Hydrometeorol.11 253–75 Sheffield J, Wood E F and Roderick M L 2012 Little change in global
drought over the past 60 years Nature491 435–8
Shi X, Mao J, Thornton P E, Hoffman F M and Post W M 2011 The impact of climate, CO2, nitrogen deposition and land use
change on simulated contemporary global riverflow Geophys. Res. Lett.38 L08704
Shi X, Mao J, Thornton P E and Huang M 2013 Spatiotemporal patterns of evapotranspiration in response to multiple environmental factors simulated by the community land model Environ. Res. Lett.8 024012
Sitch S et al 2003 Evaluation of ecosystem dynamics, plant geography and terrestrial carbon cycling in the LPJ dynamic global vegetation model Glob. Change Biol.9 161–85 Sitch S, Cox P M, Collins W J and Huntingford C 2007 Indirect
radiative forcing of climate change through ozone effects on the land-carbon sink Nature448 791–4
Sterling S M, Ducharne A and Polcher J 2013 The impact of global land-cover change on the terrestrial water cycle Nat. Clim. Change3 385–90
Swenson S C and Lawrence D M 2014 Assessing a dry surface layer-based soil resistance parameterization for the community land model using GRACE and FLUXNET-MTE data J. Geophys. Res.-Atmos.119 299–312
Tao B, Tian H, Ren W, Yang J, Yang Q, He R, Cai W and Lohrenz S 2014 Increasing Mississippi river discharge throughout the 21st century influenced by changes in climate, land use, and atmospheric CO2Geophys. Res. Lett.41 4978–86
Tian H, Xu X, Lu C, Liu M, Ren W, Chen G, Melillo J and Liu J 2011 Net exchanges of CO2, CH4, and N2O between China’s
terrestrial ecosystems and the atmosphere and their contributions to global climate warming J. Geophys. Res. Biogeosci.116 G02011
Tian H et al 2012 Century-scale responses of ecosystem carbon storage andflux to multiple environmental changes in the Southern United States Ecosystems15 674–94
Teuling A J et al 2009 A regional perspective on trends in continental evaporation Geophys. Res. Lett.36 L02404
Thornton P E et al 2002 Modeling and measuring the effects of disturbance history and climate on carbon and water budgets in evergreen needleleaf forests Agric. For. Meteorol.113 185–222
Trenberth K E, Fasullo J T and Kiehl J 2009 Earth’s global energy budget Bull. Am. Meteorol. Soc.90 311–23
Ukkola A M and Prentice I C 2013 A worldwide analysis of trends in water-balance evapotranspiration Hydrol. Earth Syst. Sci.17 4177–87
Vinukollu R K, Meynadier R, Sheffield J and Wood E F 2011 Multi-model, multi-sensor estimates of global evapotranspiration: climatology, uncertainties and trends Hydrol. Process.25 3993–4010
Wang K C, Wang P, Li Z Q, Cribb M and Sparrow M 2007 A simple method to estimate actual evapotranspiration from a combination of net radiation, vegetation index, and temperature J. Geophys. Res.112 D15107
Wang K C, Dickinson R E, Wild M and Liang S 2010 Evidence for decadal variation in global terrestrial evapotranspiration between 1982 and 2002: 2 results J. Geophys. Res.115 D20113 Wang K C and Dickinson R E 2012 A review of global terrestrial
evapotranspiration: observation, modelling, climatology, and climatic variability Rev. Geophys.50 RG2005
Wang L, Good S P and Caylor K K 2014 Global synthesis of vegetation control on evapotranspiration partitioning Geophys. Res. Lett.41 6753–7
Wei Y et al 2014a The North American carbon program multi-scale synthesis and terrestrial model intercomparison project: II. Environmental driver data Geosci. Model Dev.7 2875–93
Wei Y et al 2014b NACP MsTMIP: Global and North American Driver Data for Multi-Model Intercomparison(Tennessee, USA: Oak Ridge National Laboratory Distributed Active Archive Center, Oak Ridge) data set (http://daac.ornl.gov) Willmott C J, Rowe C M and Mintz Y 1985 Climatology of the
seasonal terrestrial water cycle J. Climatol.5 589–606 Wu P, Christidis N and Stott P 2013 Anthropogenic impact on
Earth’s hydrological cycle Nat. Clim. Change3 807–10 Zarch M A A, Sivakumar B and Sharma A 2015 Droughts in a warming climate: a global assessment of standardised precipitation index(SPI) and reconnaissance drought index (RDI) J. Hydrol.526 183–95
Zeng N, Mariotti A and Wetzel P 2005 Terrestrial mechanisms of interannual CO2variability Glob. Biogeochem. Cycles19
GB1016
Zeng Z, Piao S, Lin X, Yin G, Peng S, Ciais P and Myneni R B 2012 Global evapotranspiration over the past three decades: estimation based on the water balance equation combined with empirical models Environ. Res. Lett.7 014026
Zhang K, Kimball J S, Nemani R R and Running S W 2010a A continuous satellite-derived global record of land surface evapotranspiration from 1983 to 2006 Water Resour. Res.46 W09522
Zhang Y, Leuning R, Hutley L B, Beringer J, McHugh I and Walker J P 2010b Using long-term water balances to parameterize surface conductances and calculate evaporation at 0.05° spatial resolution Water Resour. Res.46 W05512 Zhang Y, Leuning R, Chiew F H S, Wang E, Zhang L, Liu C, Sun F,
Peel M C, Shen Y and Jung M 2012 Decadal trends in evaporation from global energy and water balances J. Hydrometeorol.13 379–91
13