Adaptive Consolidation of Computational Perspectives
byMatthew C. Sither
Submitted to the Department of Electrical Engineering and Computer Science
in partial fulfillment of the requirements for the degree of
Master of Engineering in Computer Science and Engineering
at the
MASSACHUSETTS INSTITUTE OF TECHNOLOGY May 26, 2006
© 2006 Massachusetts Institute of Technology. All rights reserved.
The author hereby grants to M.I.T. permission to reproduce and distribute publicly paper and electronic copies of this thesis
and to grant others the right to do so.
... Department of Electrical Engineering and Computer Science May 26, 2006 Certified by. A'I A ccepted by... Chairman, Department C ... k H. Winston 3cience, MIT is Supervisor ... 1-.thur C. Smith ommittee on Graduate Theses
BARKER
AuthorMASSACHUSETTS INSTITUTE OF TECHNOLOGY
AUG 14
2006
Adaptive Consolidation of Computational Perspectives
byMatthew C. Sither
Submitted to the
Department of Electrical Engineering and Computer Science
May 26, 2006
In partial fulfillment of the requirements for the degree of
Master of Engineering in Computer Science and Engineering
ABSTRACT
This thesis describes the design and implementation of machine learning algorithms and real-time recommendations within EWall, a software system used for individual and collaborative information management. In the EWall workspace, users collect and arrange cards, which are compact visual abstractions of information. A significant
problem that often arises when humans try to collect information is information overload. Information overload refers to the state of having too much information, and it causes difficulty in discovering relevant information. When affected by information overload, the user loses focus and spends more time filtering out irrelevant information. This thesis first presents a simple solution that uses a set of algorithms that prioritize information. Based on the information the user is working with, the algorithms search for relevant information in a database by analyzing spatial, temporal, and collaborative relationships. A second, more adaptive solution uses agents that observe user behavior and learn to apply the prioritization algorithms more effectively. Adaptive agents help to prevent information overload by removing the burden of search and filter from the user, and they hasten the process of discovering interesting and relevant information.
Thesis Supervisor: Patrick H. Winston
Acknowledgements
I would like to thank Patrick Winston for igniting my interest in artificial intelligence. I've always been curious about psychology, and Patrick's teachings about the Human Intelligence Enterprise motivated me to apply my computational skills to this curiosity.
I would like to thank Paul Keel for giving me endless opportunities with the EWall project. He has constantly provided me with direction and structure in my research, while at the same time, encouraging me to think creatively and faithfully allowing me to toy with my own ideas.
I would like to thank my parents, Barb and Benn, and my sister, Becky, for a lifetime of ridiculously unconditional encouragement and generosity. They make it impossible to believe that life has any limits. Thanks to Dad, a math teacher, a carpenter, an artist, and a musician, I know that learning never stops. Thanks to Mom, possibly the most
accommodating and caring person I have ever met, I know the importance of kindness and manners. And thanks to Becky, a loyal sidekick for an entire childhood, I truly appreciate the value of genuine friendship. Without these things, I couldn't have come this far.
Finally, I thank and owe so much to April. Despite the enormous time commitment and work required to survive MIT, April worked hard to prevent frustration and stress from entering my life. Whenever I forget that there's more to life than school and work, April reminds me. I can only hope that as I graduate and she goes back to school this fall, I can return the favor.
Contents
Chapter 1 Introduction... 12
Chapter 2 Background... 17
2.1 A bstraction... .. 17
2.2 D ata M anagem ent... 18
2.3 Com putational A gents... 19
2.4 Recom m endations... ... 20 C hapter 3 EW all... ... ... 23 3.1 EW all Philosophy... 23 3.2 Cards... .. 24 3.3 M odules... ... 26 3.3.1 W orkspace M odule... 26 3.3.2 D atabase M odule... 28 Chapter 4 A gents...-. 33 4.1 Traditional A gents... 34 4.2 EW all A gents... 35 4.2.1 Storage A gent... 36 4.2.2 Search A gent... 40 4.2.3 Prioritization Agent... 44 4.3 A gent Collaboration... 50 Chapter 5 Intelligence... .... ... 52 5.1 N on-adaptive A lgorithm ... 52 5.2 Linear Regression... 53
5.3 Feedback and Perform ance M etric... 55
5.4 Learning w ith G enetic A lgorithm s... 57
Chapter 6 Im plem entation... 64
6.1 U ser Interface... 64
6.2 D ata Storage... 65
6.4 Intelligence... 70
6.4.1 Regression... 71
Chapter 7 Conclusion... 75
7.1 Contributions... 75
7.2 Future Extensions... 86
7.2.1 Intelligent Storage Agents... 77
7.2.2 Im proved Genetic A lgorithm ... 77
7.2.3 New Data Types in the Genetic Tree... 77
List of Figures
Figure 1.1: Google's PageRank (as seen at www.mit.edu)... 13
Figure 1.2: Amazon.com Recommendations Page (www.amazon.com)... 14
Figure 2.1: Abstraction Architecture... 18
Figure 2.2: Java Database Connectivity (JDBC) Architecture... 19
Figure 3.1: Card Architecture... 24
Figure 3.2: Workspace: Collecting and Arranging Cards... 27
Figure 3.3: Database Server... 29
Figure 3.4: Database View: Connection Settings... 30
Figure 3.5: Database View: Display... 31
Figure 4.1: Agent Committee Architecture... 33
Figure 4.2: Agent Architecture... 34
Figure 4.3: EWall Agent Architecture... 35
Figure 4.4: Spatial Links... 38
Figure 4.5: Temporal Links... 39
Figure 4.6: Storage Agent Algorithms... 40
Figure 4.7: Search Agent Algorithms... 41
Figure 4.8: Roadmap of a Small Database... 43
Figure 4.9: Weight Algorithm Pseudocode... 45
Figure 4.10: Centrality Algorithm Pseudocode... 45
Figure 4.11: Balance Algorithm Pseudocode... 46
Figure 4.12: Distance Algorithm Pseudocode... 46
Figure 4.13: Group Algorithm Pseudocode... 47
Figure 4.14: Age Algorithm Pseudocode... 47
Figure 4.15: Popularity Algorithm Pseudocode... 48
Figure 4.16: Prioritization Agent Algorithms... 49
Figure 4.17: Algorithm Weighting and Scoring... 49
Figure 5.2: Linear Regression in M atrix Form... 54
Figure 5.3: Feedback Architecture... 56
Figure 5.4: Learning Algorithm Pseudocode... 57
Figure 5.5: Genetic Tree forf(x) = x*(x+])+] = x2 +x+1... 59
Figure 5.6: Genetic Algorithm Example [3]... 61
Figure 6.1: EW all User Interface... 65
Figure 6.2: XM L W orkspace File Format... 66
Figure 6.3: EW all Database Architecture... 67
Figure 6.4: DBConnection Class... 68
Figure 6.5: DBFeeder Class... 69
Figure 6.6: Event-Driven Architecture... 71
List of Tables
Table 4-1: Storage Algorithms... 37
Table 4-2: Prioritization Algorithms... 44
Table 6-1: SQL Format [11]... 68
Chapter 1
Introduction
Public information access has exploded recently. Through the popularization of the internet and the constant conversion of paper documents to electronic documents, people can perform practically any task online. The computer is an excellent information storage medium, and built into the computer, we have tools for managing this information: software. Most of these tools provide us with the ability to manually
perform tasks in collecting and managing information. To improve these tools, I propose the following question: How many of these tasks can we automate? This thesis explores the automation of two such tasks: search and filter. Software with such embedded automation can help to significantly decrease the amount of time we spend completing tasks by relieving us from the burden of searching for information and filtering out irrelevant details.
If automated software is to help us work faster, then we must first figure out what tasks are the most time-consuming, and of the most time-consuming tasks, figure out what can be automated. Most tasks performed over the internet involve some kind of search. A directed search is usually simple. A user might look for driving directions, and if he knows the start and end addresses, then the task requires little time. But most searches are less well formed. For example, consider a user who has entered a search for an apartment on a classifieds web site. Many of the results may be what she is looking for, but many unwanted results will probably appear due to keyword matching or other search metrics. She must spend extra time filtering out the irrelevant results. In order to help the user to perform search-oriented tasks faster, automated software could prioritize the results before displaying them to the user.
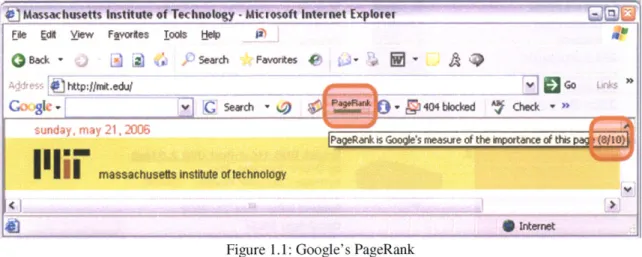
Some software performs automated filtering already. For example, Google searches based on user-provided keywords, but it prioritizes the search results based on a relevance measure, called PageRank [2], as highlighted in Figure 1.]. This generally forces the results that the user will more likely find to be important to the top of the list. Imagine the alternative, where the user must sift through hundreds, or even thousands, of results.
O) Massachusetts Instftute of Technology -Mcrosoft taternet Explorer
Ee Fdl yiew Fvortes jo0ts t* lp
QBack ~ Sarch Favorkes 9;1
Co SIC - GSearch - )-9Mt a
fcheck-sunday , may 21, 2006 POfak5 oges esr the it~ance of this a8jj
massachusetts insttute ortechnology
Figure 1.1: Google's PageRank
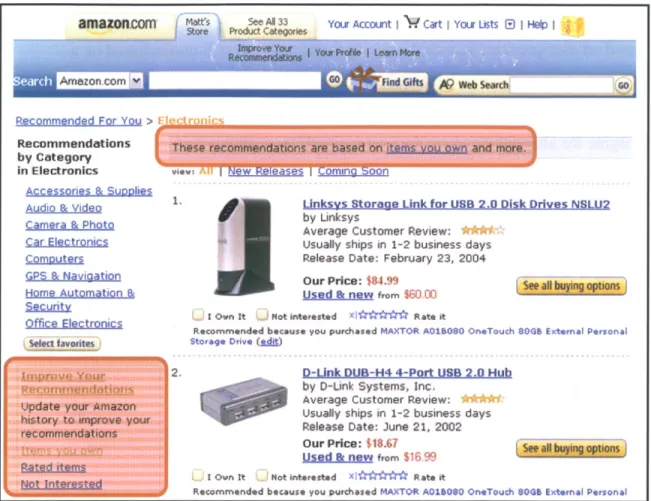
Another form of automated filtering is real-time recommendation, which is implemented by many shopping web sites. For example, Amazon.com users primarily search and browse the inventory. But Amazon also provides a recommendation system, as seen in
Figure 1.2. The recommendation software tracks users' purchase history, as highlighted in Figure 1.2, and adapts itself to provide better recommendations in the future.
Adaptive recommendation algorithms are not exclusively applicable to online shopping. They can enhance the performance of any search-based tasks, including shopping, research, and online collaboration.
amaznncom'
mat5 See Al 33 Your Account Cart I You Lusts E) I Help IRecommended For You >
Recommendations
by Category
in Electronics vie
Accessories & Suoplies
Audio & video1
Camera & Photo
Car Electronics
Compt~jters
GPS & Navigation
Home Automation &
aegyrity
Office Electronics
Select favorites
2.
Linksys Storage Link for USB 2.0 Disk Drives NSLU2
by Linksys
Average Customer Review:
Usually ships in 1-2 business days
Release Date: February 23, 2004
Our Price: $84.99
used l new from $60-00 I Own It Not interested xMr ' Rate it
Recommended because you purchased MAXTOR A01B0SO OneTouch 80G8 External Personal
Storage Drive (sdu)
D-Unk DUB-H4 4-Port US 2.0 Hub
by D-Unk Systems, Inc.
Average Customer Review: Usually ships in 1-2 business days Release Date: June 21, 2002
Our Price: $18.67
used & new from $16 99 I Own It Not interested Xl***** Rate it
Recommended because you purchased MAXTOR A0160SO OneTouch 06 External Personal
Figure 1.2: Amazon.com Recommendations Page
This thesis addresses the use of adaptive recommendation algorithms as an enhancement to EWall, a networked virtual whiteboard for collecting, arranging, storing, and
exchanging information objects called cards. More specifically, this thesis describes the EWall agent system, an extension that autonomously searches databases and recommends interesting and relevant cards to the user. This system accomplishes the following two goals:
1) Decrease time spent searching by initiating searches without first prompting the user for keywords or other input;
2) Decrease time spent sifting through search results by prioritizing the results before displaying them to the user.
With these goals in mind, I define a recommendation of this context as the result of an automated, prioritized search.
Recommendations in EWall are created by a committee of agents. A search agent crawls a database of interrelated, or linked, cards and then passes the list of results to the agent
committee, which is composed of prioritization agents. Each prioritization agent contains an identical set of prioritization algorithms. One such algorithm is the weight algorithm, which gives priority to cards that are more heavily linked to others. The weight
algorithm alone yields a simple and predictable prioritization pattern. We define an
agent's perspective as the weighted combination of the results of its prioritization
algorithms. After each agent derives a perspective, the committee consolidates all perspectives, and it produces a less predictable and more meaningful prioritization pattern. The last component of the agent committee is the learning algorithm. This component observes the user and responds by adapting each agent's weighted set of algorithms and adapting the overall influence of each agent so that the committee will form a better recommendation in the future.
The remaining chapters of this thesis describe background, EWall, and the design and implementation of EWall agents and the learning component. Chapter 2 describes some basic background that is helpful in understanding this thesis. Chapter 3 describes EWall in detail. Chapter 4 presents the architecture for computational software agents and describes the specifications for EWall agents in particular. Chapter 5 describes EWall intelligence: the current architecture, as well as proposed, enhanced architectures. Chapter 6 describes the implementation strategy of all EWall components. Finally, Chapter 7 presents the contributions of this thesis, as well as proposed extensions.
Chapter 2
Background
This thesis primarily discusses the design and implementation of an intelligent software aid. But first, a decent understanding of more fundamental concepts, such as abstraction and databases, is necessary in understanding this thesis.
2.1
Abstraction
Abstraction is a reduction in a concept's complexity, usually for the purpose of filtering out irrelevant details. In computer science, we use abstraction specifically to derive a good representation for types of information. Although a computer itself is certainly concrete, the programming language built into the computer is an abstraction of the hardware. Low-level machine language, which directly issues instructions to the
hardware, is abstracted into assembly language, which is further abstracted to high-level languages. These high-level abstractions help computer scientists to write software in terms we are familiar with, such as numbers and words, instead of bytes. Repeated abstraction yields more complex data structures, such as lists, tables, strings of characters, and more. This thesis describes software development exclusively in Java, which is a
high-level - highly abstracted - programming language.
A good abstraction is extremely important in designing user interfaces, as well as artificially intelligent systems, because unimportant information wastes valuable resources - screen real estate in user interfaces or time and accuracy in intelligent
systems. Abstraction is especially important in this thesis because the concepts explored here rely heavily on user interfaces, and they primarily concern artificial intelligence.
Figure 2.1 illustrates the abstraction architecture that is vital to this thesis. In this
aspects of the data that it needs. And the data is then abstracted into a visual representation that the user can quickly identify.
SUser Abstraction Artificial Abstraction
\JInterface Intelligence 'Data
Figure 2.1: Abstraction architecture
2.2
Data Management
In 1970, Dr. Edgar F. Codd published A Relational Model of Data for Large Shared Data
Banks, which inspired early development of relational databases. Shortly after this
publication, IBM developed SEQUEL (Structured English Query Language), which later became SQL, as a language for operating such databases. The American National Standards Institute (ANSI) eventually standardized SQL in 1986. The novelty of SQL was originally its readability to humans - well, English speakers at least. SQL defines
keywords like SELECT, for data retrieval, and INSERT, UPDATE, and DELETE, for data
manipulation. These keywords enable people to control large databases in a way that is natural to them. But SQL databases are relevant to this thesis for another reason:
software's ability to interact with them.
As previously mentioned, this thesis primarily concerns Java-based software
development. Sun has defined an API for Java database drivers called Java Database Connectivity, or JDBC. Many JDBC implementations are freely available online. JDBC defines, among others, three essential data structures: Connection, Statement, and
Java Application]
Statement ConnectionJDBC---
Database
ResultSet Figure 2.2: JDBC ArchitectureTo access the database, the application must create a Connection object and use it to connect to the database, given the hostname, port, database name, and a valid username-password pair. statement objects contain the SQL commands. The application sends the statement through the connection and receives a Resuitset, which contains the response to the SQL command. For data retrieval commands, this response contains the data that was asked for; for data manipulation commands, this response generally contains a message indicating whether or not the change was performed successfully.
JDBC provides Java developers with the ability to embed powerful subsystems within
their software. JDBC gives Java applications fast access to a potentially enormous amount of data, locally or across a network. JDBC is especially important to this thesis because autonomous software components can use it to provide users with efficient and intelligent access to a wealth of information.
2.3
Computational Agents
A computational agent, which I will simply refer to as an agent, is an autonomous
program that acts on the user's behalf. An agent generally reacts to some input, or perception, and according to a rule set, it responds with an output, or action. Agents may also initiate an action independent of any perception. The agentfunction, which is the algorithm that decides what action to take, can be quite complex. The agent function
may store relevant information about the agent's state, it may communicate information to other agents, and it may even learn.
Many agent adaptations have arisen with different purposes in mind. These adaptations include:
" Intelligent Agent: An agent that can learn - react to its environment in order to
improve performance - and adapt - react to a changing environment;
" Distributed Agent: An agent that utilizes parallel computing capability, operating in multiple threads;
" Multi-Agent System: Multiple agents that must collaborate because not all tasks or data are available to all agents;
" Mobile Agent: An agent that is able to migrate between computer systems; " Fuzzy Agent: An agent that uses fuzzy logic, a type of logic based in
approximation instead of precision.
This thesis deals with intelligent agents and multi-agent systems. In Chapter 5, Learning, I will draw a more distinct boundary between learning and adaptation in intelligent
agents. An adaptive agent is one whose performance is consistent in a changing environment, and a learning agent is one whose performance tends to increase as time goes on. The intelligent agent plays the most important role in providing the user with accurate recommendations.
2.4 Recommendations
Most people have, at some time, shopped online, and most of us who have shopped online probably noticed that many shopping web sites provide recommendations while
we browse. Recommendations, as described in this thesis, are even more general than the ones we see while shopping. A recommendation is any suggestion made to the user by the computer. Although Amazon's real-time recommendation system serves as the obvious example, other more subtle examples exist.
The snap feature in many user interfaces is one of the most basic examples of a computer-based suggestion. Snapping seems simple to humans. If the user drags a window around and releases it near the edge of the screen, a snap mechanism should set the window position so that its edge lines up flush with the screen's edge. Although this
algorithm is simple enough for humans to understand, the computer has no notion of "near". So we must program a fake notion of "near", a very primitive piece of intelligence, into the software. A simple implementation might have some "near" threshold hard-coded into it, say five pixels, but it is easy to imagine a more complex implementation that might learn a good threshold by observing the user.
Several recommendation mechanisms exist in Microsoft applications. For example, Visio has quite an extensive set of snap mechanisms for connecting and aligning objects in diagrams. Also, an example most of us are familiar with is spell check. Although sometimes a bit overbearing, Word's spell check makes recommendations to users by underlining potentially misspelled words.
This thesis describes new types of recommendation mechanisms. Although these mechanisms have only been implemented within EWall so far, the theory could very easily apply to existing recommendation software like the examples listed above.
Chapter 3
EWall
Humans make decisions everyday. Although most of these decisions are not critical, even our more mundane choices take time and are worth careful analysis. Some
examples of daily decisions are which restaurant to eat at, which route to take home after work, what to buy, and decisions in our daily work tasks. When presented with any of these decisions, we have to consider and evaluate each contributing factor. For example, in deciding where to eat, we have to consider the distance to the restaurant, the type of food, price, and quality of service. Internally, even this seemingly trivial task forces us to examine a wide range of information. Just as computers help us to access and manage information, they can help us make sense of the information and make decisions. This chapter presents EWall in detail. EWall aids users in sense making and decision making
activities. EWall's philosophy is described in Section 3.1. Section 3.2 presents EWall's information abstraction: the card. And Section 3.3 discusses the different EWall
modules.
3.1
EWal Philosophy
All experimentation and software development involved in this thesis occurred within the context of EWall (Electronic Card Wall). EWall is a software application that supports users in sense making activities. The term sense making refers to the process of gathering and understanding information, typically for the purpose of decision making. For
example, a user might use EWall when looking for a new car. The user gathers information on different cars from different dealers and uses EWall to manage and visually arrange this information to more quickly make a decision. Or a group of users collaborating on a school project might use EWall to combine their individual efforts and more quickly make sense of cumulative information.
Unlike other information management tools, like Microsoft Excel or any database tool, EWall visually engages the user. Each piece of information is encapsulated within its own card. The user can arrange multiple cards on a single EWall workspace. Thus two levels of visual stimulation occur. First, a card visually captures a piece of information because, as seen in Figure 3.1, each card has a consistent layout but with different content, most importantly the image area, thus emphasizing the visual representation of the information. The second visual stimulant is the spatial arrangement of the cards. Users can freely drag and resize cards. The key idea is "freedom within a template". EWall provides users with a template - the card - which has a predefined layout and set of components, but users are free to attach any information they want, and they can arrange the cards however they see fit.
3.2
Cards
The most important abstraction in EWall is the card. Also referred to as an information object, the card is designed to represent or reference any type of electronic information. Additionally, the card comes in a very compact visual package. Figure 3.1 shows the architecture of the card and how the visual representation relates to its model.
Reference/
Attachment Location Source
Comments
Expanded Image/Text
DCODE hfy.1.06 :2AM EST
DOC NEWS I Asea-Pacitic I China BBC NEWS I AsIa-Paiet China Timestamp
reitases Panda to the wild reltealfs pandi to he mid
Basic View
Owner Title
Cards have a very clear correspondence between the information they represent and their visual appearance. This is advantageous to an intelligent system because the information is already broken down into simpler, more primitive, components. The following list describes the low-level information components of a card:
" Title: The title occupies the bottom portion of the card and is highlighted to mark its importance. This design matches a user's expectations; icons on the
desktop typically have titles - filenames - underneath them.
" Image: The image occupies the majority of the card and acts as a queue to the user, which triggers recall of the card's underlying information. A familiar implementation of this queue is in desktop icons; we can quickly identify a file's type by simply looking at its icon.
" Reference/Attachment: This smaller icon takes up little space, but it can have a gray, green, or red background. The color acts as a visual queue, indicating whether or not referenced or attached information exists and has been viewed. " Location: Cards can carry location information (coordinates on the globe), and
this small icon becomes green when location information exists.
" Source: Cards can be created on a user's workspace, passed to other users, and they can even connect to online news streams. The source indicates a card's origin.
" Comments: Only the owner of a card can modify most of the information. The comments feature allows any user to add information to a card.
" DCODE: This metric allows users to attach information about credibility and importance of the information.
" Timestamp: This indicates the card's creation date and time.
" Owner: The owner is the person or organization that created the card. The visual components serve as a queue to the user about different aspects of the information, some of which may be more important than others. The computer sees the information the same way, split up into different aspects. As emphasized in Chapters 5,
this modular architecture allows the development of many simple adaptive algorithms instead of a single complex algorithm.
3.3
Modules
EWall has four modules: Workspace, Database, Exchange, and News. The aptly named workspace is the central module, where the user collects and arranges cards. Most of the user's attention and work involves just the workspace. The other three modules are networking modules, which connect the user to online card sources. The database module connects the user to databases full of cards. The exchange module connects the
user to other EWall users' workspaces. And the news module connects the user to online streams of cards, typically in RSS format. This thesis only concerns the workspace and database modules, but there are plans to apply the concepts explored here in the exchange and news modules later.
3.3.1
Workspace Module
Imagine the workspace as a white board, the kind that magnets can be attached to. Next, imagine that cards are magnetized note cards. The user can collect cards from any
source, modify them, and then arrange them on the white board. Figure 3.2 illustrates the workspace and cards from three different sources. Users typically add cards to the
workspace from four types of sources:
1) New Card: User creates a card from scratch (Todo List, in Figure 3.2); 2) Import Existing Card: User drags a card file, with an ewc extension, into the
workspace (Floorplan, in Figure 3.2);
3) Automatic Creation: User drags a file or a URL into the workspace, and EWall automatically converts it to a card (BBC News..., in Figure 3.2); 4) Import from Module: User drags a card into the workspace from a
ji Search Faorese A tt: lInews.bbc.Co.ukW/2/hiaa*1cas/defMstm V Go Sk K sesh - 'R4P 0 GO 0 w --'Above normal' hurricanes in 20 Africa
Ailnerkc4 This year's Atlantic h
Asia-Pacific season will be "above
EumPcif but less severe than
Middle East the US climate agenc
South Asia -Storm debate rages
UK - Animated guide: Hucic
Business <~ ~~ ---SEC NEWS I ScnONturt n A2wbr o Flootplan Anignmont 3 b 3
Due Fladay ut Wedntsday
4Qmewo4 moo
Meting at Stata Dinn.r
Cent..PM. a Sunset Oi1
Monday 7 30. Saturday
0~~~~~ P to9r O ?M
Meetin D BC NEWS I Amonc a I Space
Mestofg i- moved to Ishunch pad
17 rip W To, n 0
Figure 3.2: Workspace: Collecting and Arranging Cards Qe8a & )
A A8
The user can create any arrangement by moving and resizing cards. Additionally, the user can group cards. In Figure 3.2, the cards inside of Todo List are grouped. Both workspaces and individual cards can be saved and loaded to and from the file system.
3.3.2
Database Module
The database module has two components: the database view and the database server. The server runs on the machine that hosts the database, and the client runs as an extension to the workspace on the client machine. The user opens the database view from the Views menu in the workspace and then provides the host, database name, and a valid username-password pair to connect to the server. Once connected, the client begins retrieving cards from the server and displaying them in the database view. The client also sends cards that are on the workspace to the server.
The database server, as illustrated in Figure 3.3, is operated by an administrator. The server interface contains three sections: Server, Databases, and Users. The Server section reports status like the IP address of the host machine. The administrator can also start and stop global access to the MySQL server in this section. The Databases section displays a table of the current databases residing on the host machine. The left column allows the administrator to turn each database on and off, and the other columns provide status information like the database name, status (On, Off, or Error), and the number of cards and links in the database. The bottom section, Users, provides the administrator with the ability to add and remove users, as well as restrict existing users without removing them entirely. The status of each user is also displayed; a user can be Offline,
Online, or Disabled. When a user is logged in, she has the ability to search the database
File Help SERVER IP Address: MySQL Directory. Administrator Username: Administrator Password: Server Status: 192.168.1 .100 c:\mysqc root ___ stop DATABASES ---
-On/Off Name Status Cards Relations
E ewall Active 45 474 locations Active 7 11 movies Active 2 5 RV news Active 223 225 test Active 14 287 test2 Active 21 185 I test3 Active 6 38 USERS --- - --
--On/Off User Password Status
1 Ianonyrous Offline
root *ADDD2CB4BDAOFF83 Offline
Delete
127MB
Figure 3.3: Database Server Add
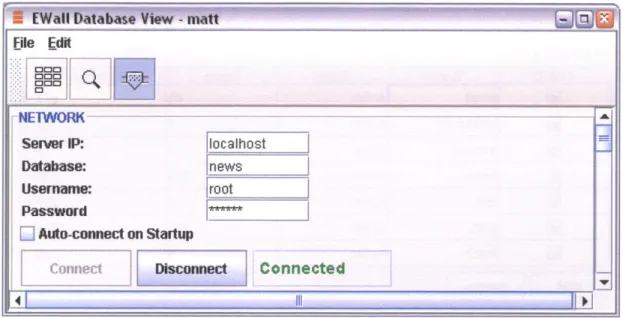
The database view resides on the client side. The database view is not an independent application. The user currently can only open it through the workspace. The user begins using the database view by clicking the third button in the toolbar, as illustrated in Figure
3.4. The user must enter the server's IP, or hostname, the database name, and a valid
username-password pair. For a successful connection to occur, the IP must map to a machine running a database server, the database - news, in this example - must have status Active, the username must be turned on, and obviously the password must match.
Eall Database View -aD Ltt
File Edit
NETWORK -
---Sever IP: locaihost
Database: news
Username: root
Password
F~I Auto-connect on Startup
Conec Dis nect Connected
Figure 3.4: Database View: Connection Settings
After the software establishes a connection, the text to the right of the Connect and
Disconnect buttons changes from "Not Connected" to "Connected". The user can now
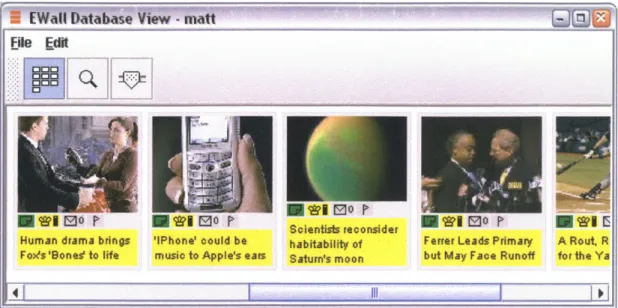
click the first button in the toolbar and see the database view display, as illustrated in
Figure 3.5. This interface displays a scrollable horizontal list of cards. The user can drag
and drop these cards into the workspace or the file system. (Dropping a card onto the file system creates a card file with an ewc extension.)
- WallIDatabse Viw-matt
ile Edit
*
S*~O r ~ MO P Scientists reconsiderHuman drama brings 'IPhone' could be habitability of Ferrer Leads Primary A Rout. R Foxs 'Bones' to life music to Apple's ears Saturn's moon but May Face Runoff for the Ya
Chapter 4
Agents
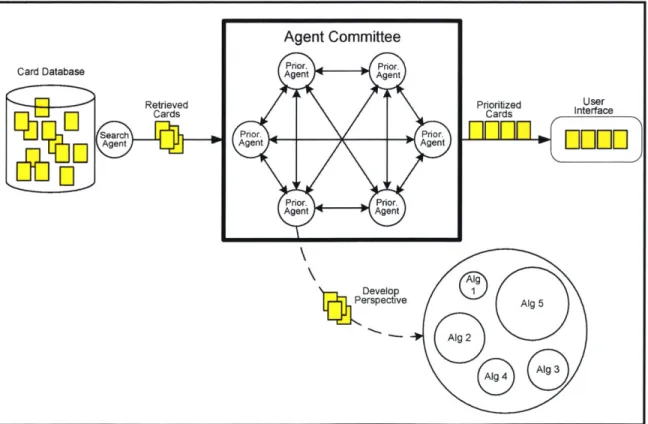
The EWall Agent Committee decides which cards to recommend and how to display them to the user. Figure 4.1 illustrates the committee architecture. Cards flow through the agent architecture in three stages, as follows:
1) A single search agent retrieves cards from the database;
2) Each prioritization agent develops a perspective - a prioritization of the cards -according to a weighted set of heuristic algorithms;
3) The committee consolidates the perspectives of its members and passes the final, prioritized cards to the user interface.
Card Database Retrieved Cards Search %L Agent Prioritized User Cards Interface
FT0wwI]EE
rspective Alg 5Figure 4.1: Agent Committee Architecture. Agent Committee
Prior. Prior. Agent Agent
Section 4.1 defines the traditional agent, which is an autonomous, interactive software module. Section 4.2 discusses the agents used in EWall and how they differ from
traditional agents. Finally, Section 4.3 describes how agents in the committee collaborate and consolidate their perspectives.
4.1
Traditional Agents
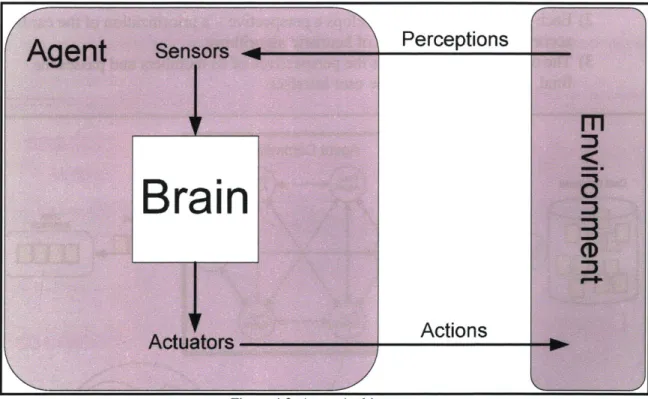
A traditional agent is anything that can be viewed as perceiving its environment through sensors and acting upon that environment through actuators [13]. The architecture for this type of agent is illustrated in Figure 4.2.
Perceptions
Actions
Figure 4.2: Agent Architecture
The traditional agent contains three important modules. As already suggested, sensors receive information from the environment, and actuators send information to the environment. The brain, or the agent function, performs all decision-making computation. The agent function may be very simple, ignoring the sensors and
performing random actions, or it may be quite complex, containing a learning module, a rule set, memory, and even perception of itself or its current state. Regardless of their .
complexity, all agents operate autonomously, and they typically perform computational tasks so the user does not have to, like an assistant that is transparent to the user.
4.2
EWall Agents
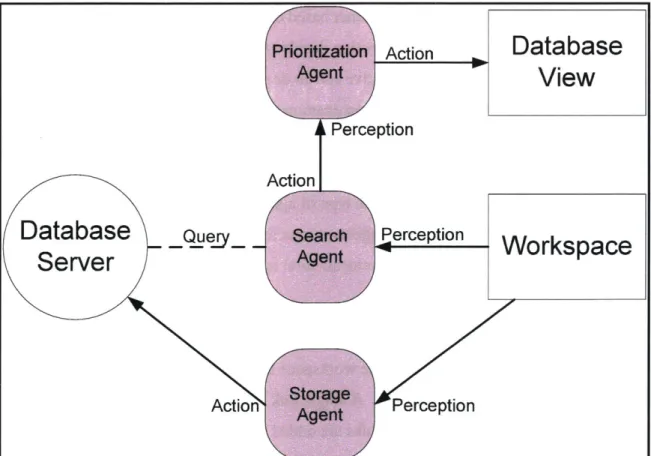
EWall agents differ from traditional agents in their environment architecture. An EWall agent perceives one environment and acts in another. For example, a storage agent perceives the workspace and takes action in the database. A search agent perceives the workspace and takes action by communicating database queries to prioritization agents. The prioritization agents receive information from the search agent and take action in the database view. Figure 4.3 illustrates the EWall agent architecture. Ultimately, the user is himself a human agent, who perceives the workspace and database view and takes action in the workspace. Action
f
Perception ActionDatabase
View
Database
Que y
Server
Action Perception 4-Workspace
Figure 4.3: EWaIl Agent Architecture
Cards typically travel through the system according to the following stages: 1) User A creates or imports a card onto the workspace;
2) A's storage agent uploads the card to the database and links the card to other cards;
3) User B logs into the database;
4) B's search agent detects the login and queries the database;
5) B's search agent forwards the query response, which contains A's card, to a
prioritization agent;
6) B's prioritization agent places a prioritized list of cards, which includes A's card, on B's database view.
Of these six stages, three of them - 1, 3, and 5 - are perception stages, and three - 2, 4, and 6 - are action stages. As the database grows, perception and action become more complex, and the final result sent to the database view becomes more interesting and much less predictable.
The most interesting aspect of an EWall agent is its agent function. A storage agent contains a function that links cards together based on a set of heuristics. This function applies to step 2. A search agent's function decides how to query the database. For example, should it perform an explorative search or a more goal-directed search? Finally, the prioritization agent's function examines a list of interlinked cards and prioritizes them based on a set of heuristics.
The following subsections describe each type of agent in more detail. Sections 4.2.1 and 4.2.2 describe the storage and search agents, respectively. Section 4.2.3 describes the most relevant agent to this thesis, the prioritization agent.
4.2.1
Storage Agent
The storage agent copies cards from the workspace to the database. More importantly, this agent creates links between cards. A single link may represent something as simple as horizontal alignment, but as more links are added to the database, meaningful structure emerges. This structure is essential for the search and prioritization agents to perform their functions.
Storage agents can derive relationships according to several heuristic algorithms. The currently implemented storage algorithms are listed in Table 4-1.
Horizontal Two cards have comparable x-coordinates on the workspace. Alignment
Vertical Two cards have comparable y-coordinates on the workspace. Alignment
History Two cards were consecutively added to the workspace or database. Proximity Two cards are near one another. "Near" refers to the Euclidian
distance between their centers.
Group A card is contained within another.
Table 4-1: Storage Algorithms
The storage agent's job is to capture the interconnectivity of information on the
workspace. The agent assumes that the user arranges cards meaningfully, such that the spatial arrangement reflects the user's perception of the information. The
interconnectivity between cards is stored in the database and ultimately used by the prioritization agents. Figure 4.4 illustrates seven cards and the spatial links that the storage agent created. Cards 1 and 2 are related by horizontal alignment, 2 and 4 are related by proximity, 1 and 3 are related by vertical alignment, 3 and 5 are related by
horizontal alignment, and 5, 6, and 7 are related by grouping and proximity.
In addition to spatial relationships, the storage agent uses the history heuristic to capture temporal relationships. It does so by linking two cards that are consecutively added to the workspace. Figure 4.5 illustrates the history links of the same cards from Figure 4.4. The cards' titles (1 through 7) indicate the order in which they were added to the
[Wall Workspace View - matt )_i_
File Views Help
-r ~Level of Detail: C3A Horizontal Alignment Vertical Alignment Proximity P v 0o P 2 E C to0 4 [W W EDO P 3 7 G) 00 r' 5 20Wek
EMattWorkspace View - matta
File Views ielp
El c3Level of Deta: 1 2 3 F1 7 OF 74 [~i?00 r r 4 N Nk Ie 200MB
Each heuristic algorithm used to create links carries a certain amount of weight, or influence. The storage agent prefers heuristics with higher weights. For example, in
Figure 4.6, the "Vertically Aligned" algorithm has a higher weight than the other
algorithms; this means the storage agent will create stronger links between vertically aligned cards than, for example, horizontally aligned cards. The user controls these weights in the current implementation. In Section 7.2, Future Extensions, I briefly
discuss a possible extension for automating the control of storage algorithm weights, as well as the addition of a storage agent in the server.
ALGORITHMS Vertically Aligned 1 2 3 4 5 6 7 8 9 10 U.. Grouped 1 2 3 4 5 6 7 8 9 10 Fv] Horizontally Aligned 1 2 3 4 5 6 7 8 9 10 J] Historically Linked 1 2 3 4 5 6 7 8 9 10 [r] In Close Proximity 1 2 3 4 5 6 7 8 9 10
Figure 4.6: Storage Agent Algorithms.
4.2.2
Search Agent
The storage agent creates a relational structure within the database. To the search agent,
this structure is like a map of cities - analogous to the cards - connected by roads
-analogous to the links. Given a starting card, the search agent traverses the links, just as a driver traverses roads, to find other cards. Assuming the links represent meaningful relationships, cards that are located fewer links away from the starting card should be more strongly related to the starting card.
Like the storage agent, the search agent uses a set of algorithms to perform its function. These algorithms control three aspects of the search, as depicted in Figure 4.7:
1) Start Point: the card where the agent begins traversing links;
2) Search Path: controls the agent's preference of one traversal path over
another;
3) End Point: terminates the search.
File Edit
r 0
ALGORITHMS--Stage 1: Start Point
[]Most recently active card on the work space
FMost siniar rdon he r spae
]
Most recently active card in the database Stage 2: Search PathPersistence (Search Depth)
0 1 2 3 4 5 6 7 8 9 10
Curiosity
0 1 2 3 4 5 6 7 8 9 10
Stage 3: End Point
Patience (Number of Nodes)
0 10 20 30 40 50 60 70 80 90 100
Figure 4.7: Search Agent Algorithms
The first control algorithm, the start point, is most important. If the database is large and we search locally, then the start point can dramatically alter the search results. This start point eliminates the need for keywords that most search engines have. A typical search engine asks the user to provide search terms. Because the EWall agents must not interfere with the user, a keyword-based search is unacceptable. The search agent must
infer a relevant start point.
There are three start point options. The third option is the least direct, or most explorative, option. This option begins the search with the last card added to the database, which is relevant in time - meaning it is probably active on someone else's
workspace - but perhaps un related to the cards on the user's workspace. The first option is more direct. When the first option is selected, the search agent assumes that the user is interested in cards similar to the ones on her workspace, particularly the last card she added or modified. This option begins the search with the last or currently selected card on the user's workspace. The second option is not yet implemented and is not relevant to this thesis.
The second algorithm, which controls the search path, actually combines two heuristics: persistence and curiosity. Persistence, or search depth, limits the distance - the number of links - the search agent is allowed to traverse from the start card. Curiosity controls the agent's preference for link strength. When curiosity is low, the agent chooses to traverse stronger links before weaker ones. When curiosity is high, the agent prefers weaker links. Figure 4.8 shows a screenshot of the database visualization, which allows the user to see the same roadmap that the search agent sees. Each circle represents a card, and each red line represents a link. If the start point is the upper right-hand card, then the search agent begins there and has three links it can traverse, each leading to one of the cards in the center column. The curiosity setting helps the agent to decide which link to choose first. If persistence is set to 1, then the search stops after the center column, returning all cards except the three in the left column.
(386,430) 11II1 Figure 4.8: Roadmap of a small database
In the future, I may add a third heuristic to control whether the agent performs a depth-first or breadth-depth-first search. The current search agent searches depth-depth-first.
The search agent could potentially search the entire database. In order to prevent this, the end point controls the maximum number of cards to retrieve. Thus, the search is
complete when the first of two cases has been met: the maximum number of cards has been retrieved; all cards within the search depth have been retrieved. Once the search is complete, the search agent relays the retrieved cards to the prioritization agents.
Ede Edit C3C3C3
D C38 C3
DD~QS11
L-
ID+
4
N.e---
K
4 SacEWA Database View - matt
4.2.3
Prioritization Agent
Each prioritization agent aims to promote a particular permutation of a list of cards. This permutation reflects the agent's preferences. "Preferences" refers to the agent's weighted heuristic algorithms, each of which derives a prioritization by assigning a score to each card. Each prioritization agent employs the same algorithms, but each agent may assign different weights to the algorithms. I developed several prioritization algorithms, ranging in complexity and addressing both content - the information within a card - and context - the relational structure around the card. Table 4-2 describes the algorithms according
to type.
Context Weight Weight refers to the sum of the weights of the links connected to a card.
Centrality Centrality is the inverse of the maximum number of link traversals from one card to any other card in the database. Balance Balance refers either to a card's weight or the inverse of a
card's weight, depending on whether the user's workspace is
disorganized or organized, respectively.
Distance Distance refers to the inverse of the number of link traversals from a card to the search's start card.
Group A card scores highly in group if it is part of a card hierarchy. Users create a card hierarchy by placing a card inside of
another card (see the Group links in Figure 4.4).
Content Location A card scores highly in location if it falls within or near a
user-specified target region.
DCODE A card scores highly in DCODE if its DCODE attributes are
similar - close in Euclidian distance - to a user-specified
DCODE attribute.
Age A card scores highly in age if it was created recently.
Popularity Popularity refers to the number of users who have copied a card to their workspaces, plus the number of users who have left comments on the card.
Table 4-2: Prioritization Algorithms
The two most primitive algorithms, Weight and Centrality, are derived from basic graph theory. The weight and centrality algorithms represent breadth and depth, respectively. If we imagine the United States as a node-edge graph, we can assign a node to each major city, and we can draw edges between cities that are geographically close. A city's
such as New York and Philadelphia, would have high breadth. Chicago, with fewer major cities relatively close, would not. A city's centrality is equal to the inverse of the farthest city away from it. New York, along with all other coastal cities, would have low centrality because the farthest city is across the country, but Chicago would have a higher centrality because people can travel practically anywhere from Chicago by only traveling across half of the country. The weight algorithm yields preferences for nodes with many neighbors. And the centrality algorithm yields preferences for nodes near the center of the graph. Pseudocode for the weight and centrality algorithms is illustrated in Figure 4.9 and Figure 4.10, respectively.
WEIGHT( node)
1 sum - 0
2 for each link in links( node) 3 sum < sum + weight( link) 4 return sum
Figure 4.9: Weight Algorithm Pseudocode
CENTRALITY( node) 1 done <- EmptySet()
2 currentNodes <- Set( node)
3 depth (- 0
4 while length( currentNodes ) > 0
5 n <- length( currentNodes)
6 for i < Ilto n
7 currentNode 4- remove( currentNodes , 0)
8 for each newNode in neighbors( currentNode)
9 if not contains( done , newNode )
10 add( currentNodes , newNode)
11 add( done , currentNode)
12 depth - depth + 1
13 return 1 / depth
Figure 4.10: Centrality Algorithm Pseudocode
The centrality algorithm is computationally more expensive than the weight algorithm. The weight algorithm operates locally around the given card node, but the centrality algorithm must account for the entire database. There are currently plans to move the centrality algorithm offline so centrality scores can be available on demand.
The weight and centrality algorithms are completely independent of EWall. They can operate in any environment, such as the internet or any relational database. Balance and Distance build on weight and centrality, respectively, by accounting for EWall-specific information. Figures 4.11 and 4.12 illustrate the pseudocode for the balance and distance algorithms, respectively.
Figure 4.11: Balance Algorithm Pseudocode
DISTANCE( node, start) 1 done <- EmptySet()
2 currentNodes <- Set( node)
3 depth - 0
4 while length( currentNodes ) > 0 5 n <- length( currentNodes) 6 for i < I to n
7 currentNode <- remove( currentNodes , 0)
8 if currentNode = start
9 return I / (depth + 1)
10 for each newNode in neighbors( currentNode)
11 if not contains( done , newNode )
12 add( currentNodes , newNode)
13 add( done , currentNode)
14 depth <- depth + 1 15 return 0
Figure 4.12: Distance Algorithm Pseudocode
The balance algorithm uses the weight algorithm explicitly. It simply returns the weight score if the workspace is disorganized - the ratio of links to cards is less than some predefined threshold - and it inverts this score if the workspace is organized. The
distance algorithm does not explicitly use the centrality algorithm, but the only difference between the two is the insertion of lines 8 and 9 in Figure 4.12. The algorithm performs a breadth-first search from node and stops when it finds start, the search agent's start BALANCE( node, workspace)
1 nCards <- length( cards( workspace))
2 nLinks <- length( links( workspace)) 3 organization <- nLinks I nCards
4 if organization < BALANCETHRESHOLD
5 return WEIGHT( node)
6 else
card. If the algorithm does not find start - if line 15 is reached - the algorithm returns 0, indicating there is no distance-based relationship between node and start.
The final context-based algorithm, Group, analyzes the hierarchical structure of grouped cards. When the storage agent links two grouped cards (a card within another), it marks that link as a Group link. The group algorithm promotes cards that have Group links, cards that are part of a card hierarchy. Figure 4.13 illustrates the group algorithm's pseudocode. A card's group score is the sum of its number of parents and children, an indication of the size of its hierarchy.
GROUP( card) 1 size - 0
2 for each link in links( node) 3 if type( link) = "Group"
4 size - size + 1
5 return size
Figure 4.13: Group Algorithm Pseudocode
The content-based algorithms are much simpler than the context-based algorithms. I implemented two non-numerical content-based algorithms: Location and DCODE. And I implemented two numerical content-based algorithms: Age and Popularity. Age and popularity are both accessible properties of a card, via the getTimestamp() getReaderso,
and getComments() methods. Because the age algorithm promotes recent cards, it returns
the inverse of the card's age, as seen in the pseudocode in Figure 4.14. The popularity algorithm returns the sum of the number of readers and readers who have left comments, as seen in Figure 4.15.
AGE( card )
1 time <- currentTime()
2 return 1 / (time - getTimestamp( card))
POPULARITY( card)
1 readers <- getReaders( card)
2 readers WithComments <- EmptySet() 3 for each comment in getComments( card)
4 if not contains( readers WithComments , author( comment))
5 add( readers WithComments , author( comment) ) 6 return length( readers ) + length( readers WithComments)
Figure 4.15: Popularity Algorithm Pseudocode
Similar to the storage algorithms described in Section 4.2.1, each prioritization algorithm carries a weight, an amount of influence over the agent's overall prioritization. Figure
4.16 illustrates a prioritization agent's user interface, and Figure 4.17 illustrates the
function that applies influence to an algorithm's score. The two left columns in the interface provide the user with controls for turning algorithms on and off and setting them to automatic or manual. Chapter 5, Learning, explains the automatic setting in detail. The rightmost column graphs each algorithm's influence over time. The "Influence" column is the most important. Influence ranges from -100 to 100, not from 0 to 100. This is a very important distinction. Imagine that a user prefers older cards, which receive low scores from the age algorithm. We need a mechanism for promoting old or new cards, so that old cards may somehow receive high scores. A naive implementation might add an "Anti-Age" algorithm that explicitly promotes older cards. But as seen in
Figure 4.16, this implementation is capable of promoting new and old cards using just
one age algorithm. When this age algorithm has positive influence, it promotes newer cards, and if it has negative influence, it promotes older cards. An algorithm's score is first normalized within the range from -I to 1 and is then multiplied by its influence, yielding a final score between -100 and 100.
EM111 Database View - matt File Edit
Stage 4: Prioritization
OnIOff Auto Algorithm Influence History
-100 -50 0 50 100 2 2 Centrality -100 -50 0 50 100 Balance -100 -50 0 50 100
S [-J
Distance -50 0 50 100 2 2 Group -100 -50 50 100 2 W Age -100 -50 0 50 100 2 2 Popularity -100 -50 0 50 100 4|I _01Figure 4.16: Prioritization Agent Algorithms
influence
[-100, 100]
Algorithm sCr 0Weight: MA
[0, MAX] MA X [-1, 1] influence *score [-100,
4.3
Agent Collaboration
The agent committee is composed of prioritization agents. The agent committee in itself can be viewed as a single agent. But in designing such a system, it helps to personify the agents and imagine them working together as a committee. The committee's goal is to prioritize the cards so that the most interesting and relevant cards receive the highest scores. The overall prioritization produced by the committee is derived according to the following:
" Agent Preferences: the heuristic prioritization algorithms each agent uses to form a perspective;
" Consolidation Method: the method used to combine agents' perspective's and produce an overall committee perspective.
Section 4.2.3 described agent preferences. This section describes the consolidation method.
After agents form perspectives on a list a list of cards, the committee must somehow combine these perspectives. The simplest approach is a linear consolidation method like the consolidation method of algorithm scores in a single agent. The current
implementation uses this approach. Each agent, like each algorithm, carries a weight, or influence. This influence determines how much of an effect the agent's perspective will have on the committee's overall prioritization.
By personifying the agents, influence can be thought of as an emotion. As an extension, I may add other emotions, such as extroversion, competitiveness, resistance, and fatigue
[1]. These new emotions could enable the agents to interact and thus influence each other's, and not just the committee's, perspective. This addition of interaction mechanics could produce less predictable and more meaningful results.
The importance in using multiple agents is in learning. As described in the following chapter, each prioritization agent learns based on experience. Agents that learn faster become more influential in the committee, and the system as a whole learns more rapidly.
Chapter 5
Intelligence
Intelligence is marked by the ability to adapt and to learn. Adaptation is a change that allows someone or something to become more suitable to a given situation. Adaptive software gives users high performance even in dynamic environments. For EWall users, this means the agent committee performs consistently, even when the user's task changes or when the user changes. When a change occurs, the committee adapts to meet the needs of the new task or new user. The other aspect of intelligence, learning, refers to the ability to improve performance from experience, where experience comes from
observation of and interaction with the user. Some of the proposed learning algorithms in the EWall agent committee are derived from common statistical methods, such as
regression. Some proposed algorithms employ the use of less direct concepts, such as evolution. The following sections describe the learning algorithms I designed for the
agent committee. Section 5.1 describes the original recommendation system, before learning was added. Section 5.2 describes the design of a regression-based algorithm.
Section 5.3 describes the metric used to obtain implicit feedback from the user. Finally, Section 5.4 discusses the application of a simple genetic algorithm.
5.1
Non-Adaptive Algorithm
Originally, the database view contained a single prioritization agent. Although this agent could adapt by accounting for contents of the user's workspace, it did not learn. Figure
5.1 illustrates the architecture for a non-adaptive agent with three heuristic algorithms:
weight, centrality, and popularity. The user manually controls the agent's preferences. This architecture produces very predictable prioritizations. And more importantly, this architecture forces the user to provide explicit input to the system. Ideally, EWall agents must operate without explicitly asking the user anything.