Ear Description and Recognition Using ELBP and Wavelets
Amir Benzaoui, Ali Kheider and Abdelhani Boukrouche
Laboratory of Inverse Problems, Modeling, Information and Systems (PI:MIS) Department of Electronics and Telecommunications
University of 08 Mai 1945 P.O box 401, Guelma, Algeria
[email protected] [email protected]
ABSTRACT
The human ear is a new technology in biometrics which is not yet used in a real context or in commercial applications. For this purpose of biometric system, we present an improvement for ear recognition methods that use Elliptical Local Binary Pattern operator as a robust technique for characterizing the fine details of the two dimensional ear images. The improvements are focused on feature extraction and dimensionality reduction steps. The realized system is mainly appropriate for verification mode; it starts by decomposing the normalized ear image into several blocks with different resolutions. Next, the textural descriptor is applied on each decomposed block. A problem of information redundancies is appeared due to the important size of the concatenated histograms of all blocks, which has been resolved by reducing of the histogram’s dimensionalities and by selecting of the pertinent information using Haar Wavelets. Finally, the system is evaluated on the IIT Delhi Database containing two dimensional ear images and we have obtained a success rate about 94% for 500 images from 100 persons. Keywords: biometrics, ear recognition, Local Binary Pattern, Elliptical Local Binary Pattern, texture description, haar wavelets.
I. INTRODUCTION
Biometric systems have an important role in the information and public security domains. They provide an automatic identification or verification of the identity, based on the analysis of physical or behavioral modalities of the human body. Several modalities have been used for recognizing the human identity; we can cite face, fingerprint, voice, iris, brain, computer keyboards, or signature [1, 2]. The use of the human ear in biometric applications has become a quite interesting way in last few years. It’s considered as a new class of biometrics which is not yet used in a real world or in commercial applications. The human ear is characterized by a rich structure which provides important information to differentiate between people; we can visualize 10 features and 37 sub-features from 2D ear image. The terminology of the human ear is presented in Figure 1; this terminology is made up of standard features. It includes an outer rim (helix) and ridges (antihelix) parallel to the helix, the
concha (hollow part of ear), the lobe and the tragus (small prominence of cartilage) [3,4,5]. The human ear has several advantages compared with others modalities; it has a rich structure, smaller object (small resolution), stable over the time, modality accepted by people, not affected by changes in age, facial expressions, position and rotation, the acquisition of the ear images can be affected without participation of the subject and can be captured from distance [3, 6].
An ear recognition system can be divided into three main steps: ear normalization, feature extraction and classification. In the normalization step, the ear image must be normalized to standard size and direction according to the long axis of outer ear contour. The long axis was defined as the line crossing through the two points which have the longest distance on the ear contour. After normalization, the long axes of different ear images were normalized to the same length and same direction [7, 8].
In feature extraction, we can recapitalize the existing methods in two principal classes, geometric and global classes. In geometric approaches, the ear analysis is given by an individual description of its parts and their relationships, like measure of distances, angles, or the triangulation between the closed edge resulting from the helix shape and lobule of -
Figure 1. Structure of the Human Ear [3,4,5].
Figure - the ear [9], Crus of Helix and the Lobe [9] or diagram of the ear triangulation [10].
methods of this approach are not effective in the unconstrained cases, i.e., situation where occlusion, lighting, or noise are uncontrolled. Recently, the scientists concentrate on global approaches, which are considered as robust approaches in the unconstrained cases compared to geometric approaches. Global approaches are based on pixel information; all pixels of the normalized ear image are treated as a single vector the vector’s size is the total number of the pixels. Principal Component Analysis (PCA) [11], Color Spaces fusion [12], 2D Gabor Filter [13] … are the most popular methods used to change the space of r
change the data representation, to reduce the dimensionalities, or to select only the useful information. This paper presents an improvement
recognition systems and comparison with last
art approaches. There are four steps of the proposed algorithm. First, preprocessing is applied to improve the contrast and the quality of the images
image is decomposed into several blocks with different resolutions. Next, the textural descriptor ELBP is applied on all blocks of the decomposed image. Finally, Wavelets in one dimensional space are
dimensionalities of the concatenated histograms f each block.
This paper is organized as follows: in the nex we describe the classical LBP and ELBP
3, the enrolment phase and ear characteristic extraction is presented. In the Section 4, we present the verification phase and performances evaluation applied on
database. For this purpose, Chi-Square
required to measure similarities between two ear templates. Finally, a conclusion related to this work is given in Section 5.
II. LOCAL BINARY PATTERN (LBP
The original LBP operator introduced by
[14], which has been used for texture discrimination, has shown a powerful and effective results against the variations in rotation and illumination. The operator labels the pixels of an image by thresholding the 3×3
6 5 2 7 6 1 13 28 11
Threshold
LBP = 1 + 0 + 0 + 0 + 16 + 32 + 64 + 128 = 241
Figure 2. LBP calculation performed into 3×3 neighborhood. Lobe [9] or the Vornoi
[10]. However, the methods of this approach are not effective in the situation where occlusion, or noise are uncontrolled. Recently, the scientists concentrate on global approaches, which are considered as robust approaches in the unconstrained geometric approaches. Global approaches are based on pixel information; all pixels of e normalized ear image are treated as a single vector; the vector’s size is the total number of the pixels. [11], Color Spaces fusion [12], 2D Gabor Filter [13] … are the most popular methods used to change the space of representation, to change the data representation, to reduce the or to select only the useful information. This paper presents an improvement for automated ear with last state of the There are four steps of the proposed preprocessing is applied to improve the s. Second, the ear image is decomposed into several blocks with different descriptor ELBP is applied all blocks of the decomposed image. Finally, Haar used to reduce the dimensionalities of the concatenated histograms from
This paper is organized as follows: in the next Section, ELBP. In the Section 3, the enrolment phase and ear characteristic extraction is ection 4, we present the verification phase and performances evaluation applied on IIT Delhi Square distance is required to measure similarities between two ear templates. Finally, a conclusion related to this work is
LBP)
The original LBP operator introduced by Ojala et al. which has been used for texture discrimination, has shown a powerful and effective results against the variations in rotation and illumination. The operator labels the pixels of an image by thresholding the 3×3
neighborhood of each pixel with the centr
considering the result as a binary code. Next, the histogram of the labels can be used as a texture descriptor (see Figure 2); for a given a pixel
image, its texture LBP is calculated by comparing its neighbors pixels P on a circle of radius
for more details on circular neighborhood). The value of LBP(gc) is obtained as:
LBPP,R(xc, yc) = ∑Pi=1 S(giP ,R
S(x) is defined as: S(x) = 1 0
However, the major disadvantage of the original LBP operator resides in the size of the descriptor, a mask of 3×3 pixels cannot capture the structures of large scale which can considered as a dominant structures in the image. Recently, the size of the operator has been extended by using a mask with different large sizes. Figures 3.a, 3.b, 3.c show three examples of the extended LBP.
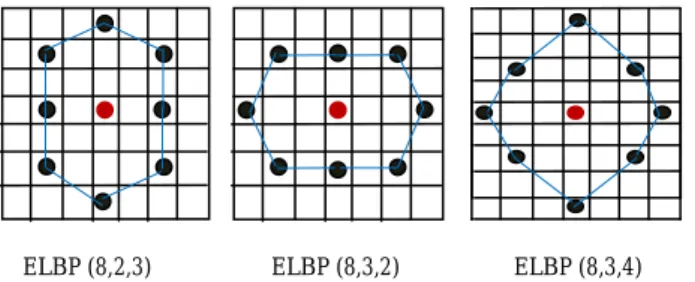
A new model of the extended operators of LBP called: Elliptical Local Binary Patterns (ELBP
presents significant improvements for encoding the micro features (the fine details) of
LBP. In ELBP, at each pixel
surrounding pixels that lie on an ellipse (see with (xc,yc) is the center. ELBP of
neighboring pixels at (R1, R2) distances is
ELBPP,R1,R2(xc, yc) = ∑Pi=1 S(g S(x) function is defined as (2).
(a) (b)
Figure 3. Neighborhood set for different (P,R). (a) The basic LBP operator (P,R) = (8,1) (b) LBP with circular neighborhood (8,2). (c)
LBP with circular neighborhood (8,3).
1 0 0 1 0 1 1 1 1 2 4 128 8 64 32 16 1 0 128 241 64 32 Threshold Multiplay
neighborhood of each pixel with the central value and considering the result as a binary code. Next, the histogram of the labels can be used as a texture descriptor given a pixel gc(xc,yc) from gray
image, its texture LBP is calculated by comparing gc with
on a circle of radius R (see Figure 3 for more details on circular neighborhood). The value of
,R - gc) 2i-1 (1)
if x 0;
otherwise;% (2)
However, the major disadvantage of the original LBP operator resides in the size of the descriptor, a mask of capture the structures of large scales which can considered as a dominant structures in the ecently, the size of the operator has been extended by using a mask with different large sizes. c show three examples of the extended
of the extended operators of LBP called: Elliptical Local Binary Patterns (ELBP) [15] which presents significant improvements for encoding the micro the image compared with at each pixel gc(xc,yc), we consider its
surrounding pixels that lie on an ellipse (see Figure 4) ELBP of (xc, yc) with P
neighboring pixels at (R1, R2) distances is computed as:
S(giP ,R1,R2 - gc) 2i-1 (3) S(x) function is defined as (2).
(b) (d) Neighborhood set for different (P,R). (a) The basic LBP operator (P,R) = (8,1) (b) LBP with circular neighborhood (8,2). (c)
LBP with circular neighborhood (8,3).
0 0 16
ELBP (8,2,3) ELBP (8,3,2) ELBP (8,3,4) Figure 4. ELBP samples with different extention [15].
Figure 5. Results of LBP and ELBP application with differentd masks. In details, the coordinates of the ith neighboring pixel of
(xc,yc) are calculated using the formulas:
angle-step = 2 * π / P xi = xc + R1 * cos (( i – 1) * angle
yi = yc + R2 * sin (( i – 1) * angle
Figure 5 shows the results of LBP and ELBP applications using different masks. However, the extend versions of LBP operators and the Elliptical LBPs present a good results by capturing the local patterns
micro features of the human ear but they are not performed for capturing the global characteristics can considered as dominant structures in the image
III. PROPOSED APPROACH
The proposed algorithm used to extract information for ear recognition is described in the following recapitulation; next we present each step in details. We consider that we have a gallery θ of biometric samples with P persons, S biometric sample (image
(example θ=500, P=100, S=5, with II
The process of features extraction is composed of principal stages for each person:
a. Preprocessing of all normalized ear images
b. Decomposition of each ear image into several blocks with different resolution
c. Application of the textural descriptor each decomposed block.
d. Concatenation of the resulting histograms from
each block in one global histogram.
ELBP (8,3,2) LBP (8,2) Original Image LBP (8,1)
ELBP (8,2,3) ELBP (8,3,2) ELBP (8,3,4) ELBP samples with different extention [15].
and ELBP application with differentd masks. neighboring pixel of calculated using the formulas:
(4) 1) * angle-step) (5) 1) * angle-step) (6)
Figure 5 shows the results of LBP and ELBP However, the extend e Elliptical LBPs present a good results by capturing the local patterns and the but they are not characteristics which can considered as dominant structures in the image.
used to extract information recognition is described in the following recapitulation; next we present each step in details. We of biometric samples S biometric sample (image) per person IIT Delhi database). The process of features extraction is composed of five
Preprocessing of all normalized ear images. Decomposition of each ear image into several
with different resolutions.
descriptor ELBP for
resulting histograms from each block in one global histogram.
e. Dimensionalities reduction
histogram using Haar Wave A. Preprocessing
The objective of the preprocessing is the modification of the source’s image representation to facilitate the task of the following steps and to improve the rate of recognition. First, the ear image is converted into grayscale image. Next, every grayscale image is filtered by median filter to suppress noise. Lastly, the noise suppression image is then adjusted to improve the contrast of the image [16].
B. Image decomposition
Most LBP operators characterize the texture distribution of each pixel with its neighborhood only. But, the differences between two
demonstrate by the texture distribution of each pixel with its neighborhood only, but also by the relative connection with other pixels in the image
have decomposed the original image into several images (see Figure 6) to characterize
and the relationships between all the next stage, the extracted histograms will be concatenated in one global
technique, we can obtain the fine details and the relative connections between all pixels
Figure 6. Image decomposition in differents blocks.
ELBP (8,3,4) ELBP (8,3,2) Level 1 Level
Dimensionalities reduction of each global Haar Wavelets.
The objective of the preprocessing is the modification of the source’s image representation to facilitate the task of the following steps and to improve the rate of image is converted into ery grayscale image is filtered by median filter to suppress noise. Lastly, the noise suppression image is then adjusted to improve the
Most LBP operators characterize the texture with its neighborhood only. , the differences between two ear images cannot by the texture distribution of each pixel with , but also by the relative connection in the image. With this intention, we the original image into several
sub-characterize better the details and the relationships between all pixels of the image. In , the extracted histograms from each block will be concatenated in one global histogram. With this technique, we can obtain the fine details and the relative
of the image.
Image decomposition in differents blocks.
Level2
C. Application of the textural descriptor ELBP and histogram’s concatenation
The textural descriptor ELBP, presented in the previous section, is applied on all blocks of the decomposed image with the different
presented in Figure 6. Next, the extracted histograms from each block will be concatenated in one global histogram (vector) representing an
problem of information redundancies is appeared due to the important size of each template.
D. Dimensionalities reduction using Haar Wavelets To resolve the problem of information redundancies we have used the Discrete Wavelet Transform (DWT) a technique of data compression, to reduce the dimensionalities and to select only the useful information needed to model each person. Wavelet analysis is the breaking up of a signal into a set of scaled and translated versions of an original (or mother) wavelet. Taking the wavelet transform of a signal decomposes the original signal into wavelets coefficients at different scales and positions. These coefficients represent the signal in the wavelet domain and all data operations can be performed using just the corresponding wavelet coefficients.
Wavelets work by decomposing
histograms (global histogram) into different resolutions or frequency bands, and choosing the Haar Wavelet computing the 1D Discrete Wavelet Transform (DWT) The extraction of pertinent information is based on the concept of selecting a small number of approximat coefficients (at a suitably chosen level) and some of the detail coefficients can accurately represent regular signal components. Choosing a decomposition level for the DWT usually depends on the type of signal being analyzed or some other suitable criterion such as entropy. For the processing of ear templates decomposition in our application up to scale 3 is adequate.
III. VERIFICATION PHASE AND
PERFORMANCES EVALUAT
For a given image ξ considered as a test example in the verification mode. In this case, ξ
present in the database or unknown. We start by building its template representation, related to individual’s ear, using the extraction method presented in this work (stages: a-e). This template is compared
templates of the same person in the Gallery using the Chi-Square distance. This distance between two templates is calculated as:
Distchi-square (X, Y) = ∑ (67 67 8 79:
Where xi and yi are the two bit-wise codes to be
compared.
To evaluate the performances of the we have carried out several tests on IIT Delhi
We have taken 500 normalized ear images for evaluation. The IIT Delhi ear image database consists of the ear image database collected from the students and staff at
descriptor ELBP and , presented in the is applied on all blocks of the decomposed image with the different resolutions like he extracted histograms concatenated in one global ear template. A problem of information redundancies is appeared due to
Haar Wavelets of information redundancies, iscrete Wavelet Transform (DWT) as a technique of data compression, to reduce the the useful information Wavelet analysis is the breaking up of a signal into a set of scaled and translated versions of an original (or mother) wavelet. Taking the wavelet transform of a signal decomposes the original o wavelets coefficients at different scales and positions. These coefficients represent the signal in the wavelet domain and all data operations can be performed using just the corresponding wavelet coefficients.
Wavelets work by decomposing the concatenated into different resolutions Haar Wavelet and computing the 1D Discrete Wavelet Transform (DWT). The extraction of pertinent information is based on the all number of approximated coefficients (at a suitably chosen level) and some of the detail coefficients can accurately represent regular signal components. Choosing a decomposition level for the DWT usually depends on the type of signal being some other suitable criterion such as entropy. For the processing of ear templates decomposition in our
D PERFORMANCES EVALUATIONS
considered as a test example in verification mode. In this case, ξ is declared as We start by building representation, related to individual’s ear, using the extraction method presented in this work is compared to the stored person in the Gallery using the distance. This distance between two
67;<7)=
67><7 (8) wise codes to be
To evaluate the performances of the realized system, IIT Delhi database. 00 normalized ear images for evaluation. ear image database consists of the ear image database collected from the students and staff at
IIT Delhi, New Delhi, India. This database has been acquired in IIT Delhi campus during Oct 2006
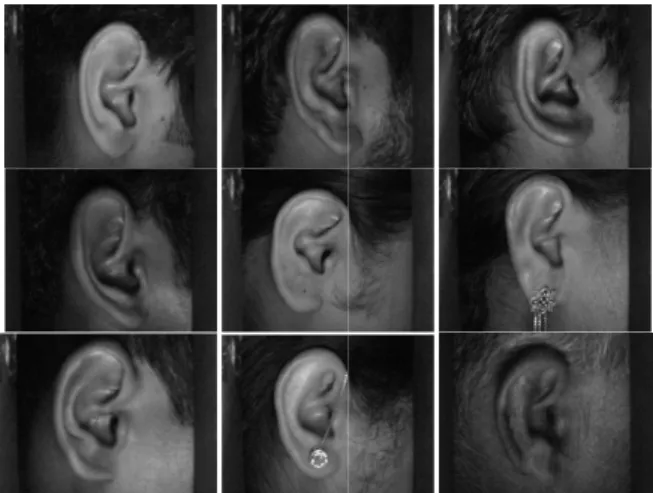
using a simple imaging setup. All the images are acq from a distance using simple imaging setup and the imaging is performed in the indoor environment. The currently available database is acquired from the 121 different subjects and each subject has at least three ear images. All the subjects in the da
group 14-58 years. The resolution of these images is 272×204 pixels and all these images are available in jpeg format (Figure 7). In addition to the original images, this database also provides the automatically normalized and cropped ear images of size 50×180 pixels (
17].
In this evaluation, 3 images for each person are used as Gallery and the others2 image
sets. The Gallery and the probe
300 and 200 images. The proposed approach has been evaluated with all possible probabilities and the mean rate of all possible selections has taken in consideration. As it is well known, to validate any biometric verification, it is essential to calculate the Acceptance Rate (FAR) and the
(FRR) to find the accuracy of the biometric system which is calculated as:
Accuracy = 100 A
The last rate is known under the name of:
Rate (EER). This rate is calculated from the first two rates, it constitutes a current point of performance’s measurement (The center of gravity between intra and inter-class). This rate corresponds to the point where FRR = FAR, i.e., the compromise between the Acceptance Rate and the False Rejection Rate
• If Dist <= EER: this indicates that two 1D ear templates are very close and can be considered that they correspond to the same person authentic.
• Else, if Dist > EER: two 1D codes are considered in this case different, which can be used to distinguish between two persons.
Figure 7. Some images from IIT Delhi database [13,1
IIT Delhi, New Delhi, India. This database has been acquired in IIT Delhi campus during Oct 2006 - Jun 2007 using a simple imaging setup. All the images are acquired from a distance using simple imaging setup and the imaging is performed in the indoor environment. The currently available database is acquired from the 121 different subjects and each subject has at least three ear images. All the subjects in the database are in the age 58 years. The resolution of these images is 272×204 pixels and all these images are available in jpeg 7). In addition to the original images, this database also provides the automatically normalized and ear images of size 50×180 pixels (Figure 8) [13,
images for each person are used images are used as the probe-probe-sets separately consist of
proposed approach has been with all possible probabilities and the mean has taken in consideration. As it is well known, to validate any biometric verification, it is essential to calculate the False ) and the False Rejection Rate the accuracy of the biometric system
(BCD>BDD)
= (7) The last rate is known under the name of: Equal Error ). This rate is calculated from the first two rates, it constitutes a current point of performance’s measurement (The center of gravity between intra-class class). This rate corresponds to the point where the compromise between the False Acceptance Rate and the False Rejection Rate.
this indicates that two 1D ear templates are very close and can be considered that they correspond to the same person authentic.
o 1D codes are considered in this case different, which can be used to distinguish
Figure 8. Some images from normalized IIT Delhi database [13,
TABLE I. COMPARISON WITH OTHER
APPROCHES USING THE SAME DISTRIBUTION
Approach Accuracy %
PCA without decomposition Classical LBP Classical LBP + PCA Classical LBP + DWT LBP (8,2) LBP (8,3) LBP (8,2) + PCA ELBP(8,2,3) ELBP(8,3,2) ELBP(8,3,4) ELBP(8,3,2) + PCA ELBP(8,3,2) + DWT
We have compared also the proposed approach with other state of art approaches using the similar protocols under more challenges and scenarios. The
taken with IIT Delhi database which presents a very good variation, in lighting and occlusion, to mea
performances of the approach in the difficult situations. The results of the comparison are presented in Table Table 1 shows clearly that ELBP presents very good results with IIT Delhi database which indicates that this descriptor has an important effectiveness against to the variations in different factors like as occlusion, lighting, rotation, and noise.
The comparison results from Table 1 show that our (8,3,2) + DWT method outperforms other state of the art
Delhi database [13,17].
OMPARISON WITH OTHER STATE OF ART SAME DISTRIBUTION Accuracy % 80,39 89 92,75 92,71 89,8 86,14 90,43 91,4 91,63 91,39 93,44 94,51
compared also the proposed approach with other state of art approaches using the similar protocols The ear images are database which presents a very good occlusion, to measure the performances of the approach in the difficult situations. The results of the comparison are presented in Table1.
presents very good database which indicates that this mportant effectiveness against to the variations in different factors like as occlusion, lighting, show that our ELBP + DWT method outperforms other state of the art
systems using the same distribution. These results also reveal that ELBP (8,3,2), in normalized ear modality, is more robust than LBP in the extraction of the fine details (micro features).
Another conclusion we can make from ELBP DWT is much better than
association of the DWT as a robust technique in the dimensionalities reduction is very interesting to improve the performances of the realized
V. CONCLUSION
In this work, we have successfully developed a approach for ear texture discrimination;
primary based on Elliptical Local Binary Patterns. Each normalized ear image is decomposed on multi blocks with different resolution, and the textural descriptor ELBP will be applied on each
the extracted histograms from each block will be concatenated in one global
Wavelets is applied on each global
the dimensionalities and to extract the useful information. The experimental results applied on
have showed that the feature extraction approach based on ELBP and DWT has given a very significant improvement at the recognition rate.
REFERENCES
[1] A.K. Jain, A.A. Ross and K. Nandakumar Biometrics,” 1st edn. Springer US,
[2] A.K. Jain, P. Flynn and A.A. Ross. 1st edn. Springer US, 2008. [3] Arbab-Zavar B. and Nixon M.S
analysis for ear biometrics,” Understanding (Elsevier), vol.115, pp.487
[4] Kumar A. and Tak-Shing T.C., “Robust ear identification using sparse representation of local texture descriptors,” Recognition (Elsevier), vol.46, pp.73
[5] Dinkar A.D. and Sambyal S.S., “Person identification in Ethnic Indian Goans using ear biometrics and neural networks,” Science International (Elsevier
2012.
[6] Yuan L. and Mu Z.C., “Ear recognition based on local information fusion,” Pattern Recognition Letters
190, 2012.
[7] Yuan L. and Mu Z.C., “Ear recognition based 2D Images,” Proceedings of the 1st IEEE International Conference on Biometrics: Theory, Applications, and Systems (BTAS), Washington, USA, September 27
[8] Xie Z. and Mu Z.C., “Ear recognition Using LLE and IDLLE Algorithm,” Proceedings of the 19
Conference on Pattern Recognition (ICPR) December 08-11, 2008.
[9] Burge M. and Burger W., “Ear Biometrics in Computer Vision, Proceeding of the 15th IEEE International Conference on Pattern Recognition (ICPR), Barcelona, Spain, pp.822
8, 2000.
[10] Burge M. and Burger W., “Ear biometrics in machine vision,” Proceedings of the 21st Workshop of the Australian Associa for Pattern Recognition, 1997.
[11] Arbab-Zavar B., Nixon MS. And Hurley D.J analysis of ear biometrics,”
International Conference on Biometrics: Theory, Applications, and Systems (BTAS), Washington, USA,
systems using the same distribution. These results also , in normalized ear modality, is more robust than LBP in the extraction of the fine details Another conclusion we can make from the Table 1 is that is much better than ELBP PCA; the association of the DWT as a robust technique in the dimensionalities reduction is very interesting to improve
realized approach.
In this work, we have successfully developed a simple discrimination; this approach is Local Binary Patterns. Each normalized ear image is decomposed on multi blocks , and the textural descriptor ELBP will be applied on each decomposed block. Next, from each block will be concatenated in one global histogram. Finally, DWT Wavelets is applied on each global histogram to reduce the dimensionalities and to extract the useful information. results applied on IIT Delhi database have showed that the feature extraction approach based given a very significant improvement at the recognition rate.
EFERENCES
K. Jain, A.A. Ross and K. Nandakumar., “Introduction to Springer US, 2011.
K. Jain, P. Flynn and A.A. Ross., “Handbook of Biometrics”, Zavar B. and Nixon M.S., “On guided model-based analysis for ear biometrics,” Computer Vision and Image
, vol.115, pp.487-502, 2011.
., “Robust ear identification using sparse representation of local texture descriptors,” Pattern
, vol.46, pp.73-85, 2013.
., “Person identification in Ethnic Indian Goans using ear biometrics and neural networks,” Forensic Elsevier), vol.223, pp.373.e1-373.e13, ., “Ear recognition based on local information gnition Letters (Elsevier), vol.33,
pp.182-., “Ear recognition based 2D Images,” IEEE International Conference on Biometrics: Theory, Applications, and Systems (BTAS), Washington, USA, September 27-29, 2007.
., “Ear recognition Using LLE and IDLLE Proceedings of the 19th IEEE International Conference on Pattern Recognition (ICPR), Florida, USA, ., “Ear Biometrics in Computer Vision,” IEEE International Conference on Pattern , Barcelona, Spain, pp.822-826, September
3-., “Ear biometrics in machine vision,” Workshop of the Australian Association Zavar B., Nixon MS. And Hurley D.J., “On model-based ,” Proceedings of the 1st IEEE International Conference on Biometrics: Theory, Applications, , Washington, USA, September 27-29, 2007.
[12] Nanni L. and Lumini A., “Fusion of color spaces for ear authentication,” Pattern Recognition (Elsevier), vol.42, pp.1906-1913, 2009.
[13] Kumar A. and Wu C., “Automated human identification using ear imaging,” Pattern Recognition (Elsevier), vol.45, pp.956-968, 2012.
[14] Ojala T., Pietikainen M. and Harwood D., “A Comparative Study of Texture Measures with Classification based on Features Distribution,” Pattern Recognition (Elsevier), vol.29, no.06, pp.51-59, 1996.
[15] H.T. Nguyen and A. Caplier., “Elliptical Local Binary Pattern for Face Recognition,”Springer: Proceeding ofInternational Workshops on Computer Vision (ACCV’12), Daejeon, Korea, pp.85-96, November 5-6, 2012.
[16] Benzaoui A., Bourouba H., and Boukrouche A., “System for Automatic Faces Detection,” Proceeding of the 3rd IEEE International Conference on Image Processing, Theory, Tools and Applications (IPTA’3), Istanbul, Turkey, pp.354-358, Octobre 15-18, 2012.
[17] IIT Delhi Ear Database, Version 1:
http://www4.comp.polyu.edu.hk/~csajaykr/IITD/Database_Ear.ht m
![Figure 1. Structure of the Human Ear [3,4,5].](https://thumb-eu.123doks.com/thumbv2/123doknet/13824132.442762/1.892.466.800.712.956/figure-structure-human-ear.webp)