Quantification of Degradation of Chlorinated Hydrocarbons in Saturated Low Permeability Sediments Using Compound-Specific Isotope Analysis
9
0
0
Texte intégral
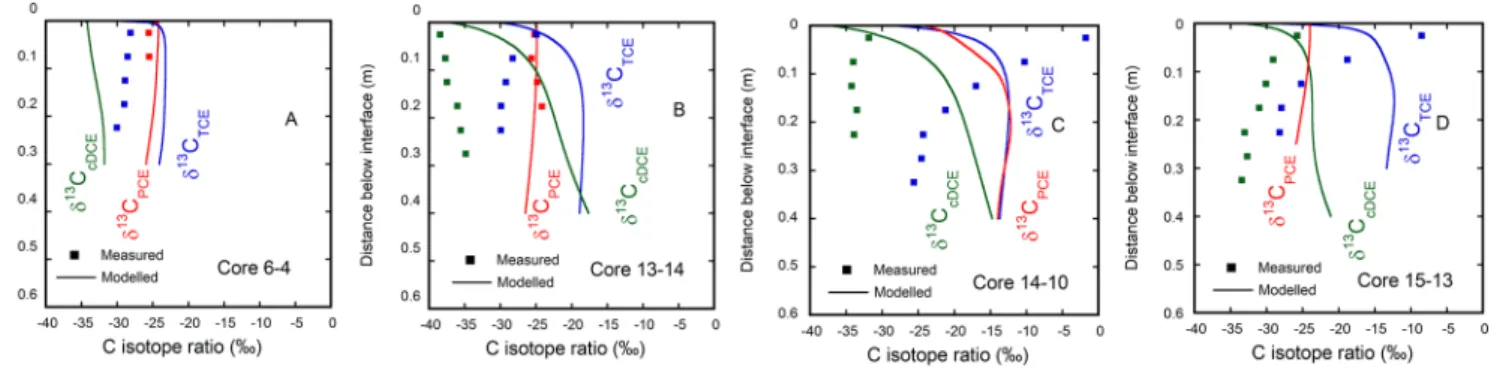
Figure

Documents relatifs