Reseeded Rangelands
STEVE M. SPANGLER] ANDJAMES A. MACMAHON" Department of Biology, Utah State University,
Logan, Utah 84322
Environ.Entomol.19(2): 244-250 (1990)
ABSTRACT Sap-feeding and predaceous arthropod faunas of forage bunchgrasses in re-seeded rangeland vegetation were examined. Four major species of sap feeders were found; the major predators were spiders. Grass monoculture had very high densities of sap feeders compared with grass biculture, shrub-grass, tree-grass, and native areas; this was reflective of the large contribution from the miridsIrbisia brachycera Uhler andConostethus ameri-canus (Knight). They were present during the leaf stages of crested wheatgrass when it had its lowestcarbohydrate root reserves. Homoptera and predator densities were not significantly related to the pattern of vegetation. The lowest number of sap-feeder species occurred in the grass monoculture, and sap-feeder faunas in this plot were dissimilar to those of all other plots. One-season dispersal experiments did not support the hypothesis that grass density caused the differences between arthropod faunas in different vegetation, whereas big sage-brush, common in reseeded pastures, repelledI. brachycera during short-term dispersal. The data indicate that reseeding to monocultures may result in high densities of Miridae during the leaf stages compared with moderate densities of Homoptera during the flower and seed stages in bicu\tures. The implications for pest management are discussed.
KEY WORDS Insecta, Arachnida, sap feeders, predators, crested wheatgrass
THE NUMBEROF ARTHROPODSPECIESand their densities in a habitat are dependent upon the num-ber of plant species and their structural pattern (Murdoch et al. 1972, Root 1973, Southwood et al. 1979, Lawton 1983, Strong et al. 1984). This re-lationship is important to pest management be-cause the infestation of a crop
by
pests is ultimately affected by the pattern of vegetation (Southwood & Way 1970). In agroecosystems, vegetational di-versification generally leads to lower insect pest density, so the potential for using this to manage pests has received much attention (Altieri et al. 1983, Risch et al. 1983, Baliddawa 1985). However, cultural pest controls have not been studied exten-sively on rangelands (Watts et al. 1982). The use of habitat management in pest control may be es-pecially adaptable to reseeded rangelands where vegetation structure is directly under human influ-ence.More than 5 million ha of rangelands have been reseeded with crested wheatgrass (Agropyron spp.) in the intermountain area of the United States (RogIer & Lorenz 1983), and the monoculture na-ture of many of these reseedings is thought to cause outbreaks of grass bugs such as Labops hesperius (Uhler). It is important to know the pest manage-ment implications of these reseeding practices, be-cause economic losses from grass bugs often do not justify insecticide use (Vallentine 1980). Here we
1Currentaddress:DepartmentofEntomology,NewYorkState
AgriculturalExperimentStation,Geneva,N.Y.14456. , To whomreprintrequestsshouldbe addressed.
report on how arthropod faunas are associated with vegetational patterns of reseeded rangelands in western Utah.
Materials and Methods
Study Site. The Tintic Research Site (elevation 1,700-1,830 m) is on the eastern edge of the Great Basin Desert in the northeastern corner of Juab County, Utah (TlIS, R3W, Sections 2, 11, 14, 23, 26, 35). As a cold desert, it receives most of its precipitation as show in the winter and has low winter and high summer temperatures. Fenced pastures on the eastern half of the site were re-seeded in the 1950s with mixtures or single plant-ings of bunchgrasses: crested wheatgrass (Agro-pyron cristatum (L.) Gaertner), tall wheatgrass (Thinopyrum ponticum (Podp.) Barkworth & D. R. Dewey), and intermediate wheatgrass (Elytrigia intermedia (Host) Nevski). Western wheatgrass (Pascopyrum smithii (Rydb.) A. Love) and cheat-grass (Bromus tectorum L.) are also in the pastures. Most woody plants were removed, including big sagebrush (Artemisia tridentata Nutt.) and Utah juniper (juniperus osteosperma (Torrey) Little). These plants have become reestablished on many of the pastures, resulting in a variety of plant species mixtures, including grass monocultures and bicul-tures of grass and woody species. The unseeded western side of the site is dominated by big sage-brush, Utah juniper, and cheatgrass. The study pas-tures were grazed lightly but equally in 1980. None was grazed in 1981.
Table I. Vegetational characteristics of plots in studies of established grass
Characteristic Grass monoculture Grass biculture Shrub-grass Tree-grass
No. plant species
Grass 1 2 1 1
Tree-shrub 0 0 1 1
Grass biomass" 259 ± 75a 195 ± 128a 88 ± 31b 76 ± 25b
aMeans (per m2) not significantly different (P < 0.05) are shown with the same letter (F =8.21, df=3, 12; P < 0.05; ANOVA).
Established Grass Studies. We examined four plots in 1980, each about 3,600 m'. The plots were: a "grass monoculture" of crested wheatgrass, a "grass biculture" of crested and tall wheatgrass, a "shrub-grass" mixture of crested wheat grass and big sagebrush, and a "tree-grass" mixture of crest-ed wheatgrass and Utah juniper (Table 1). Arthro-pods were sampled biweekly from crested wheat-grass with a sweep net (40 em diameter) from early May through late August between 0900 and 1300 hours (MDST) on sunny, calm days with temper-atures >22°C. Because of the "bunchgrass" nature of the grasses, they could be sampled individually. A sample consisted of the arthropods swept from a single grass plant; each plant was swept four to eight times depending on its size. Standing crop of grasses in the reseeded plots was estimated during June by clipping all grass within a I-m' area. Grass phenology was described as being in the leaf, boot, head, and hard-seed stages based on data in Pro-venza (1981). For crested wheatgrass, the leaf stage occurs from early spring to late May before the flower stages occur. The next stages occur after May and are called the boot (flower stalk extension), head (floral structure formation), and hard-seed stages.
Transplanted Grass Studies. Single crested wheatgrass plants were transplanted in March 1981 to five plots at a denSity of 1/0.25 m' from the Blue Creek Nursery near Tremonton, Utah, to the Tintic site. Locations of the grass plants within the plot were randomized, and the distance to surrounding vegetation was 0.2 m. The grass monoculture, grass biculture, and shrub-grass plots were the same as in the established grass studies (Table 1). The two remaining plots were an unseeded area of big sage-brush and cheatgrass ("native sagesage-brush") and an unseeded area of Utah juniper, big sagebrush, and cheatgrass ("native juniper"). During arthropod sampling (13 May and 17 June), a cage was dropped quickly over the grass plant and all foliage within the cage was passed over three times with a D-vac hose(see Southwood 1978). Grass within the cage was clipped and the plant was suctioned again. Samples in late May and mid-June at the Blue Creek site produced no species found in the Tintic samples; therefore we assume the transplanting did not transfer a significant number of arthropods to the Tintic site.
Grass Density-Sagebrush Repellency Experi-ments. Crested wheatgrass plants were transplant-ed in early April 1981 from the Blue Creek Nursery
to the Tintic site into a crested wheatgrass mono-culture. Three densities (1,2, and 4 plants/0.25 m') were each replicated three times in random loca-tions; the distance to surrounding vegetation was 0.2 m. D-vac sampling was done on 29 May and 2 July. To test the repellent nature of big sagebrush to the major mirids, 125 nymphs of Irmsia bra-chycera Uhler and 232 nymphs of Conostethus americanus (Knight) were collected during the morning of 4 May 1981 and released at the mid-point between two crested wheatgrass plants about 1 m apart. One plant had a handful of sagebrush leaves next to it, away from the point of insect release, and the other plant was an untreated con-trol. The insects were collected by aspiration about 10 h later.
Taxonomic and Statistical Analyses. Most sap-feeder species were identified to species level, and the remainder were identified as "operational taxo-nomic units" (OTUs) (=species; see Vandermeer 1972) for the purpose of calculating richness (num-ber of species) and doing cluster analyses. Arthro-pod biomass estimates were made by measuring individuals to the nearest 0.5 mm and using length-biomass coefficients reported for shrub-steppe in-vertebrates (Rogers et ai. 1976, 1977). Differences in arthropod densities and grass biomass between plots were tested using analysis of variance (AN-OVA) of log(x
+
1) transformed data, followed by Student-Neuman-Keuls tests for separation of means (SASInstitute 1985). Chi-square analysis was used for the sagebrush repellency experiment. To determine sap-feeder faunal similarities, cluster analyses were done using the UPGMA clustering method and correlation coefficient as a similarity index (Marshall & Romesburg 1978).Results and Discussion
Grass Biomass and Major Arthropods. Grass biomass was greatest in the grass monoculture and lowest in the shrub-grass and tree-grass plots (Ta-ble 1). Sap feeders (Heteroptera) and predators (primarily Araneida) comprised 90% of all indi-viduals captured (Table 2). The major sap feeders were I. brachycera and C. americanus (Miridae), Dikraneura carneola (Stlil) (Cicadellidae), and Laccocera obesa (Van Duzee) (Delphacidae). These four species comprised 69% of all arthropods cap-tured and 91% of all sap feeders. The first three species occurred primarily on crested wheatgrass and L. obesa primarily on tall wheatgrass. I.
bra-o
aLeal Boot, Head, and
Stage Seed Stages
Fig. 2. Biomass of sap feeders and predators in stud-ies of established grass during leaf and flowering (boot, head, and seed) stages of crested wheatgrass. Bars not significantly different within each arthropod group are shown with same letter (P < 0.05, Student-Neuman-Keuls test). ANOYA results (df =7, 292) were Hemip-tera, F value =16.5; Homoptera, F value =5.6; pred-ators, F value =1.0.
-- I. brachycera ---.-_. C. americanus •.•.•.•.••••. L. obesa
aUnidentified sap-feeder taxa (OTUs) are in parentheses.
bMost abundant groups comprising 90.4% of all arthropods.
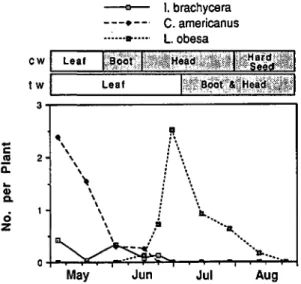
chycera, C. american us, and L. obesa exhibited strong relationships to grass phenology. Abundance of C. americanus and I. brachycera was greatest during the leaf stages of crested wheatgrass and
Table 2. Sap-feeding and predaceous arthropods of • Grass Monoculture
study • Grass Biculture
Order Family Species"
o
Shrub-Grasslia Tree-Grass
Araneidab Clubionidae Micaria sp., others 10
Philodromidae Tibellus chamberllni Gertsch
Eho sp. HEMIPTERA
Salticidae a (Sap-Feeders)
Theridiidae Unknown
Hemiptera Lygaeidae GeocOTis sp., (4 OTUs) 5
Miridae Conostethus americanus (Knight)b
Irbisia brachycera (Uhler)b Leptotema sp.
(IOTU) Nabidae Nabis sp.
0
Pentatomid~e (20TUs)
Homoptera Aphididae (IOTU) 1.8
Cicadellidae Amblysellus grex (Oman) HOMOPTERA a
Athysanella attenuata (Baker)
-
r:::
Balclutha abdominalis (Van Du-
as
1.2
zoo)
C. ab
Dikraneura cameola (St:il)b
Empoasca nigra var. typhlocy-
•..
bhoides Gillette & Baker Q)
0.6 ab
Hardya dentata (Osborn & Ball) C.
Hebecephalus sp.
Hecalus viridis (Uhler) C)
Tribe Gyponini
E
0Coccoidea (IOTU)
2.4
Delphacidae Laccocera obesa Van Duzeeh
lssidae Aphenolema rugosa (Ball) PREDATORS a
Psyllidae Aphalara sp.? 1.8 Neuroptera Chrysopidae Coleoptera Carabidae Cleridae Phyllohoenus sp. 1.2 a Coccinellidae Hippodamia sp. Metyridae Attalus sp. a a Collops sp. 0.6 Staphylinidae
May Jun Jul Aug
Fig. 1. Abundance of three major sap feeders in 1980 related to phenology of crested wheatgrass (cw) and tall wheat grass (tw).
-
c .!! a..•..
G) a. ci Z 2 o II \ \ \ \ \ '\ \ \ \ \ \ \ \ \~.
:', ,.
..
,.
..
i \.
f
\'"
i ia.. :D. •••••••• :....
--<It' ". 110 ••••rapidly declined as the grass approached boot stage (Fig. 1). Nymphs and adults of Irbisia spp. gen-erally occurred during the spring when winter and spring moisture is regenerating cool-season grass hosts (Schwartz 1984). In contrast, L. obesa pop-ulations appeared in mid-June and peaked in the boot and head stages of tall wheatgrass in early July (Fig. I), when late-instar nymphs and adults fed on stems and seeds of tall wheatgrass. D. car-neola was variable, being present in samples from May to August.
Established Grass: Arthropod Densities. Dur-ing the leaf stage of crested wheatgrass, hemipteran sap feeders had the greatest density in the grass monoculture, whereas they were at very low levels in the three biculture plots (Fig.
2);
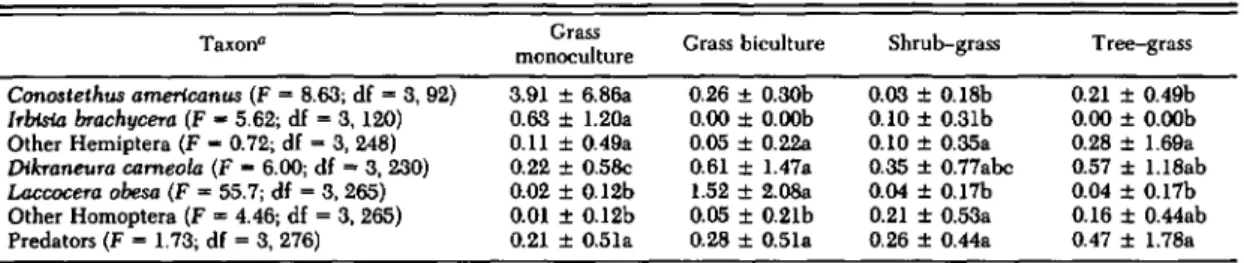
this difference was primarily because of I. brachycera and C.Table 3. Mean abundance (no./plant) of important arthropod groups in studies of established grass
Taxono Grass Grass biculture Shrub-grass Tree-grass
monoculture
Con03lelhus amerlcanus (F=8.63; df =3. 92) 3.91 ± 6.86a 0.26 ± 0.30b 0.03 ±0.18b 0.21 ±0.49b
rrbfsta brachycera (F - 5.62; df=3. 120) 0.63 ± 1.2Oa 0.00 ±O.OOb 0.10 ±0.31b 0.00 ± O.OOb
Other Hemiptera (F - 0.72; df=3, 248) 0.11 ± 0.49a 0.05 ± 0.220 0.10 ± O.35a 0.28 ± 1.69a
Dikraneura cameo/a (F - 6.00; df =3. 230) 0.22 ± 0.5Se 0.61 ± 1.47a 0.35 ± 0.77abc 0.57 ± 1.18ab
Laccocera obesa (F =55.7; df =3, 265) 0.02 ± 0.12b 1.52 ± 2.080 0.04 ± 0.17b 0.04 ± 0.17b
Other Homoptera (F=4.46; df=3. 265) 0.01 ± 0.12b 0.05 ± 0.21b 0.21 ± O.53a 0.16 ± 0.44ab Predators (F=1.73; df=3. 276) 0.21 ± 0.51a 0.28 ± 0.51a 0.26 ± 0.44a 0.47 ± 1.78a Means not significantly different within each taxon have the same letter (P < 0.05; Student-Newman-Keuls test).
a F values and degrees of freedom from ANOVA are shown in parentheses.
Leaf Stage Head Stage Fig.3. Biomassof sap feeders and predators in stud-ies of transplanted grass during leaf and head stages of crested wheatgrass. Barsnot significantly different within each arthropod group are shown with same letter(P < 0.05, Student-Neuman-Keuls test). ANOVA results (df
=
9, 40) were Hemiptera, F value=
8.0; Homoptera, F value=
5.2; predators, F value=
0.7.o
8 • Grass Monoculturea
Grass Biculture II Shrub-Grassrn
Native Sagebrusho
Native Juniper 12 a HEMIPTERA (Sap-Feeders) 8 40
bb All Zero 2.4-
a HOMOPTERA C abas
1.6-
~
•..
(1)0.8
~
bCl
bE
0
b b 24a
PREDATORS 16 a a aamericanus (Table 3). These species were at low densities in all plots during the postleaf stages. The shrub-grass and tree-grass plots were dominated by Homoptera, mostly D. carneola, during the postleaf stages. L. obesa was most abundant in the grass biculture because of the presence of tall wheatgrass. Predator densities were not statistically different in any plots or sampling dates but had a tendency to be greater during the postleaf stages (Fig. 2; Table 3).
Transplanted Grass: Arthropod Densities. These studies also revealed large faunal differences be-tween plots, again mostly because of I. brachycera and C. americanus. During the leaf stage, the grass monoculture had the greatest density of sap-feed-ing Hemiptera (Miridae), whereas mirids were at very low densities in the shrub-grass and grass bi-culture plots and were completely absent from the native areas (Fig. 3; Table 4). In contrast, Homop-tera were generally most abundant in the native areas and grass monoculture during the leaf stage. L. obesa did not colonize any of the transplanted grass plants, even in the grass biculture plot where it was most abundant (Table 3). Predator density was approximately equal on both sampling dates but showed a tendency to be greater in the native areas.
Faunal Similarities and Species Richness. The cluster analyses of sap feeders from the established grass (Fig. 4a) and transplanted grass (Fig. 4b) stud-ies demonstrated the distinctiveness of the grass monoculture from all other plots, mainly because of high densities of the mirids 1. brachycera and C. americanus. The vegetationally diverse shrub-grass and tree-shrub-grass plots had greater numbers of sap-feeder species than the vegetationally simpler grass plots in the established grass studies (Fig. 4a). This pattern did not occur in the transplanted grass experiments (Fig. 4b), but we attribute this to the short-term (one season) nature of these experi-ments.
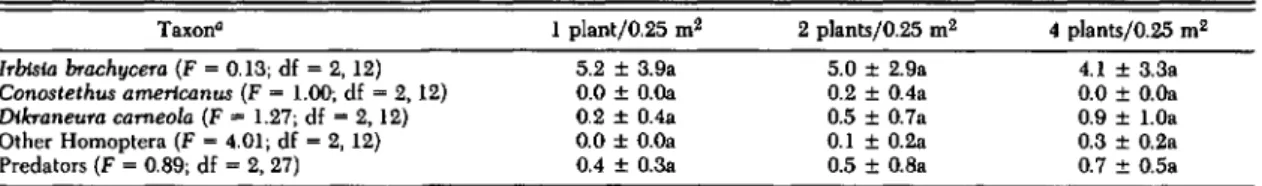
Grass Density, Sagebrush Repellency, Preda-tors. Results from this experiment did not support the hypothesis that arthropod faunas in the plots varied because of differences in crested wheatgrass density. Abundance of I. brachycera was inversely related to experimentally created grass density (Ta-ble 5), whereas in the other studies it was most
Table 4. Mean abundance (no./plant) of important arthropod groups in studies of transplanted grass
Taxona Grass Grass Shrub-grass Native Native
monoculture biculture sagebrush juniper
Irbisla brachycera (F=8.98; df=4, 20) 3.8 ±2.4a 0.0 ±O.Ob 0.0 ±O.Ob 0.0 ±O.Ob 0.0 ±O.Ob
Conostethus americanus (F=5.23; df =4, 20) 3.0±2.5a 0.4 ±0.5b 0.8 ±0.8b 0.0±O.Ob 0.0 ±O.Ob
Dikraneura cameo/a (F=3.84; df=4, 45) 0.4±0.7b 0.1 ±0.3b 0.0 ±O.Ob 1.7 ±2.3a 0.3 ±0.6b
Predators (F=1.56; df =4, 45) 0.5 ±0.5a 0.5 ±1.0a 0.3 ±0.5a 0.4 ±0.7a 0.6 ±0.8a Means not significantly different within each taxon have the same letter (P < 0.05; Student-Newman-Keuls test).
aF values and degrees of freedom from ANOV A are shown in parentheses.
Shrub-Grass (2 species) Native Juniper (2 species) Native Sagebrush (1 species)
Fig.4. Cluster analysisof plots using abundance (no./ plant) of sap feeders in studies of (a) established grass and (b) transplanted grass.
abundant in the plot with the greatest grass density, the grass monoculture (Tables 3 and 4). C. ameri-canus did not colonize the plants. D. carneola, oth-er Homoptoth-era, and predators were positively re-lated to grass density in this experiment (Table 5) but were variable in relation to grass density in the other studies (Tables 3 and 4).
Leaves of big sagebrush were repellent to I. bra-chycera during short-term dispersal; grass plants having sagebrush leaves in the sagebrush repellen-cy experiment had significantly fewer (23%; P
<
0.05) individuals of I. brachycera than the plant with no leaves (77%). C. americanus showed no preference
(60%
on the plant with leaves; P>
0.05). Similarly, Ostlie (1979) showed clearly that L. hesperius dispersed away from asagebrush-(b) Transplanled Grass (a) Established Grass
1.0 Grass Monoculture (8 species) Grass Blculture (5 specieS) Shrub-Grass (14 species) Tree-Grass (12 speCieS) 1.0 Grass Monoculture (4 species) Grass Blculture (3 specieS) 0.75 0.75 0.5 0.5 0.25 0.25 0.0 0.0
grass mixture and moved toward a grass mono-culture.
The influence of predators on sap-feeder faunas is not supported by our data. Predator densities were approximately equal in all the reseeded plots (Fig. 2 and 3; Tables 3 and 4), yet the sap-feeder faunas were noticeably different. However, we ex-amined predators only as pooled species, and par-ticular species may have had different densities in the plots. The role of predators needs to be ex-amined more closely in this system because vege-tational diversification can enhance control of pests by predators (Ali&Reagan 1985, Brust et al.1986). Araya & Haws (1988) found that nabids and spiders are important predators of L. hesperius in reseeded rangelands.
Pest Management Implications. Our study in-dicates that the vegetation associated with reseeded bunch grasses may have an effect on the structure of arthropod faunas. Our results agree with the finding of Risch et at. (1983) that diverse systems generally have lower pest populations. Similar re-sults have been found for Brassica crops (Pimentel 1961, Tahvanainen &Root 1972, Root 1973, Crom-artie 1975, Smith 1976, Ryan et at. 1980), cucum-bers (Bach 1980a, b), and others (Risch 1980, 1981; Smith & Whittaker 1980a, b; Power 1987). Our results also agree with those of Murdoch et at. (1972) and Denno (1977), who found more diverse sap-feeder faunas where the vegetation was more com-plex. Sheehan (1986) states the important question of whether results of many of the small-plot studies concerning vegetation structure and arthropod fau-nas can be extrapolated to "large-scale" agricul-ture. The areas examined in our study are repre-sentative in size of those used in reseeded rangeland pastures.
Grass bugs such as Irmsia pacifica (Uhler) (Han-sen & Nowak 1988) and L. hesperius (Ansley & McKell 1982) lower forage production and vigor in wheatgrasses, and monoculture reseeding of rangelands has been implicated as causing prob-lems from L. hesperius (Kamm &Fuxa 1977, Ostlie 1979, Ansley & McKell 1982). Keller (1979), in particular, is a strong advocate for the discontin-uation of monoculture reseedings on rangelands. Plantings of the major forage species appropriately mixed with native or resistant species and legumes (which tend to have high levels of beneficial ar-thropods) have been recommended for pasture sys-tems (Martin 1983) and may offer long-term pest
Table 5. Mean abundance (no.lplant) of important arthropod groups colonizing transplanted crested whelltgrass in three experimental densities
Taxon" Irblsia brachycera (F=0.13; df=2, 12) Conostethus amerlcanus (F =1.00; df =2, 12) Dlkraneura cameola (F
=
1.27; df=
2, 12) Other Homoptera (F =4.01; df=2, 12) Predators (F=0.89; df =2, 27) 1 plantjO.25 m2 5.2 ±3.9a 0.0 ± O.Oa 0.2 ± 0.4a 0.0 ± O.Oa 0.4 ± 0.3a 2 plantsjO.25 m2 5.0 ± 2.9a 0.2 ± 0.4a 0.5±0.7a 0.1 ±0.2a 0.5±0.8a 4 plantsjO.25 m2 4.1 ± 3.3a 0.0 ± O.Oa 0.9 ± 1.0a 0.3 ± 0.2a 0.7 ± 0.5aMeans not significantly different within each taxon have the same letter (P < 0.05; Student-Newman-Keuls test). " F values and degrees of freedom from ANOV A are shown in parentheses.
control on rangelands (Watts et al. 1982).Reseeded rangelands may be systems which are particularly adaptable to this method of pest control.
Arthropod densities may be dependent upon the plant species present rather than plant diversity per se (Letourneau 1987). The grass biculture, al-though composed entirely of two similar species of bunchgrasses, had very low mirid densities. This may have been because tall wheatgrass in this plot apparently was unsuitable to mirids. In contrast, we commonly observed mirids on crested wheat-grass and western wheatgrass.
Temporal patterns of arthropod densities also may be important. The high densities of mirids we observed in the grass monoculture occurred pri-marily during the spring when root (Ansley & McKell 1982) and total nonstructural (Caldwell et al. 1981) carbohydrates of crested wheatgrass are lowest. These populations, occurring at earlier dates, may be more damaging to crested wheatgrass than at later dates because of these low carbohydrate reserves.
Acknowledgment
The following people identified arthropod taxa: Mi-chael P. Schwartz, Miridae; Mervin W. Nielson and Paul Oman, Cicadellidae; and Stephen M. Wilson, Delphac-idae and IssDelphac-idae. Support was provided by the Four Corners Regional Commission (FCRC grant 602-466-808-4), the Tintic Range Research Project (Utah State University Range Science Department), and the Utah State University Ecology Center. The USDA Crops Re-search Laboratory (Logan, Utah) provided the grass transplants.
References Cited
Ali, A. D. & T. E. Reagan. 1985. Vegetation manip-ulation impact on predator and prey popmanip-ulations in Louisiana sugarcane ecosystems.
J.
Econ. Entomol. 78: 1409-1414.Altieri, M. A" P. B, Martin & W. J, Lewis. 1983. A quest for ecologically based pest management sys-tems. Environ. Manage. 7: 91-101.
Ansley, R. J. & C. M. McKell. 1982. Crested wheat-grass vigor as affected by black wheat-grass bug and cattle grazing.
J.
Range Manage. 35: 586-590.Arayll, J. E. & B. A. HllWS. 1988. Arthropod predation of black grass bugs (Hemiptera: Miridae) in Utah ranges.
J.
Range Manage. 41: 100-103.Bach, C. E. 1980a. Effects of plant diversity and time of colonization on an herbivore-plant interaction. Oecologia 44: 319-326.
1980b. Effects of plant density and diversity on the population dynamics of a specialist herbivore, the striped cucumber beetle, Acalymma vittata (Fab.). Ecology 61: 1515-1530.
Baliddawa, C. W. 1985. Plant species diversity and crop pest control. Insect Sci. Appl. 6: 479-487. Brust, G. E., B. R. Stinner &D. A. McCartney. 1986.
Predation by soil-inhabiting arthropods in inter-cropped and monoculture agroecosystems. Agric. Ecosyst. & Environ. 18: 145-154.
Caldwell, M. M., J. H. Richards, D. A. Jobnson, R. S. Nowak & R. S. Dzurec. 1981. Coping with her-bivory: photosynthetic capacity and resource allo-cation in two semiarid Agropyron bunchgrasses. Oecologia 50: 14-24.
Cromartie, W. J. 1975. The effect of stand size and vegetational background on the colonization of cru-ci£erous plants by herbivorous insects.
J.
Appl. Eco!. 12: 517-533.Denno, R. F. 1977. Comparison of the assemblages of sap-feeding insects (Hemiptera-Homoptera) in-habiting two structurally different salt marsh grasses
in the genus Spartina. Environ. Entomo!. 6: 359-372.
Hansen, J. D.&R. S. Nowak. 1988. Feeding damage by Irhisia pacifica (Hemiptera: Miridae): effects of feeding and drought on host plant growth. Ann. Ento-mol. Soc. Am. 81: 599-604.
Kamm, J. H.&J. R. Fuxa. 1977. Management prac-tices to manipulate populations of the plant bug
La-bops hesperius Uhler.
J.
Range Manage. 30: 385-387. Keller, W. 1979. Species and methods for seeding inthe sagebrush ecosystem, pp. 129-163. In The sage-brush ecosystem (April 1978). Utah State University, College of Natural Resources, Logan.
Lawton, J. H. 1983. Plant architecture and the di-versity of phytophagous insects. Annu. Rev. Entomol. 28: 23-29.
Letourneau, D. K. 1987. The enemies hypothesis: tritrophic interactions and vegetational diversity in tropical agroecosystems. Ecology 68: 1616-1622. Marshall, K. & H. C. Romesburg. 1978. CLUSTAR
and CLUSTID-programs for hierarchical cluster analysis, Report 34.In
J.
A. Henderson &L. S. Davis [eds.], ECOSYM-an ecosystem classification and data storage system for natural resource management. Utah State University, College of Natural Resources, Lo-gan.Martin, P. B. 1983. Insect habitat management in pasture systems. Environ. Manage. 7: 59-64. Murdoch, W. W., F. C. Evans & C. H. Peterson. 1972.
Diversity and pattern in plants and insects. Ecology 53: 819-829.
Ostlie, K. R. 1979. Labops hesperlus Uhler: abun-dance and dispersal in relation to vegetation. M.S. thesis, Utah State University, Logan.
Pimentel, D. 1961. Species diversity and insect pop-ulation outbreaks. Ann. Entomol. Soc. Am. 54: 76-86.
Power, A. G. 1987. Plant community diversity, her-bivore movement, and an insect-transmitted disease of maize. Ecology 68: 1658-1669.
Provenza, F. 1981. Species phenology, pp. 12-22. In
J.
C. Malachek, B. E. Norton & D. D. Dwyer [eds.], 1980 Annual project report and work plan to Utah Agricultural Experiment Station. Project 771. Utah State University, Logan.Risch, S.J. 1980. The population dynamics of several herbivorous beetles in a tropical agroecosystem: the effect of intercropping corn, beans, and squash in Costa Rica.
J.
Appl. Ecol. 17: 593-612.1981. Insect herbivores in tropical monocultures and polycultures: an experimental test of two hypotheses. Ecology 62: 1325-1340.
Risch, S.J.,D. Andow&M. A. Altieri. 1983. Agro-ecosystem diversity and pest control: data, tentative conclusions, and new research directions. Environ. Entomol. 12: 625-629.
Rogers, L. E., W. T. Hinds &R. L. Buschbom. 1976. A general weight vs. length relationship for insects. Ann. Entomol. Soc. Am. 69: 367-369.
Rogers, L. E., R. L. Buschbom &C. R. Watson. 1977. Length-weight relationships of shrub-steppe inver-tebrates. Ann. Entomol. Soc. Am. 70: 57-63. RogIer, G. A. & R.
J.
Lorenz. 1983. Crestedwheat-grass-early history in the United States.
J.
Range Manage. 36: 91-93.Root, R. B. 1973. Organization of a plant-arthropod association in simple and diverse habitats: the fauna of collards (Brassica oleracea). Ecol. Monogr. 43: 95-120.
Ryan, J., M. F. Ryan & F. MacNaiede. 1980. The effect of inter row plant cover on populations of the cabbage root fly, Delta brassicae (Wiedemann).
J.
Appl. Ecol. 17: 31-40.SAS Institute. 1985. SAS user's guide: statistics. SAS Institute, Cary, N.C.
Schwartz, M. D. 1984. A revision of the black grass bug genus Irbtsia Reuter (Heteroptera: Miridae).
J.
N.Y. Entomol. Soc. 92: 193-306.Sheehan, W. 1986. Response by specialist and gen-eralist natural enemies to agroecosystem diversifica-tion: a selective review. Environ. Entomol. 15: 456-461.
Smith, J.G. 1976. Influence of crop background on aphids and other phytophagous insects on brussels sprouts. Ann. Appl. BioI. 83: 1-13.
Smith, R. W.&J.B. Whittaker. 1980a. The influence of habitat type on the population dynamics of
Gas-trophysa viridula populations (Coleoptera: Chryso-melidae).
J.
Anim. Ecol. 49: 225-236.1980b. Factors affecting Gastrophysa virldula pop-ulations (Coleoptera: Chrysomelidae) in different habitats.
J.
Anim. Ecol. 49: 537-548.Southwood, T. R. E. 1978. Ecological methods, 2nd ed. Chapman & Hall, London.
Southwood, T. R. E.&M.J.Way. 1970. Ecological background of pest management, pp. 6-29. In R. L. Rabb & G. E. Guthrie [eds.], Concepts of pest man-agement. North Carolina State University Press, Ra-leigh.
Southwood, T. R. E., V. K. Brown & P. M. Reader. 1979. The relationships of plant and insect divers-ities in succession. Bioi.
J.
Linn. Soc. 12: 327-348. Strong, D. R., J. H. Lawton & T. R. E. Southwood.1984. Insects on plants. Harvard University Press, Cambridge, Mass.
Tahvanainen, J.O.&R. B. Root. 1972. The influence of vegetational diversity on the population ecology of a specialized herbivore, Phyllotrea cruciferae (Co-leoptera: Chrysomelidae). Oecologia 10: 321-346. Vallentine, J. F. 1980. Range development and
im-provements, 2nd ed. Brigham Young University Press, Provo, Utah.
Vandermeer, J.H. 1972. Niche theory. Annu. Rev. Ecol. Syst. 3: 107-132.
Watts, J.G., E. W. Huddleston &J.C. Owens. 1982. Rangeland entomology. Annu. Rev. Entomol. 27: 283-312.
Received for publication 3 January 1989; accepted