HAL Id: hal-01187400
https://hal.archives-ouvertes.fr/hal-01187400
Submitted on 13 Jul 2016
HAL is a multi-disciplinary open access
archive for the deposit and dissemination of
sci-entific research documents, whether they are
pub-lished or not. The documents may come from
teaching and research institutions in France or
abroad, or from public or private research centers.
L’archive ouverte pluridisciplinaire HAL, est
destinée au dépôt et à la diffusion de documents
scientifiques de niveau recherche, publiés ou non,
émanant des établissements d’enseignement et de
recherche français ou étrangers, des laboratoires
publics ou privés.
Simplified detection and labeling of overlapping
communities of interest in question-and-answer sites
Zide Meng, Fabien Gandon, Catherine Faron Zucker
To cite this version:
Zide Meng, Fabien Gandon, Catherine Faron Zucker. Simplified detection and labeling of overlapping
communities of interest in question-and-answer sites. IEEE/WIC/ACM 2015 - International
Confer-ence on Web IntelligConfer-ence and Intelligent Agent Technology (WI-IAT), Dec 2015, Singapore, Singapore.
pp.107-114, �10.1109/WI-IAT.2015.184�. �hal-01187400�
Simplified detection and labeling of overlapping
communities of interest in question-and-answer sites
Zide Meng
INRIA Sophia Antipolis M´editerran´ee France
Fabien Gandon
INRIA Sophia Antipolis M´editerran´ee France
Catherine Faron Zucker
University Nice Sophia Antipolis, CNRS, I3S France
Abstract—In many social networks, people interact based on their interests. Community detection algorithms are then useful to reveal the sub-structures of a network and in particular interest groups. Identifying these users’ communities and the interests that bind them can help us assist their life-cycle. Certain kinds of online communities such as question-and-answer (Q&A) sites or forums, have no explicit social network structure. Therefore, many traditional community detection techniques do not apply directly. In this paper, we propose TTD (Topic Trees Distributions) an efficient approach for extracting topic from Q&A sites in order to detect communities of interest. Then we compare three detection methods we applied on a dataset extracted from the popular Q&A site StackOverflow. Our method based on topic modeling and user membership assignment is shown to be much simpler and faster while preserving the quality of the detection.
I. INTRODUCTION
Question-and-answer sites (Q&A sites) initially aimed at enabling users to ask questions to a community of ex-perts. Since these user-generated contents can be viewed and searched again, people with the same or similar questions can find answers by browsing or searching the questions that were already answered. On one hand, Q&A sites have become huge repositories of question-answer content which support highly valuable and highly reusable knowledge [1]. On the other hand, Q&A sites also contain a large number of users who keep contributing questions and answers. And most of them are more likely to ask questions on topics they are interested in and answer questions in topics they are experts of.
Therefore, we believe that there are two main resources in Q&A sites: the users’ network and the Q&A content. From a user’s perspective, detecting communities of interests is useful to reveal the sub-structures of the user network and identify relevant peers. From the perspective of content, extracting topics is required to uncover the key subjects from massive content. So we are interested in the following research questions: Can we detect communities of interests in Q&A sites? Can we identify the common topics that bind them? Detecting communities of interests can contribute to the question routing problem [2][3], which is very important in Q&A sites optimization problems. It can also contribute to the community management, for instance by allowing to track the interest evolution or community evolution in Q&A sites.
Many community detection algorithms have been devel-oped to discover sub-structures in social networks. Q&A sites support social networking, however, unlike networks such
as Facebook, there are no explicit relationship-based links between their users. In fact, Q&A sites capture the connection of users by question-answer links or co-answer links. The users are not mainly concerned with nor aware of the links existing between them. The social network is said to be implicit. As a result, compared with other classical social networks, Q&A networks contain more star-shape structures (many users linked to a central user) than triangle-shape structures (users linked to each other). Moreover, people have multiple interests i.e. they belong to several communities of interests. It is therefore important to be able to detect their overlapping communities of interests.
We first tried to adapt a document clustering algorithm to the user clustering problem, similarly to [4]: we applied the classic LDA [5] algorithm to assign each user into several topic clusters, by replacing in this algorithm the documents by the users, and the document words by the tags acquired by users. The results were encouraging, however, the complexity of the probabilistic model was prohibitive. When analyzing the LDA model, we found that it largely exploits tags’ co-occurrence. This inspired us to design a much simpler and faster algorithm to detect topics. Then, based on the detected topics, we were able to identify the users’ interests. So the main contributions of this paper are, (1) a topic detection method to extract topics based on question tags, and (2) a user interest detection method to discover overlapping communities of interests.
The rest of the paper is organized as follows. Firstly, we survey the state of the art of community detection approaches, and point out the differences among these works. Secondly, we introduce an empirical method to detect topics. Then we assign each user to these detected topics based on their interaction behaviors. Thirdly, we report the results of several experiments. They show that our approach is much faster and simpler, compared with other classic approaches, e.g. LDA [5], SLPA [6], and a Hierarchical clustering algorithm, while preserving the quality of the detection. Finally, we discuss about those methods and conclude on our contribution.
II. RELATEDWORK
We distinguish between three kinds of approaches for com-munity detection, depending on their characteristics: Graph-based methods are Graph-based on network structure; Clustering methods are based on the similarity of user profiles; LDA-based methods use probabilistic graphical model.
A. Graph-based methods
A first and direct solution is to extract an implicit net-work structure (such as question-answer netnet-work, co-answer network, etc.) from interaction traces to come down to a traditional community detection problem on social networks. Since intuitively, users are grouped by interests, and most of their interactions are based on shared interests, it is reasonable to induce a network structure from these interactions and then run community detection algorithms on the network. Many classical algorithms have been developed such as [6][7]. There are many constraints when adopting these methods. First, they do not take into account node attributes nor link attributes. Take co-answer network as an example, where nodes represent users and links represent users answering the same questions. In case two users are connected, these methods can only indicate that they have answered the same questions many times. They cannot provide the information whether they have answered questions on the same topic or on different topics. Second, some of the works adopting this approach cannot detect overlapping communities, while other works such as [6] address this problem.
B. Clustering methods
Community detection can also be envisioned as a clustering problem. By computing similarities between user profiles, one can detect groups according to clustering results. The choice of the similarity metrics is quite important and largely influences clustering results. To find similar interests, we first have to define the distance between user’s interests and the definition of this distance has a strong influence on the clustering results. For instance, we can consider a bag of tags with their weights to represent an interest, then compute the weighted tag distance to define the interest distance between two users. Clustering methods, such as [8][9], group users according to their features. They do not take the network structure into consideration. Moreover, some clustering algorithms normally output hard-partition communities, one user can only be as-signed to one interest group. However, in the scenario we are interested in, a user often has more than one interest and should be assigned to more than one group simultaneously. This is a constraint for those hard-partition algorithms. [10] use spectral clustering to detect topics from the graph of tag co-occurrence. Compared to it, our approach is more efficient since we only run spectral clustering on a co-occurrence graph of selected tags (only 10% of all the tags). Besides, [10] does not give any details on how to compute the topic tag distribution and user topic distribution, while we do.
C. LDA-based models
A third approach consists in using a probabilistic graphical model for both the user profiles and the network structure to solve community detection problem. For example, [11] transform links to binary node attributes, then use a LDA-based model to detect communities. [12] use a LDA-LDA-based method on social tagging systems where users label resources with tags, but they do not consider the problem of overlapping community detection. [13] use an extended LDA-based model to analyze academic social networks in order to find expert au-thors, papers and conferences. A problem of these LDA-based models is that they normally assume soft-membership [14]
which means that a user cannot have high probabilities to belong to several communities simultaneously. That is to say that the more communities a user belongs to, the less it belongs to each community (simply because probabilities have to sum to one). Moreover, [15] and [16] also use statistic model to detect overlapping communities. The difference is that LDA-based models normally integrate topic detection which can be used to interpret detected communities while the two above cited methods only detect overlapping communities without any topic information on each detected communities.
D. Short Summary
Table I summarizes the main features of the three ap-proaches. Graph-based approaches normally use link infor-mation while ignoring node attributes. Some of them cannot detect overlapping communities or provide membership ratios which are weights denoting to what extent a user belongs to a community. Most of these methods cannot identify the topic in each detected community. Clustering approaches use node attributes to group similar users. Some of their results are hard-partition communities, with no overlapping and no membership information. LDA-based models overcome the shortcomings of graph-based and clustering approaches, using both node attributes and link information. Besides, LDA-based models normally combine community detection with topic de-tection, which could be used to interpret detected communities. Our proposed method is similar to LDA-based methods, in that it also enables to detect overlapping communities and identify the topics at the same time. It differs from LDA-based methods in that it enables to consider a user having high probabilities to belong to several communities simultaneously while these methods normally assume soft-membership [14]. In addition, our proposed method is much simpler and faster than LDA-based methods while preserving the quality of the detection.
TABLE I: Comparison of the main approaches and our method
uses nodes uses links overlap membership topic Graph-based no yes few few no Clustering methods yes no few few no LDA-based yes yes yes yes yes Our-method yes yes yes yes yes
III. TTD: TOPICTREESDISTRIBUTIONS MODEL
A. Problem Definition
In StackOverflow1, a user submits a question, then assigns
between 1 and 5 tags to indicate the topic of the question. Other users who are interested in the question may provide answers to the question. As the tags attached to the question can reflect its topic, users answering the question can be considered as interested by this topic. Let U = {u1, u2...un} be the set
of users, Q = {q1, q2...qm} the set of questions and T =
{t1, t2...tv} the set of tags. We aim at (1) extracting topics
distribution T opic = {topic1, topic2...topick} from T , and
for each topick, defining topick= {pk1, pk2...pkv} where pki
denotes the probability of tag ti to be related to topick; and
then (2) detecting user’s interests. For a user ui∈ U , we define
Ii= {Ii1, Ii2...Iik} where Iikdenotes the probability of ui to
be interested in topick.
B. First-Tag Enrichment
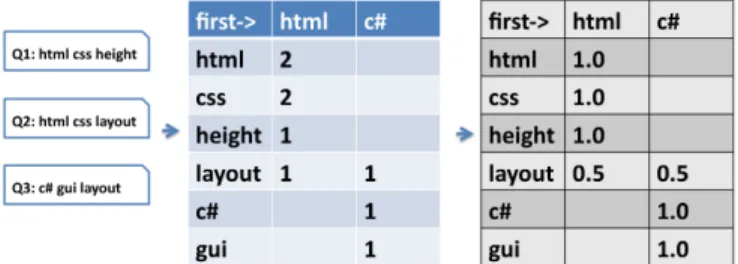
When sorting the tags of a question by their global fre-quency, we found that normally the first tag of a question is much more general and indicates the domain of the question. For example, a question tagged with {c#, iostream, fstream} is related to c#; A question tagged with {html, css, height} is related to html. However, there are also some questions which have less tags and, in this case, the tags are less popular, like a question tagged with {ant} or a question tagged with {qt, boost}. For these questions, the main domain is implicit. Our experiment dataset shows that nearly 12% questions only have one tag, and nearly 25% questions only have two tags. We propose an approach to enrich a question with a first tag when needed. It has two steps, the first one consists in computing the first-tag distribution. For example, as shown in Figure 1,
Fig. 1: Example of computing a first-tag distribution
let us consider the three tag lists, {html, css, height}, {html, css, layout}, and {c#, gui, layout}, respectively associated to questions Q1, Q2, Q3 . The first-tag frequency map for html is {html:2}, the first-tag frequency map for css is {html:2}, and the first-tag frequency map for layout is {html:1,c#:1}. Given a tag, the probability of its first-tag is computed by equation 1, which is the MLE (most likelihood estimation) of the probability p(f irst tag|tag), where I(tag) denotes the occurrence of tag and I(f irst tag, tag) denotes the co-occurrence of f irst tag and tag.
p(f irst tag|tag) =p(f irst tag, tag) p(tag) =
I(f irst tag, tag) I(tag) (1)
We compute the probabilities just by normalizing the first-tag frequency map. In the example, the first-tag frequency map for css becomes {html:1.0} and the first-tag frequency map for layout becomes {html:0.5,c#:0.5}. In order to lower the probabilities of low frequency tags as first-tag, we use the squashing function 2:
p(f irst tag|tag) =I(f irst tag, tag)
I(tag) ∗ σ(I(f irst tag)) = record f req
sum(record f req)∗ 1 (1 + e−k∗f req)
(2)
where, record f req denotes the co-occurrence of first-tag and tag, sum(record f req) denotes the sum of these recorded frequencies, f req denotes the global occurrence of the first-tag, σ(x) is sigmoid function, which is used as a squashing function for numerical stability. The value of sigmoid function is between 0 and 1. However, the shape of this function is largely determined by parameter k. Considering the maximum value
of tag frequency (tag c#:31, 801) in our dataset, we chose k as 0.001 (dotted line), which will lower the probabilities of low frequency tags as first-tag while maintaining the probabilities of high frequency tags as first-tag. Figure 2 recalls the shape of the sigmoid function for different values of k.
Fig. 2: Shape of function (1+e1−k∗z) for different values of k
For example, if the first-tag frequency map for css is {html:10, jquery:2}, then, when normalizing first-tag html, record f req = 10, sum(record f req) = 12, p(html) = 5, 552. As a result, p(html|css) = 0.8301. Similarly, for each tag, we provide a list of enriching first-tags with estimated probabilities.
The second step of our approach consists in choosing a first-tag to enrich each question. Given a question’s tag list, we fetch the top 5 first-tags (with the highest probabilities). Then we accumulate the corresponding probabilities with a discount taking into account the position of the tag in the tag list associated to the question, as shown in equation 3.
pj= p1,j+ p2,j∗ dis + ... + pk,j∗ disk−1f orj ∈ [1, V ], k ∈ [1, K] (3)
where pj denotes the probability of the first-tag for a given
question, pk,j denotes the probability for tag k to have the tag
j as its first-tag, V denotes the number of all the first-tags, K denotes the number of tags in the given question and dis denotes the discount due to the position.
Then we consider the first-tag with the highest probability as the enriching first-tag. If this first-tag already exists in the original tag list, we simply skip the insertion, or else we insert it at the first position of the question’s tag list. We processed 242, 552 tag lists from the StackOverFlow Q&A site, and our method enriched 33, 622 of them (13.5%). Table II presents the results of the enrichment of 8 tag lists (enriched tags are in bold).
C. Topic Extraction
From the observation of our dataset, we confirmed the natural intuition that high frequency tags are more generic and low frequency tags are more specific, and most of the low frequency tags are related to a more generic tag. Similar observation was also found in [17]. Besides, [18] shows that tag frequency in Q&A sites also satisfies power law
TABLE II: Original and enriched tag lists
ant java, ant qt, boost c++, qt, boost django, hosting python, django, hosting xslt, dynamic, xsl xml, xslt, dynamic, xsl sql-server-2005, sorting sql, sql-server-2005, sorting tomcat, grails, connection java, tomcat, grails, connection
cocoa, osx, mac, plugins objective-c, cocoa, osx, mac, plugins spring, j2ee, module, count java, spring, j2ee, module, count
distribution [19]. For example, for a question tagged with {c++, iostream, fstream} (with tags sorted according to their frequencies), we could find that it was related to c++ and to the iostream topic of c++, and more specifically, that it focused on fstream. This inspired us to build a tag tree to represent it and compute the probability for a tag to be related to a topic. Figure 3 illustrates the process of building a tag tree. Figure 4 illustrates an example of html’s tree. Our topic extraction
Fig. 3: Example of a tag tree
method is described in Algorithm 1. In the build trees process input : enriched tag list of questions,topic number K output: topic-tag distribution
1 /*build trees process, shown in Fig 3*/ 2 trees = null /* initialize */
3 foreach question’s taglist do 4 trees.insert(taglist) 5 end
6 /*build affinity matrix for root tags*/
7 root tags = trees.get root tags()
8 affinities matrix = build affinity(root tags) 9 /*run spectral-clustering on affinity matrix*/ 10 groups = spectral clustering(affinities matrix,K) 11 /*combine tree according to groups*/
12 new trees = combine tree(trees,groups) 13 /*compute topic-tag distribution*/
14 topic distributions = compute distribution(new trees)
Algorithm 1: Topic extraction
(lines 1-5), we build a tag tree according to the position of tags in a question, and record the occurrence of each node. For example, let us consider again the tag lists of question Q1, Q2, Q3 in Figure 1. Based on them, we construct two trees. The root of the first tree is html, the occurrence of this node is 2, it has only one child css, which has 2 occurrences, and this node has two children, layout and height, and each one occurs 1 time. The root of the second tree is c# with 1 occurrence. By processing all the tag lists, many trees are generated. We then construct an affinity matrix of the root nodes (lines 6-8). Since we applied first-tag enrichment, the number of root tags
is not very large. The similarity of two root nodes is computed according to equation 4,
Simi(root i, root j) = I(root i, root j)
(I(root i) + I(root j)) (4)
where I(root i, root j) denotes the co-occurrence of the two root tags, and I(root i) and I(root j) denote the occurrence of tag root i and tag root j respectively. Then we perform a spectral clustering [20] on the affinity matrix to group these root nodes (line 9-10). Each group form what we will call a topic. As spectral clustering requires to select the desired number of topics, we choose the same number 30 as [10], which has proved to be a reasonable setting for the Stackoverflow dataset. We then combine trees if their root nodes belong to the same topic (lines 11-12). This process leads to a forest where each tree represents a topic. Then, in the compute topic-tag distribution process (lines 13-14), for each topic tree, we compute p(tag|topic) by using MLE (the most likelihood estimation), according to equation 5:
p(tag|topic) = p(tag, topic) p(topic) =
I(tag) + 1
I(sum(tag) + N ) (5)
where I(tag) denotes the number of occurrences of tag in the topic tree, and I(sum(tag)) denotes the total number of occur-rences of all tag occuroccur-rences in the topic tree. Compared with
Fig. 4: html’s tag tree
LDA-based model, our model could have zero-probabilities problem, which means that there exists some less popular or new tags that are related to certain topics with 0 probability due to no evidence of co-occurrence. For example, if tag zombie-processnever occurs in a html-related tag tree, then the probability of tag zombie-process to be related to html-related topics is 0, which could lead to some problems when dealing with young datasets. It is quite easy to fix it just by using Laplace smoothing, as shown in equation 5. Table III shows the top tags and their probabilities detected by out method.
We used the spectral clustering implementation of scikit-learn toolkit2. We only run it on the root nodes, which have quite a small size (around 1175 nodes with the tag enrichment process), which means we only need to build affinity matrix on these root nodes and the overall cost is acceptable. D. User Interest Detection
In StackOverflow, users answering a question can be con-sidered as interested in the tags of the question. As a result, a starting point for user interest detection is to model the initial situation as follows: a user answering a question acquires the tags attached to this question and gradually, each user acquires a list of tags. So we represent a user by a tag list: U = {Ui|i = 1, ..., n}, Ui = {tagi|i = m, n, ..., k}, and
our goal is, for each user Ui, to find Ii = {Ii1, Ii2...Iik}
where Iik denotes the probability of user Ui to be related to
topick. As we already have a topic-tag distribution we simply
compute user-topic distribution according to equation 6 where Pt,kdenotes the probability of tag t to be related to topic k. We
then normalize the probabilities between 0 and 1 by dividing the global max value. We use the log function for numerical stability. Here we do not apply normalization at the level of the user, because like [14], we believe that each user could have a high interest in two or more topics simultaneously, while most of the probabilistic graphical models including LDA and PLSA require the sum of all the probabilities is 1, which means that a user cannot have high probabilities to many topics simultaneously. Our method does not have this limitation. Then we identify users’ communities of interests based on the user-topic distribution: a user having a high probability for a user-topic should be a member of the community of the topic.
Ii,k= log (v X t=1 Pt,k+ 1 ) (6)
IV. EXPERIMENTS ANDEVALUATION ON
STACKOVERFLOW DATA
We conducted experiments on the dataset of the activity on the popular Q&A site StackOverflow between 2008 and 2009, which is available 3, to evaluate the performance of
our approach compared to three other community detection algorithms. The total number of users is 103K. Among them, 47K users submitted at least one question, and 54K users answered at least one question. The total number of tags attached to questions is 24K, and 20% of them are used more than 10 times. The frequency of tags follows a power law distribution. The total number of posts is 1.1M; among them there are 242K questioners and 870K answers.
A. Performance of Topic Extraction
We use the Perplexity [5] metric to measure the topic extraction performance. It is a common metric in the topic modeling area, measuring how well the words in test docu-ments are represented by the word distribution of extracted topics. The intuition is that a better model will tend to assign higher probabilities to the test dataset, corresponding to a lower perplexity value. We split the dataset (question tag lists), 80%
2Scikit-learn toolkit:
http://scikit-learn.org/stable/modules/clustering.html#spectral-clustering
3https://archive.org/details/stackexchange
as training set, 20% as testing set. We run LDA and our method on the training set to get the topic distribution. Then for a test set of M questions’ tag lists (Nd denotes the number of tags
in dthquestion) the Perplexity score is computed as shown in equation 7:
P erplexity(Dtest) = exp
( − PM d=1log p(tag) PM d=1Nd ) (7)
In our model, p(tag) is computed by p(topic|question) ∗
Fig. 5: Topic extraction performance comparison
p(tag|topic). In order to obtain p(topic|question) distribution, we just compute it similarly to user interest detection (see Section III-D), by replacing user tag lists by question tag lists. The only difference is that we normalize the question topic distribution to make sure that the sum of a question’s topic distribution is 1. We show and compare the average perplexity score in Figure 5. empirical represents our method, empirical noEnrich represents our method without first-tag enrichment. We find that our method could outperform the state-of-the-art topic model LDA. The reason is, compared with traditional document topic modeling use cases, question tag lists in Q&A sites are very short, and LDA performs poorly in this situation. Besides, our first-tag enrichment method can improve the performance when the topic number is not very large. Another point is that, benefiting from a tree structure for topics, we can easily extract sub-topic from a given topic. Besides, our community detection method is based on a topic model, so extracting these topics can help us find sub-communities within a detected community. Table IV shows the top tags of java’s sub-topic html and of topic html. We can find that the differences are noticeable for topics: a user who is interested in topic html is not necessarily interested in java’s sub-topic html and vice versa.
B. Performance of User Interest Detection
Traditional community detection algorithms are based on the network structure. As there is no explicit network in our dataset and in order to compare our work with other approaches on the same dataset, we extracted a network of interactions between users: a co-answer network inspired by the notion of co-view network introduced in [9]. The idea behind is that if two users answer the same question they
TABLE III: Top tags and their probabilities for some topics computed by our method
topic4 topic5 topic6
iphone 0.203 git 0.198 sql 0.177
objective-c 0.112 svn 0.096 mysql 0.122
ios 0.109 version-control 0.045 sql-server 0.074
xcode 0.042 github 0.033 database 0.040
cocoa-touch 0.021 tfs 0.033 oracle 0.030
ipad 0.020 maven 0.029 sql-server-2008 0.029
cocoa 0.018 tortoisesvn 0.018 tsql 0.026
uitableview 0.012 msbuild 0.016 query 0.025
ios5 0.010 jenkins 0.015 sql-server-2005 0.019
core-data 0.009 tfs2010 0.014 database-design 0.011
topic12 topic13 topic14
html 0.214 javascript 0.264 machine-learning 0.247
css 0.201 jquery 0.114 artificial-intelligence 0.130
xhtml 0.017 html 0.035 neural-network 0.062
web-development 0.016 ajax 0.031 classification 0.046
ie 0.012 css 0.016 data-mining 0.037
css-layout 0.010 firefox 0.013 svm 0.031
div 0.010 dom 0.011 weka 0.025
layout 0.010 php 0.011 libsvm 0.015
firefox 0.009 ie 0.010 nlp 0.024
ie6 0.009 web-development 0.008 bayesian 0.011
TABLE IV: top tags for java’s sub-topic html and mysql, denoted by java html, and java mysql respectively, compared with topics html and mysql
java html jsp swing xml parsing jsf jeditorpane pdf applet dom html css xhtml web-development table div ie layout css-layout firefox
java mysql jdbc hibernate database tomcat prepared-statement spring connection-pooling connection security
mysql database query mysql-query ruby-on-rails database-design performance stored-procedures innodb optimization
share some of their interests. So, the co-answer network, to some extent, can reflect the common interests between users. We filtered the co-answer links with a rule stating that a link is kept if two users answer the same questions more than 10 times (we varied this parameter by 15, 20, 25, the results are similar, so here we report results with 10). Based on the noise-less dataset obtained, we implemented three well known community detection methods in order to compare our approach with them. In order to evaluate the results of overlapping community detection, for each user, a method should output 1 ∼ 3 community labels with corresponding probabilities to indicate to what extent the user is interested in the community. Then we define three levels of interests: High, Medium, Low according to the probabilities. In addition, we set the community number to 30 for all these methods empirically. • SLPA [6]: An overlapping community detection method inspired by a classical Label propagation al-gorithm (LPA). SLPA alal-gorithm can evaluate to which extent a user belongs to a community by the received propagated label (a ’Post-process’ in SLPA algorithm). So, it can output more than one community label according to these frequencies.
• LDA: Similar to [18], we run LDA to build a user-topic-tag model on the given dataset, users are repre-sented by their tag list. As the output contains a user-topic distribution, we just sort the distribution for each user and choose the top 3 topic labels as community label together with their probabilities.
• Clustering: We used the implementation of hierarchi-cal clustering from scikit-learn toolkit4. As clustering
4http://scikit-learn.org/stable/modules/clustering.html#
hierarchical-clustering
algorithms are hard-partitioned, it can only generate one group label for each user.
• Empirical: it is our method. We just sort the results of user interest detection (section III-D) and choose the top 3 as community label together with their probabilities.
Our aim was to evaluate the similarity between users within a detected community of interest. We mainly used the jaccard similarity and cosine similarity of two user’s tag lists to evaluate the similarity of two user’s interests. We used a modified modularity metric to compute the difference between the average similarity between the users within a community (avg inner) and the average similarity between the users in a community and some user randomly chosen from the whole dataset (avg rand). This is captured in Equation 8, where N represents the number of users in a community C, and Simi denotes the similarity function. Rand U represents users that are randomly chosen from the whole data set. A higher value of avg inner denotes that users within a community are very similar. A lower value of avg rand denotes that users of a community are not very similar to random users. So a higher value of modularity means a larger difference between avg inner and avg rand, which is considered as a better partition of communities. As the metric has random variables, we run the experiments 10 times and each time we used different random users. Besides, we created a center user in each community by averaging all users’ tag lists and frequencies, then we computed the average similarity between each user in a community and this center user as avg center. As introduced before, each method gives 1 ∼ 3 community labels for each user to indicate the level of interest. So we evaluated each level of interest respectively.
M odularity(C) = Avg inner( PN i=1 PN j=1Simi(U i, U j)) Avg rand(PN i=1 P50 j=1Simi(U i, RandU j)) (8)
Experiment results are shown in Table V. We run each method on the co-answer dataset for 10 times, and listed the average value. We found that our method is better than the three other methods in detecting High level communities of interests with both metrics. The reason why our method is not very good on Low level interest is that it allows users to belong to more than one community with high probabilities. This puts some irrelevant users in Low level communities of interests which decreases the similarity between users. Table VI shows some users and their interests detected with our method and their top 10 tags. The first row contains user ids, the second row contains their detected communities of interests with their probabilities. The following ten rows show the top 10 tags for each user. We replaced community labels by names assigned according to the tags in each topic interest.
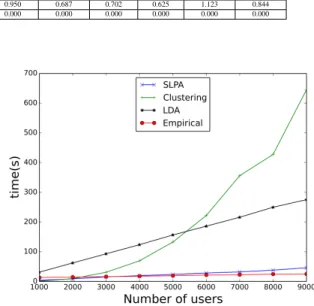
C. Scalability
We also evaluated the scalability of each method. How-ever, as these methods are written in different programming languages, it is not fair to consider this as a precise evaluation, but more as an indication. To increase the stability of the comparison, we run experiments 10 times, and only listed the average values. We used a Java implementation of LDA algorithm. All the other methods were implemented in Python. For our method, the time of topic detection was also counted
TABLE V: Performances of the compared user interest detection methods
Similarity Jaccard Similarity
Level High Interest Medium Interest Low Interest
Metric avg inner avg rand modularity avg center avg inner avg rand modularity avg center avg inner avg rand modularity avg center
Empirical 0.162 0.033 4.909 0.218 0.135 0.039 3.462 0.171 0.107 0.042 2.548 0.131
LDA 0.147 0.035 4.200 0.178 0.131 0.039 3.359 0.177 0.144 0.041 3.512 0.193
SLPA 0.131 0.040 3.275 0.166 0.129 0.040 3.225 0.159 0.121 0.039 3.103 0.155
Clustering 0.130 0.041 3.171 0.161 0.000 0.000 0.000 0.000 0.000 0.000 0.000 0.000
Similarity Cosine Similarity
Level High Interest Medium Interest Low Interest
Metric avg inner avg rand modularity avg center avg inner avg rand modularity avg center avg inner avg rand modularity avg center
Empirical 0.736 0.574 1.282 0.857 0.573 0.602 0.952 0.761 0.475 0.629 0.755 0.695
LDA 0.836 0.660 1.267 0.917 0.900 0.612 1.471 0.948 0.757 0.600 1.262 0.865
SLPA 0.749 0.624 1.200 0.854 0.590 0.621 0.950 0.687 0.702 0.625 1.123 0.844
Clustering 0.763 0.622 1.226 0.875 0.000 0.000 0.000 0.000 0.000 0.000 0.000 0.000
TABLE VI: Examples of user interests detected with our empirical method
user 10224 user 103043 user 113570
database (0.805) c#-dev (0.081) java-dev (0.664) database (0.105) c#-dev (0.393) web-dev (0.328) sql-server (21) java (135) c# (107) sql (21) swing (28) jquery (89) tsql (6) oracle (27) javascript (56) performance (4) sql (23) .net (47)
database (4) subjective (15) asp.net (27) stored-procedures (3) windows (13) css (23) sql-server-2005 (3) eclipse (12) regex (20)
.net (3) best-practices (12) html (20)
mysql (2) plsql (10) iphone (12)
sql-server-2000 (2) regex (10) string (10)
user 24181 user 34509 user 30461
web-dev (0.743), database (0.072) c-dev (0.663), linux-dev (0.083) ios-dev (0.885), linux-dev (0.020) php (304) c++ (703) cocoa (333) javascript (193) c (187) objective-c (184)
mysql (116) templates (62) iphone (47)
html (86) stl (53) cocoa-touch (39)
css (57) linux (48) osx (35)
regex (40) subjective (45) mac (34)
jquery (37) pointers (44) iphone-sdk (20)
sql (27) java (42) xcode (18)
ajax (26) bash (40) cocoa-bindings (18)
apache (23) boost (31) core-graphics (18)
in. For LDA and SLPA, we set the iteration number at 100. We run the experiments on a computer with 3GHz Intel i7 CPU and 8GB RAM. From the experiment, we could find that LDA, SLPA and our method are linear in terms of the number of users. Although LDA algorithm is theoretically O(nm) in each iteration, with n representing the number of users, and m representing the number of tags for each user, when we test it on large datasets, it clearly appears that only n actually has an impact. m changes very little, so it could be regarded as linear. Besides, [21] proved that LDA model requires a few hundreds of iterations to obtain stable topic distribution. Our model does not have this limitation.
D. Discussion
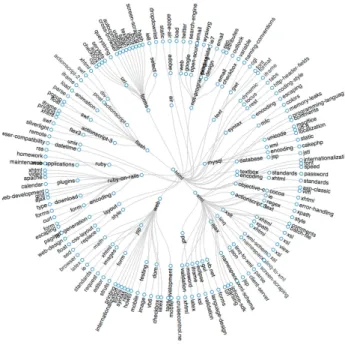
To sum up, most community detection algorithms work well on real-life social networks which contain many triangle-shape structures. The interactions between the users in these networks are mainly based on their relationships. It is also noticeable that the relationships which a user in such net-work can maintain are limited and most likely restricted by the location (co-author networks in academia is also in this situation), so the overall structure of the network is flatter, scattered and with many triangle-shape structures. Compar-atively, in Q&A sites, such as StackOverflow, there are no fixed relationships between users. Users interact with each other based on their own interests. And they are not aware of whom they are interacting with, so they will not maintain explicit relationships. Besides, a user can interact with any other user and mainly interacts with the ”gurus” (most of
Fig. 6: Scalability of the compared user interest detection methods
questions are answered by a small group of people). So the overall structure of the network is octopus-shape [22] with less triangle-shape structures. According to [23], the average number of triangle-shape structures per user in twitter dataset is around 35714, while in our co-answer dataset, the number of triangle-shape structure per user is around 30 which is far less. So, graph-based community detection methods fail in such situation. The result of SLPA algorithm shows that it outputs one or two giant groups, together with many tiny groups that only contain a small number of users as depicted in Figure 7, where each color represents a detected community. We can also see that the network contains less triangle-shape structures and a high-density core. It also indicates that the network has huge overlaps. Since clustering methods normally generate hard-partitions communities, they cannot detect the overlapping communities which are typical in our case. Concerning the LDA-based methods, on one hand, in our dataset, question tag lists are quite short, and the experiment shows that our topic extraction method gives better results in this situation. On the other hand, the probabilistic graphical model requires hundreds of iterations to get stable results [21] which is more complicated and slower than our method. We also conducted similar experiments on a Flickr dataset in order to show our method is not specific to StackOverflow. Recalling our research questions (Can we detect communities of interests in Q&A sites? Can we also identify the topics that attract them?) we believe we propose a topic detection method which is very suitable for Q&A datasets and an efficient user
Fig. 7: Illustration of co-answer-network
interest detection method to discover overlapping communities of interests.
V. CONCLUSION
In this paper, we addressed the problem of detecting overlapping communities of interests in Q&A sites. By study-ing the Stackoverflow dataset and the LDA algorithm, we proposed TTD (Topic Trees Distributions) a tag tree based topic extraction model. We then exploited the extracted topic information to detect overlapping communities of interests. We conducted experiments on a dataset from the popular Q&A site StackOverflow to compare different approaches. The results indicate that for this kind of web communities our method can be a good replacement for more complicated methods in detecting overlapping communities of interests. There are also limitations in our work, in particular our model requires each question to have several tags to the question. There are many potential future directions for this work. An interesting one is to track the evolution of communities of interests and the evolution of users’ interests.
ACKNOWLEDGMENT
The authors would like to thank StackOverflow for sharing their data. We also sincerely thank volunteers for helping us label the dataset for evaluation. We thank the ANR-12-CORD-0026 ocktopus project grant for the support of this research. We also appreciate very helpful advices from anonymous reviewers.
REFERENCES
[1] A. Anderson, D. P. Huttenlocher, J. M. Kleinberg, and J. Leskovec, “Discovering value from community activity on focused question an-swering sites: a case study of stack overflow,” in KDD, 2012, pp. 850– 858.
[2] B. Li and I. King, “Routing questions to appropriate answerers in com-munity question answering services,” in Proceedings of the 19th ACM international conference on Information and knowledge management. ACM, 2010, pp. 1585–1588.
[3] T. C. Zhou, M. R. Lyu, and I. King, “A classification-based approach to question routing in community question answering,” in Proceedings of the 21st International Conference Companion on World Wide Web, ser. WWW ’12 Companion. New York, NY, USA: ACM, 2012, pp. 783–790.
[4] D. Li, B. He, Y. Ding, J. Tang, C. Sugimoto, Z. Qin, E. Yan, J. Li, and T. Dong, “Community-based topic modeling for social tagging,” in Proc. of the 19th ACM CIKM, ser. CIKM ’10. New York, NY, USA: ACM, 2010, pp. 1565–1568.
[5] D. M. Blei, A. Y. Ng, and M. I. Jordan, “Latent dirichlet allocation,” the Journal of machine Learning research, vol. 3, pp. 993–1022, 2003. [6] J. Xie, S. Kelley, and B. K. Szymanski, “Overlapping community detection in networks: The state-of-the-art and comparative study,” ACM Comput. Surv., vol. 45, no. 4, p. 43, 2013.
[7] Y.-Y. Ahn, J. P. Bagrow, and S. Lehmann, “Link communities reveal multiscale complexity in networks,” Nature, vol. 466, no. 7307, pp. 761–764, 2010.
[8] Z. Xu, Y. Ke, Y. Wang, H. Cheng, and J. Cheng, “A model-based approach to attributed graph clustering,” in SIGMOD Conference, 2012, pp. 505–516.
[9] U. Gargi, W. Lu, V. S. Mirrokni, and S. Yoon, “Large-scale community detection on youtube for topic discovery and exploration,” in ICWSM, 2011.
[10] S. Chang and A. Pal, “Routing questions for collaborative answering in community question answering,” in Proceedings of the 2013 IEEE/ACM ASONAM. New York, NY, USA: ACM, 2013, pp. 494–501. [11] H. Zhang, B. Qiu, C. L. Giles, H. C. Foley, and J. Yen, “An
lda-based community structure discovery approach for large-scale social networks,” in ISI, 2007, pp. 200–207.
[12] X. Sun and H. Lin, “Topical community detection from mining user tagging behavior and interest.” JASIST, vol. 64, no. 2, pp. 321–333, 2013.
[13] J. Tang, J. Zhang, L. Yao, J. Li, L. Zhang, and Z. Su, “Arnetminer: extraction and mining of academic social networks,” in Proceedings of the 14th ACM SIGKDD international conference on Knowledge discovery and data mining. ACM, 2008, pp. 990–998.
[14] J. Yang, J. McAuley, and J. Leskovec, “Community detection in networks with node attributes,” in Data Mining (ICDM), 2013 IEEE 13th International Conference on. IEEE, 2013, pp. 1151–1156. [15] A. McDaid and N. Hurley, “Detecting highly overlapping communities
with model-based overlapping seed expansion,” in Advances in Social Networks Analysis and Mining (ASONAM), 2010 International Confer-ence on. IEEE, 2010, pp. 112–119.
[16] A. Lancichinetti, F. Radicchi, J. J. Ramasco, and S. Fortunato, “Finding statistically significant communities in networks,” PloS one, vol. 6, no. 4, p. e18961, 2011.
[17] P. Mika, “Ontologies are us: A unified model of social networks and semantics,” Web Semantics: Science, Services and Agents on the World Wide Web, vol. 5, no. 1, pp. 5–15, 2007.
[18] L. Yang, M. Qiu, S. Gottipati, F. Zhu, J. Jiang, H. Sun, and Z. Chen, “Cqarank: jointly model topics and expertise in community question answering,” in Proceedings of the 22nd ACM international conference on Conference on information & knowledge management. ACM, 2013, pp. 99–108.
[19] L. A. Adamic and B. A. Huberman, “Power-law distribution of the world wide web,” Science, vol. 287, no. 5461, pp. 2115–2115, 2000. [20] A. Y. Ng, M. I. Jordan, and Y. Weiss, “On spectral clustering:
Anal-ysis and an algorithm,” in ADVANCES IN NEURAL INFORMATION PROCESSING SYSTEMS. MIT Press, 2001, pp. 849–856.
[21] T. L. Griffiths and M. Steyvers, “Finding scientific topics,” Proceedings of the National academy of Sciences of the United States of America, vol. 101, no. Suppl 1, pp. 5228–5235, 2004.
[22] J. Leskovec, K. J. Lang, A. Dasgupta, and M. W. Mahoney, “Statistical properties of community structure in large social and information networks,” in Proceedings of the 17th international conference on World Wide Web. ACM, 2008, pp. 695–704.
[23] H.-M. Park and C.-W. Chung, “An efficient mapreduce algorithm for counting triangles in a very large graph,” in Proceedings of the 22nd ACM CIKM13. ACM, 2013, pp. 539–548.