HAL Id: hal-00781733
https://hal.inria.fr/hal-00781733
Submitted on 28 Jan 2013
HAL is a multi-disciplinary open access
archive for the deposit and dissemination of
sci-entific research documents, whether they are
pub-lished or not. The documents may come from
teaching and research institutions in France or
abroad, or from public or private research centers.
L’archive ouverte pluridisciplinaire HAL, est
destinée au dépôt et à la diffusion de documents
scientifiques de niveau recherche, publiés ou non,
émanant des établissements d’enseignement et de
recherche français ou étrangers, des laboratoires
publics ou privés.
Building reconstruction from a single DEM
Florent Lafarge, Xavier Descombes, Josiane Zerubia, Marc Pierrot-Deseilligny
To cite this version:
Florent Lafarge, Xavier Descombes, Josiane Zerubia, Marc Pierrot-Deseilligny. Building
reconstruc-tion from a single DEM. Computer Vision and Pattern Recognireconstruc-tion (CVPR), Jun 2008, Anchorage,
United States. �hal-00781733�
Building reconstruction from a single DEM
Florent Lafarge
1,2, Xavier Descombes
1, Josiane Zerubia
1and Marc Pierrot-Deseilligny
2 1Ariana Research Group - INRIA
2French Mapping Agency (IGN)
Sophia-Antipolis, France
Saint-Mand´e, France
Firstname.Name@inria.fr Firstname.Name@ign.fr
Abstract
We present a new approach for building reconstruction from a single Digital Elevation Model (DEM). It treats buildings as an assemblage of simple urban structures ex-tracted from a library of 3D parametric blocks (like a LEGO°Rset). This method works on various data
resolu-tions such as 0.7 m satellite and 0.1 m aerial DEMs and allows us to obtain 3D representations with various levels of detail. First, the 2D supports of the urban structures are extracted either interactively or automatically. Then, 3D blocks are placed on the 2D supports using a Gibbs model. A Bayesian decision finds the optimal configuration of 3D blocks using a RJMCMC sampler. Experimental results on complex buildings and dense urban areas are presented us-ing data at various resolutions1.
1. Introduction
Three dimensional models of urban areas are very useful for many applications such as urban planning, radiowave reachability tests for wireless communications, disaster re-covery or computer games.
Problem statement Many automatic methods have been proposed. It is difficult to compare these methods efficiently since they have been developed in different contexts (kinds of data, types of reconstructed buildings, level of user inter-activity, etc) and use different evaluation criteria. Multiple view images are the most common inputs. Scholze et al. ex-tracted 3D-lines and grouped them into faces which allow the building reconstruction through a semantic interpreta-tion [12]. Rooftop hypotheses were generated from 3D-lines and junction information by Kim et al.[5]. Baillard
et al. present a method based on planar facet hypothesis
1The first author thanks the French Mapping Agency (IGN) and the
French Space Agency (CNES) for partial financial support during his PhD. The authors thank the CNES for providing satellite images.
which can be generated from single 3D-lines [1]. Mueller
et al. developed a procedural model based on a shape
gram-mar [9]. One of the most efficient methods uses a hierar-chical approach which combines three different levels of detail [8]. Laser scans are also popular inputs due to the measurement accuracy. Fruech et al.[3] uses laser scans to model buildings with a detailed reconstruction of the fa-cades. These methods provide convincing 3D-models using aerial images, ground views or laser scans. However, most of them have been developed using a specific kind of data and cannot easily be adapted if the image characteristics change (resolution, SNR, etc). We propose a new method adapted to varying data resolution.
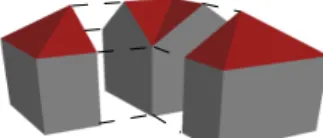
Global strategy There are two main families of ap-proaches in 3D building reconstruction. Generic represen-tations are theoretically able to reconstruct any shape of building through connected planar facets, but they demand high resolution data. Parametric representations are known to be robust with respect to data quality [14], but these re-constructions are limited - most parametric representations consider a symmetric two-plan roof reconstruction. In this paper, we use an approach which is halfway between generic and parametric representations : the structural ap-proach. It consists in reconstructing buildings by assem-bling simple urban structures extracted from a library of 3D parametric blocks, as a LEGO°Rgame (see Figure1). This
Figure 1. Principle of the structural approach.
approach is particularly interesting since it combines the ad-vantages of generic and parametric representations: 1- the robustness of parametric approaches is preserved since the library objects are defined by parameter sets,
2- an efficient library permits modeling a large range of buildings. It is even possible to reconstruct buildings such as curved roof structures that some generic models cannot construct,
3- assembly of urban structures is particularly adapted to multiresolution data and allows us to obtain both basic roof shapes from 70 cm resolution satellite images or details including superstructures (chimneys, dormer-windows,etc) from 10 cm resolution aerial images.
This approach is based on important prior knowledge con-cerning urban structures and their assembly. It is neces-sary to define the interactions between blocks correctly to have a convincing modeling without artefacts. A stochas-tic framework is especially well adapted to introduce such knowledge. Lafarge et al. proposed a similar approach [7]. However, that work was limited and suffered from many drawbacks: 1-generation of many artefacts, 2-lack of 3D-modeling generality, 3-tuning of many parameters, 4-long computation times and 5-restriction to satellite data. The input was a single Digital Elevation Model (DEM) which is well adapted to global geometric descriptions. First, the 2D-supports of the urban structures were extracted either interactively or automatically using Ortner et al.’s method [10]. Then, 3D blocks are positioned on the 2D supports using a Gibbs model in Section3. A Bayesian de-cision finds the optimal configuration of 3D blocks using a RJMCMC sampler. Experimental results on complex build-ings and dense urban areas are shown using data at various resolutions in Section4.
2. Building extraction
The first step extracts the 2D-supports of the urban struc-tures from a DEM. Each 2D-support is represented by an unspecified quadrilateral (or triangle) and is associated with a specific part of a building. The 2D-supports of a build-ing correspond to a set of connected quadrilaterals (i.e. non-overlapping quadrilaterals with common edges). We propose two different ways for the user to extract the 2D-supports: an interactive one and an automatic one.
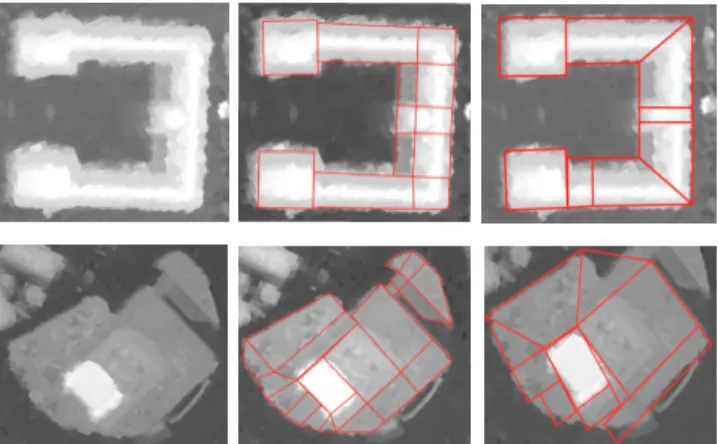
Interactive extraction An operator controls interactive extraction: four clicks add a 2D-support (these clicks are the four points of the quadrilateral). This method allows ac-curate extraction as we can see on Figure2, but takes con-siderable operator time.
Automatic extraction The second method is automatic: Ortner et al. obtain 2D-supports using an object approach based on marked point processes [10]. This method gener-ates a set of rectangles which provide a rough description of the 2D-supports. Then, the rectangles are transformed into connected quadrilaterals by fusing neighboring
rectan-gles. This process is automatic but the supports are not as accurate as those from interactive extraction - see Figure2.
Figure 2. Extraction of 2D-supports: DEMs (left), interactive (cen-ter)and automatic extraction (right).
3. 3D reconstruction
Once the 2D-supports have been extracted, the buildings are automatically reconstructed through a density formula-tion. The first step specifies the 3D objects.
3.1. Library of 3D-blocks
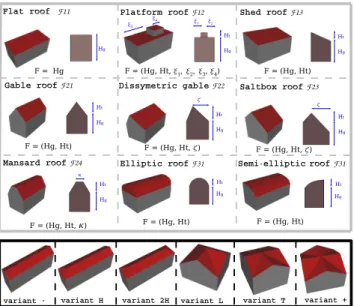
The content of the library is a key point: if it is too limited (e.g. Lafarge et al.[7] had only flat and gable roof forms), the method loses generality. The proposed library, denoted byM and presented in Figure3, allows us to re-construct a large range of buildings through a collection of blocks. Each block possesses both a roof form and a variant:
• The proposed roof forms (denoted by F and illustrated
in Figure 3(top)) include monoplane (F1x), multi-plane (F2x) and curved roofs (F3x). Each roof form has a specific set of parametersF (the number of
pa-rameters varies between1 and 6).
• The variants (denoted by V and shown in Figure 3(bottom) for a gable roof type) are specific to a roof
form. They correspond to types of structure ends (hipped or straight ends) or structure junctions (”-”,”L”,”T” or ”+” junctions). The variants also specify the orientation of the roof with respect to the quadri-lateral 2D-support. There are1 to 3 parameters in the
set of the variant, denoted byV .
To sum-up, each block of the library M is defined by a
tuple(F, V) and an associated parameter set θ = (F, V ).
Some blocks can topologically be degenerated in some sit-uations2: these cases are not allowed in the process in prac-tice. Details concerning this library are available in [6].
Figure 3. Library of 3D-blocks - the roof forms (3D and profile views) (top) and the variants of a gable roof (bottom)
3.2. Bayesian formulation
The notation for the Bayesian formulation is:
• S, a set of sites and Λ = {Λ(s)/s ∈ S}, a given DEM
whereΛ(s) represents the intensity of the site, s.
• C, the quadrilateral configuration representing the
build-ing 2D-supports associated with Λ. N is the number of
quadrilaterals (see Figure2).
• Si, the subset ofS whose sites are inside the quadrilateral,
i ∈ C.
• D = {Λ(s)/s ∈ Si, i ∈ C}, the set of data.
• x, an element of the state space, T , which corresponds
to a configuration of 3D-parametric blocks knowing the 2D-supports C. x = (xi)i∈C = (mi, θi)i∈C where each block,xi, is specified by both a model,miof the libraryM and an associated set of parameters, θi. In the following,
xi = (mi, θi) and mi will be referred to as an object (or block) and a model, respectively.
• Sxi, the function fromSi toR which associates the roof
altitude of the object,xi, to each site ofSi.
We consider the random variable,X, distributed in T ,
which follows an unnormalized density,h. h is the
poste-rior density of a configuration,x, of objects, given D. In a
Bayesian framework, this density can be obtained from:
h(x) = h(x/D) ∝ hp(x)L(D/x) (1)
We must be able to build both a prior density,hp(x), and a likelihood,L(D/x).
3.2.1 Likelihood
The likelihood represents the probability of observing the data,D, knowing the configuration, x. By considering the
hypothesis of conditional independence, it can be expressed in terms the local likelihood of objects,L(Di/xi):
L(D/x) =Y i∈C L(Di/xi) ∝ Y i∈C exp −Γα (i)(Sxi, Di) (2) whereΓα
(i)(., .) is the distance from R
card(Si)× Rcard(Si) toR defined by : Γα(i)(Sxi, Di) = Ã X s∈Si |Sxi(s) − Λ(s)| α !1 α (3)
To sum-up, the likelihood corresponds to the Z-error of the
Lα norm between the DEM and the objects. In practice,
α = 3
2 is a good compromise between sensitivity and ro-bustness to DEM errors.
3.2.2 Prior
The prior density introduces interactions between neighbor-ing objects. It allows us to both assemble objects in order to propose a realistic building and compensate for the lack of information contained in the DEM. A neighborhood rela-tionship onC must be set up to define the interactions: two
distinct quadrilaterals,i and j ∈ C, are said to be neighbors
if they have a common edge. The neighborhood relation-ship, denoted by⊲⊳ (i ⊲⊳ j represents the set of neighboring
pairs inC). In previous work, too many interactions were
set up [7]. The number must be minimal to preserve robust-ness and avoid problems in parameter setting. We propose a simple and efficient prior which is defined through a single interaction.
To do so, we define an assembly law which tests whether two objects can be assembled together. Two objectsxi =
(mi, θi) and xj= (mj, θj) are said ”joinable” (denoted by
xi∼axj), if: 1 -Fi= Fjand
2 - roof top orientations are compatible and
3 - the common edge of the quadrilateral 2D-supports,i
andj, is not a roof height discontinuity.
The first condition checks that the two blocks have the same roof form. The second and third conditions test whether the roof tops of the two objects can be connected.
The prior favors ”joinable” objects, i.e. homogeneous struc-tures, which means that heterogeneous structures can also be reconstructed. Moreover, in order to avoid artefacts, the parameters of two ”joinable” objects are encouraged to
have similar values. To do so, the unnormalized density,
hp, is expressed through a Gibbs energy,Up(i.e. hp(x) =
exp −Up(x)), defined by:
∀x ∈ T , Up(x) = β
X
i⊲⊳j
1{xi∼axj}g(xi, xj) (4)
where 1{.} is the characteristic function. The parameter,
β ∈ R+, weights the importance of the prior density with respect to the likelihood. The density only depends on this parameter which is computed using the Maximum Likeli-hood estimator under regularization constraints detailed in [6]. The function,g, taking values in [−1, 0], measures the
distance between the parameters of two ”joinable” objects:
g(xi, xj) = D(xi, xj) Dmax − 1 = P kωk|eθi,(k)− eθj,(k)| Dmax − 1 (5) e
θi,(k) and eθj,(k) are thekth element of the parameter sets
FiandFj of the objectsxiandxj, respectively. Dmax =
max
xi,xj
D(xi, xj) is the maximum value of the distance. ωk are weights which are introduced in this distance in order to normalize the parameter values according to the metric system. These weights are computed from the X, Y and Z resolutions and the configuration of quadrilateralsC.
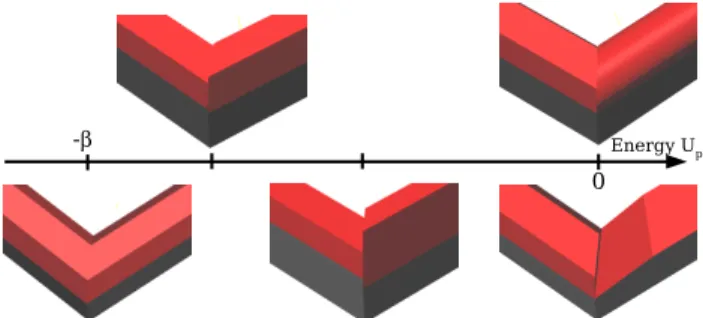
Figure4illustrates this interaction. If the two blocks belong to different roof types (for example a mansard roof and a semi-elliptic roof on the top right) or if the two objects do not have compatible roof orientations (bottom right), they will not be ”joinable” and the energy will be null. On the contrary, if the two objects are ”joinable”, the energy will be negative : these configurations are favored. The nearer the parameters of the two objects, the lower the energy. The left configuration is the best one.
Figure 4. Prior energy - local configurations of various energies.
3.3. Optimization
We now find the object configuration which maximizes the posterior density,h(.), i.e. the Maximum A Posteriori
(MAP) estimator,xM AP. This is a non convex optimization problem in a high and variable dimension space,T , since
the blocks in library,M, are defined by a different numbers
of parameters.
3.3.1 RJMCMC sampler
The Reversible Jump Markov Chain Monte Carlo (RJM-CMC) algorithm [4] is well adapted to our problem. Sev-eral papers have shown the efficiency of the RJMCMC sam-pler for the problem of multiple parametric object recog-nition. For example, Dick et al. use such a sampler to reconstruct architectural buildings from terrestrial images where the parametric object set includes structures such as columns, buttresses, entablatures or drainpipes [2]. The RJMCMC sampler simulates a discrete Markov Chain
(Xt)t∈NonT having π as an invariant measure (specified by the posterior density, h(.)) which makes small jumps
between spaces of variable dimension respecting the re-versibility assumption of the chain.
The jumps are proposed according to the three kernels spec-ified in the following and detailed in [6]:
• Kernel Q1: uniform jumps This is the classic kernel proposing a new state according to uniform distribu-tions. It is enough to ensure that the Markov chain can visit any configuration of the state space. However, using only this kernel requires long computation time [7]. Thus we propose two efficient additional kernels
Q2andQ3.
• Kernel Q2: data-driven jumps This kernel cleverly explores the state space using a data-driven process [13]. To do so, the state,x, is proposed knowing the
data, i.e. according to a probability, p(x|D). More
precisely, it firstly estimates the gutter roof height cHg and the roof top height cHtof the object concerned by the jump and, secondly, chooses its height values ac-cording to the Gaussian distributions, N ( cHg, σ) and
N (cHt, σ), respectively (in practice, σ = 1 m).
• Kernel Q3: regularization jumps In our applica-tion, the visual aspect of the result is very important: we need a kernel which proposes well-regularized ob-jects, i.e. objects which are perfectly aligned with their neighbors. The new object,xi, must be proposed knowing the neighboring objects{xj/j ⊲⊳ i}, i.e. ac-cording top(xi|{xj/j ⊲⊳ i}). The model is uniformly selected according to the models of the neighboring objects. The parameter values are chosen according to Gaussian mixtures depending on the parameter values of the neighboring objects.
In summary, the RJMCMC sampler is: at iteration t, if Xt= x:
1- Choose the kernelQi(x, .) with probability qi. 2- According toQi, propose a new statey.
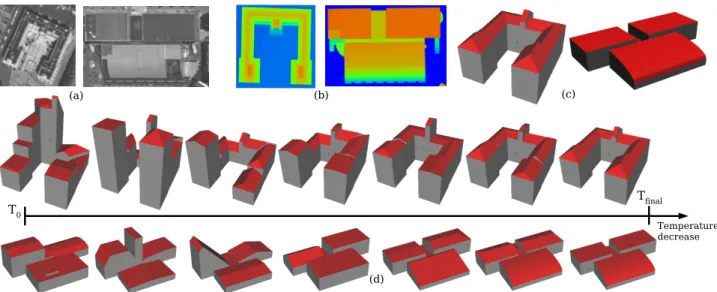
Figure 5. Two simple examples of the optimization process - evolution of the configuration as the temperature decreases (d), associated with the satellite images (a), the ground truths (b) and the final results (c).
3- Takex(t+1)= y with probability:
min µ π(dy) π(dx) Qi(y, dx) Qi(x, dy) , 1 ¶ (6)
and takex(t+1)= x otherwise.
3.3.2 Simulated annealing
Simulated annealing is used to ensure convergence: the den-sity,h(.), is substituted with h(.)Tt1, whereTtis a sequence
of temperatures which tends to zero ast tends to infinity.
Simulated annealing theoretically ensures convergence to the global optimum for any initial configuration,x0, using a logarithmic temperature decrease. In practice, we used a geometric decrease which is faster and gives an approxi-mate solution close to the optimal one. The initial and final temperatures are estimated through the variation of the en-ergy following White [15].
The process has two stages. At the beginning, i.e. when the temperature is high (see Figure5-(d) showing two simple examples of simulations), the process explores the density modes and favors configurations which have a high den-sity. In this exploration stage, the data-driven kernelQ2 is mainly used (q1= q3= 18q2= 0.1)3. At low temperature4, the configuration is close to the optimal solution and does not evolve very much : it involves a detailed adjustment of the 3D-block parameters. In this second stage, the regular-ization kernelQ3is mainly used (q1= q2=18q3= 0.1).
4. Experiments
The results were obtained from satellite DEMs (0.7 m
resolution) and aerial DEMs (0.1 and 0.25 m resolution).
The results show the reconstruction of complex buildings and dense urban areas whose level of detail depends on both the choice of the extraction process (automatic or interac-tive) and the kind of data. There is no comparison with other approaches for the reasons underlined in the introduction, except where the context is similar [7]. DEMs have been generated from3-view images using a multi-resolution
plementation of a Cox and Roy optimal flow matching im-age algorithm [11]. The 3D ground truths are raster images. Generic textures were applied to the objects of Figure6for visualization.
Figures6and7present various examples of reconstruction (showing different roof types, roof height discontinuities, closed structures or complex roof junctions). These results are convincing. The 3D-blocks are correctly assembled and few artefacts are generated which means the process adapts to buildings with complex roof junctions.
Results shown in Figure 6 were obtained from satellite DEMs with automatic 2D extraction. Even if some details are omitted, the shapes of buildings compare well to the ground truth and the generalization level is satisfactory with respect to the context. The different roof types were cor-rectly identified and the roof height discontinuities were ac-curately located. The ground errors for the automatic 2D ex-traction process were satisfactory. The over-detection rate (in term of surface) was9.7%. This rate can be improved by
adding a vegetation mask to prevent the detection of trees. 3The qicorrespond to the probability of choosing the kernel Qiin an iteration of the RJMCMC sampler.
Figure 6. Reconstructed buildings with automatic 2D extraction from satellite data (4th
row), satellite images (1st
row), ground truths (2nd
row) and DEMs with 2D-supports (3rdrow).
Figure 7. Reconstructed buildings with interactive 2D extraction from satellite data (3 first examples) and 0.25m resolution aerial data (2 last examples) (2nd
row), DEMS with 2D-supports (1st
row).
The rate of missed detection was quite high (15%).
How-ever, it was mainly due to low flat buildings in inner court-yards (one floor height structures) that the 2D extraction process cannot detect since these buildings have low DEM discontinuities. Without taking into account these low flat buildings, this rate falls to4.5%. The altimetric Root Mean
Square Error (RMSE) in this context (satellite data / fully-automatic process) is2.3 m. This is better than the 3.2 m
er-ror obtained earlier [7] in the same context, but still remains
high. It is mainly due to both a non optimal positioning of 2D-supports in the automatic extraction process (which en-genders important local altimetric errors at some locations) and inaccuracies in the DEMs (which mainly correspond to matching problems of non Lambertian surfaces such as glass rooves). The second example underlines the limits of the automatic 2D extraction process: some footprints (espe-cially curved footprints) cannot be modeled accurately by sets of quadrilaterals. The proposed kernels achieved
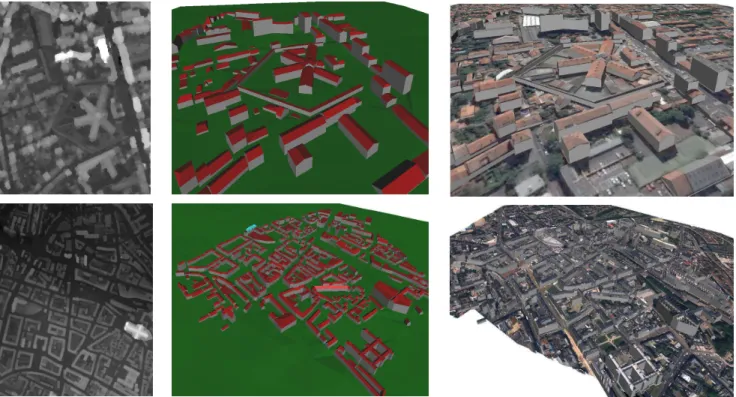
ac-Figure 8. Urban area reconstruction without and with textures (3rd/2ndcolumns) from satellite data (1strow) and aerial data (2ndrow), DEMs (1stcolumn).
ceptable computation times. Less than one minute is neces-sary to obtain the buildings of Figure6using a3Ghz
pro-cessor (vs5 minutes [7]).
Figure 7 presents examples of buildings reconstructed by the interactive 2D extraction process. In the two first exam-ples, the results are clearly better since the 2D-supports are accurately located. The reconstruction is more detailed and the altimetric RMSE is1.1 m from the satellite data.
Figure8shows results on two typical European down town areas. The computation time for the second example was
35 minutes (0.6km2- about700 objects).
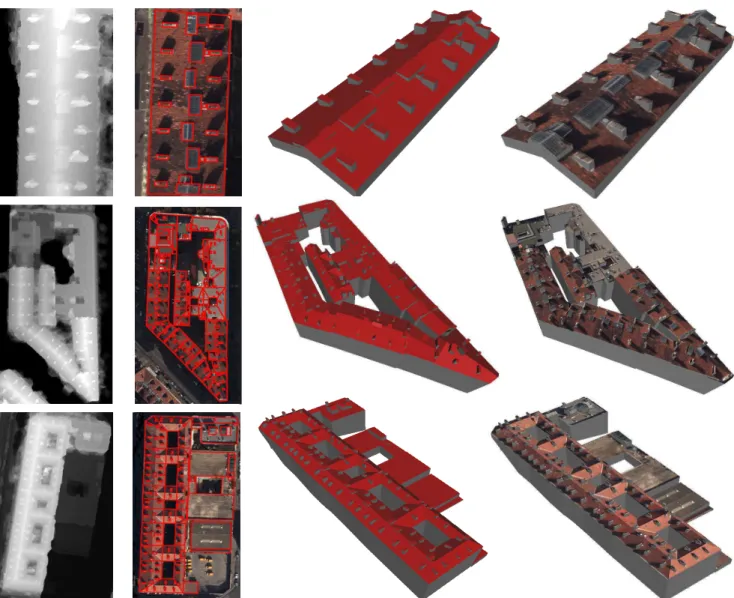
The proposed method also allows modeling roof details such as chimneys or dormer-windows. In fact, the library of 3D blocks is general enough to reconstruct such roof su-perstructures. Figure9presents accurate results of building superstructure reconstruction from a0.1 m resolution aerial
DEM. The altimetric RMSE for these images is0.6 m - a
very good value.
5. Conclusion
This new method is an interesting alternative to generic and parametric approaches. It presents several important characteristics. First, it obtains very good results from a single DEM. Moreover, contrary to other methods, this approach works efficiently on various data resolutions: a global description of the buildings from 0.7 m resolution
satellite data or a detailled building reconstruction includ-ing roof superstructures from0.1 m aerial data. The user
can also choose the level of automation of the process since the 2D-supports can be extracted either interactively or au-tomatically. To conclude, it is an adaptive method since other 3D-block types can be added to the library depending on the context.
In future work, it would be interesting to improve the opti-mization step to achieve both higher precision and shorter computing time. Adaptive cooling schedules could be used in the RJMCMC sampler or the Jump-Diffusion pro-cesses which are efficient for similar optimization prob-lems. Moreover, we should evaluate the potential of this method on other kinds of cities such as typical North Amer-ican urban areas.
References
[1] C. Baillard, C. Schmid, A. Zisserman, and A. Fitzgibbon. Automatic line matching and 3D reconstruction of buildings from multiple views. In ISPRS Conference on Automatic Ex-traction of GIS Objects from Digital Imagery, 1999.1
[2] A. Dick, P. Torr, and R. Cipolla. Modelling and interpreta-tion of architecture from several images. IJCV, 60(2), 2004.
4
[3] C. Frueh, S. Jain, and A. Zakhor. Data processing algorithms for generating textured 3D building facade meshes from laser scans and camera images. IJCV, 61(2), 2005.1
Figure 9. Building superstructure reconstruction without and with textures (3rd/4thcolumns) from 0.1m resolution aerial DEMs (1
st
column) and 2D-supports (2ndcolumn).
[4] P. Green. Reversible Jump Markov Chains Monte Carlo computation and Bayesian model determination. Biometrika, 57, 1995.4
[5] Z. Kim and R. Nevatia. Automatic description of complex buildings from multiple images. CVIU, 96(1), 2004.1
[6] F. Lafarge. Stochastic approaches for 3D building recon-struction. PhD thesis, Ecole des Mines de Paris, Paris, France, 2007.2,4
[7] F. Lafarge, X. Descombes, J. Zerubia, and M. Pierrot-Deseilligny. An automatic building reconstruction method : A structural approach using high resolution images. In Proc. IEEE ICIP, Atlanta, USA, 2006.2,3,4,5,6,7
[8] S. Lee and R. Nevatia. Interactive 3D building modeling using a hierarchical representation. In IEEE Workshop on higher-level knowledge in 3D modeling and motion, Nice, France, 2003.1
[9] P. Mueller, P. Wonka, S. Haegler, A. Ulmer, and L. Van Gool. Procedural modeling of buildings. In Proceedings of ACM
SIGGRAPH, Boston, U.S., 2006.1
[10] M. Ortner, X. Descombes, and J. Zerubia. Building outline extraction from Digital Elevation Models using marked point processes. IJCV, 72(2), 2007.2
[11] S. Roy and I. Cox. A maximum-flow formulation of the n-camera stereo correspondence problem. In Proc. IEEE ICCV, Bombay, 1998.5
[12] S. Scholze, T. Moons, and L. Van Gool. A probabilistic approach to building roof reconstruction using semantic la-belling. In Proceedings of the 24th DAGM Symposium on Pattern Recognition, London, UK, 2002.1
[13] Z. Tu and S. Zhu. Image Segmentation by Data-Driven Markov Chain Monte Carlo. IEEE PAMI, 24(5), 2002.4
[14] U. Weidner and W. Forstner. Fowards Automatic Build-ing Reconstruction from High Resolution Digital Elevation Models. JPRS, 50(4), 1995.1
[15] S. White. Concepts of scale in simulated annealing. In Proc. IEEE Int. Conf. on Computer Design, 1984.5
