HAL Id: hal-02285490
https://hal.archives-ouvertes.fr/hal-02285490
Submitted on 12 Sep 2019
HAL is a multi-disciplinary open access
archive for the deposit and dissemination of
sci-entific research documents, whether they are
pub-lished or not. The documents may come from
teaching and research institutions in France or
abroad, or from public or private research centers.
L’archive ouverte pluridisciplinaire HAL, est
destinée au dépôt et à la diffusion de documents
scientifiques de niveau recherche, publiés ou non,
émanant des établissements d’enseignement et de
recherche français ou étrangers, des laboratoires
publics ou privés.
Improving Flutter Localization Performance by
Optimizing the Inverse Dower Transform
Haziq Azman, Olivier Meste, Gabriel Latcu, Kushsairy Kadir
To cite this version:
Haziq Azman, Olivier Meste, Gabriel Latcu, Kushsairy Kadir. Improving Flutter Localization
Perfor-mance by Optimizing the Inverse Dower Transform. Computing in Cardiology, Sep 2019, singapore,
Singapore. �hal-02285490�
Improving Flutter Localization Performance by Optimizing the Inverse Dower
Transform
Muhammad Haziq Kamarul Azman
1 2, Olivier Meste
1, Decebal G. Latcu
3, Kushsairy Kadir
21
Universit´e Cˆote d’Azur, CNRS, I3S, France
2Universiti Kuala Lumpur, Malaysia
3Centre Hospitalier Princesse Grace, Monaco
Abstract
A previous study showed the possibility to localize right or left flutter circuit origin using variability contained in vectorcardiographic loop parameters. The Inverse Dower Transform, used to obtain the vectorcardiograms is based on a very simplistic torso conductor model, and hence not optimized. The present study aims to optimize the trans-form to maximize classifier accuracy. A parametric opti-mization model was proposed, as well as an optiopti-mization scheme. Model parameters were obtained by iteratively optimizing the linear SVM classifier accuracy until con-vergence. The goal can be shown to be multimodal and non-smooth. Therefore, a multi-instance and derivative-free method was considered. Previous dataset of 56 flutter recordings (31 right, 25 left) was used, considering only non-overlapped and respiratory motion-corrected F loops. For the SVM classifier, a3.8% increase in accuracy was observed (max 0.95). When the logistic regression clas-sifier was used, an increase of 7.8% was observed (max 0.98). Comparison to a targeted transform previously de-veloped showed an improvement by17−19%. Observation of the model parameter values showed amplitude reduction applied to Lead X and rotation applied to Lead Z.
1.
Introduction
Atrial flutter (AFL) is an arrhythmia involving a rapid, rotating circular depolarization of the atrium, whose cir-cuit may be located in either right or left atrium. Local-ization of the circuit is an important objective in radiofre-quency catheter ablation therapy, and it may condition the difficulty and efficacity of the procedure. The rotating cir-cular depolarization generates a pseudo-periodic sawtooth waveform on the electrocardiogram (ECG); a full wave representing one complete cycle is known as an F wave. Our previous study showed that by using serial beat-to-beat approach, variability features extracted from the vec-torcardiographic (VCG) F loops obtained from the 12-lead
ECG using the Inverse Dower Transform (IDT) allowed non-invasive localization of AFL circuits [1].
The VCG is an orthogonal 3-lead system [2], obtained by combination of several signals from a 7-unipolar elec-trode system. The combination weights were found from geometric interpolations of an image surface spanned by the 7 lead vectors, derived from a homogeneous volume conductor model of the torso (tank filled with saline so-lution). The Inverse Dower Transform [3] (IDT) utilizes the same information from this image surface. Since the image surface does not account for heterogeneity due to organs and anatomical structures, the IDT is not optimized for a real torso. Furthermore, electrode misplacement is not accounted for.
Thankfully, these can be formulated in a mathematical context, allowing for the use of estimation-optimization techniques for finding the optimized transform coeffi-cients. In addition, the optimization goal can be based on e.g. localization accuracy, which is a more direct endpoint than e.g. similarity to real VCG. However, it is expected that the goal has non-ideal properties, since classifier accu-racy depends greatly on the distribution of the data given a set of considered features and classes, as well as the op-timization coefficients, and the relation between these ele-ments are not known.
In this paper, we propose a model of the conductor het-erogeneity and electrode misplacement, as well as an op-timization scheme. A proof of multimodal non-smooth goal is made and an appropriate estimation-optimization scheme is presented. Results were compared with a differ-ent transform previously used with atrial signals [4].
2.
Methodology
2.1.
Dataset and Preprocessing
The dataset used in this study consists of 56 ECG recordings of AFL, acquired during catheter ablation oper-ations at Centre Hospitalier Princesse Grace, Monaco. All
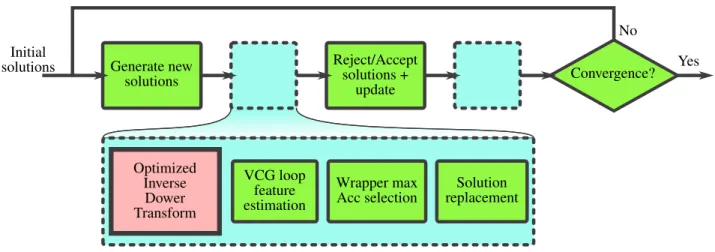
Convergence? Generate new solutions Reject/Accept solutions + update Optimized Inverse Dower Transform VCG loop feature estimation Wrapper max Acc selection Solution replacement Initial solutions No Yes
Figure 1. Diagram of the estimation-optimization scheme. Solutions here refer to the set of 6 coefficients of the model parameters (see (2)). The bold-lined red box indicates the novel approach of optimizing the IDT transform matrix.
signals were recorded at fs = 2000Hz. A finite-impulse
response notch filter at 50Hz was applied to these signals to remove powerline interference, and were then filtered at [0.5; 70]Hz using type II Chebyshev high- and low-pass fil-ters to remove baseline wander and high-frequency noises. Records with missing leads, low F wave amplitudes, low atrioventricular block ratio (< 2 : 1) were excluded from the study. In total, there were 31 recordings with right cir-cuit localization and 25 with left localization.
F waves from each recording were detected, segmented, synchronized, transformed into VCG and removed of res-piratory motion using a technique described previously [1]. Only F waves not overlapped within T waves were consid-ered. For this study, only the statistics Mean(·), Var(·), Skewness(·) and Kurtosis(·) were considered for the 4 loop parameters (total of 16 features, see [1] for details).
2.2.
Error Model
The IDT describes a linear combination of a reduced set of leads from the 12-lead ECG to the VCG Y = TX where T is the 3 × 8 IDT matrix described in [3], X and Y are the 8×N and 3×N 8-lead ECG and VCG respectively. The 8 leads are arranged as [V1V2V3V4V5V6I II].
Ideally, the thorax is required to be a homogeneous con-ductor, and the ECG electrodes should be placed at the same locations originally indicated on the chest. How-ever, this is an impossible feat as physical human anatomy has heterogeneous conductivity and variations from patient to patient, and electrode placement depends on operator proficiency and chest shape. Both these effects can be translated as a gain or attenuation as well as a rotation of each lead vector. Thus, Y → ˜Y = AQY, where A = diag(aX, aY, aZ) is a diagonal matrix of gain or
attenuation, and Q ∈ R3×3 a rotation matrix, satisfying
QTQ = I. We thus have:
AQY = TX (1)
To optimize the IDT, the errors can be compensated:
Y = A−1QTTX (2)
In practice, diag(bX, bY, bZ) = B = A−1 and
R = QTwere estimated instead. R can be decomposed
into individual 3D rotation matrices RX, RY, RZ for
each of the 3 axis of the VCG leads, with each matrix computable from the angles φX, φY, φZrespectively, and
R = RXRYRZ. The 6 parameters capture the essential
errors observed on the VCG and avoid models with large number of parameters that would be more difficult to esti-mate.
2.3.
Outline of Optimization Procedure
The goal of parameter estimation: maximize the clas-sifier accuracy, is different than most conventional ap-proaches. This requires us to define it in the scope of op-timization, to be able to decide which method is suitable for use. Furthermore, conventional techniques do not ac-count for the nature of data distributions given a certain feature set: a subject particularly associated with machine learning. The scheme presented here constitutes an origi-nal approach that combines elements of optimization and machine learning.
2.3.1. Properties of the Goal
The optimization goal is defined as: max Acc = TP + TN
Note that the denominator is constant for a given set of M data points contained in X, with a set of features F . The numerator is essentially the number of elements in the union { ˆG = Right|Gtrue = Right} ∪ { ˆG = Left|Gtrue =
Left} = G, with G being a label. The union contains data points whose predicted labels ˆG are similar to the true la-bels Gtrue, for all available classes. Suppose g a binary M
-vector (entry values equal 0 or 1) with elements represent-ing membership or not of each data point in G. Each entry gmof g is determined by the classifier through some
eval-uation of the conditional probability P{Gm|xm, B, R, E }
that includes not only the optimization parameters, but also the subset of features E ⊆ F that give maximum accuracy.
The final form amounts to: max
B, R, EAcc =
1
Mkg(X, B, R, E)k0 (3) It can be shown that this goal formulation has a non-convex and non-smooth form, by noticing that on conver-gence, the three optimal rotation angles ˆφ∗
X, ˆφ∗Y, ˆφ∗Z can
be ±180◦ambiguous, and that the L0norm is not smooth.
In practice, class overlap also affects goal convexity and smoothness.
2.3.2. Optimization Scheme
Due to the above-mentioned goal formulation and con-straints, a multi-instance derivative-free optimization algo-rithm should be used, to account for goal non-convexity and non-smoothness. In this study, we employed cuckoo search (CS) as the algorithm of choice [5]. The algorithm requires a small number of tuning parameters and is rela-tively simple in implementation.
n initial candidate solutions are instantiated randomly across the solution space. For each instance, the goal is first evaluated. Then, an update is performed, moving each solution to another candidate solution via a L´evy random walk. These new candidate solutions are evaluated, and they replace the initial solutions if they have higher goal values.
Next, a random decision is made on whether to reject or accept the solutions. A probability pa determines the
chance of being rejected. Finally, solutions are updated again via a biased random walk. Only accepted solutions are updated. The algorithm iterates again with the final solutions of iteration k − 1 used as initial candidates of iteration k, until it satisfies a convergence criteria. At the end of each iteration, the best value of the goal indicates the best solution. Figure 1 summarizes the process.
15 instances we used to simultaneously search the solu-tion space. The probability pa is set to 0.25, as was
sug-gested by the authors of CS. No attempt was made to find the best value of pa or n. Convergence was set to occur
when an accuracy of 1 is achieved or the best goal does
not change for 10 iterations. A boundary is imposed after each generation or update of solution to avoid non-sensical solutions. The scale parameters b were limited to values in the range [0.001; 5] and rotation parameters φ to values in the range [−179.999; 180]◦.
For each evaluation, a set of candidate ˆbX, ˆbY, ˆbZ and
ˆ
φX, ˆφY, ˆφZ were obtained. For each F wave of each
recording, the optimization detailed in (2) is applied, loop features were calculated and an exhaustive wrapper eval-uation of feature combination up to a length of 7 features was performed. For each feature combination, the accu-racy was calculated. The maximum accuaccu-racy was taken as the current solution’s goal value. The linear support vec-tor machine (SVM) classifier is due to simplicity and low training time. Blue boxes with dashed lines in Figure 1 summarizes this process.
3.
Results and Discussion
3.1.
Pre- versus post-optimization
compar-ison of classifier performance
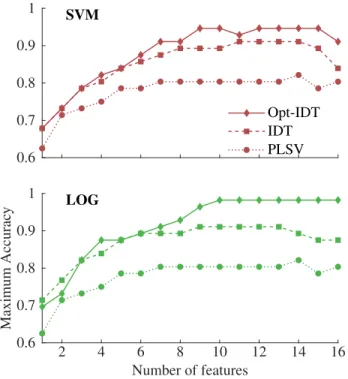
0.6 0.7 0.8 0.9 1 IDT Opt-IDT PLSV 2 4 6 8 10 12 14 16 Number of features 0.6 0.7 0.8 0.9 1 Maximum Accurac y SVM LOG
Figure 2. Maximum accuracy of the SVM (top) and LOG (bottom) classifiers pre- and post-optimization of the IDT (IDT and Opt-IDT). Results of the PLSV transform is also shown for comparison.
The maximum SVM classification accuracy is shown in Figure 2 (top diagram). An improvement can be ob-served, starting as early as 4 combination of features.
The maximum improves from 0.91 to 0.95 ((Se, Sp) = (0.97, 0.92)). This is an improvement of 3.8% from the previous result (Acc = 0.91, (Se, Sp) = (0.94, 0.88)). The result illustrates the validity of the approach.
The same optimized dataset was evaluated with the lo-gistic regression (LOG) classifier. The bottom diagram of Figure 2 shows the maximum accuracy of this classifier when operating on the optimized dataset. An even bigger improvement can be seen (7.8% accuracy increase, opti-mized Acc = 0.98 and (Se, Sp) = (0.96, 1.00)), suggest-ing that parameters can be transferred to other classifiers, and that it may also result in better improvements.
3.2.
Performance of alternative transform
Alternatives to the IDT are available [4]. These trans-forms target atrial activity specifically: it is suggestive that they may produce better results than ours. To investigate this matter, classifier performance results using the PLSV transform were also obtained. The processing scheme is similar to the one detailed in [1], except that the IDT is replaced by the PLSV transform.
The result for both SVM and LOG classifiers are shown in Figure 2. As can be seen, performance is low and does not even match the unoptimized IDT. Compared to the op-timized IDT, there is a difference of 17−19% in maximum performance. This shows that the IDT is still useful in the context of localization using beat-to-beat approach, and that its optimization results in increased performance as opposed to using alternative transforms.
3.3.
Transform coefficients
The optimal parameter values represent the optimal scaling and rotation applied to each VCG lead. After nor-malization of the scale values by the largest ˆb, and ad-dition of ±180◦ to the rotation values, the strongest ef-fects were observed on lead X (right-to-left component) and lead Z (front-to-back component; ˆb∗X = 0.72 and
ˆ
φ∗Z = −12.52◦). The remaining parameters did not present strong effects (scale values close to 1, rotation val-ues close to 0). The two optimization is regarded as suf-ficient to increase separation between right and left AFL variability. Furthermore, feature selection returned similar relevant features as previously found in addition to other previously irrelevant features, further reinforcing this fact.
3.4.
Limitations
The model parameters were obtained using a very small sample size and is not representative of the actual popu-lation of AFL circuits. It is expected to be unoptimized on datasets different than the one employed here. Further-more, no cross-validation was attempted.
The optimization procedure required a very long run-time (total of ∼ 90 hours using an 4-core Intel i5 running at 3.3 GHz with parallel processing) due to the use of the exhaustive wrapper evaluation scheme. Shorter runtimes can be achieved using more cores.
4.
Conclusion
An original approach of optimizing the Inverse Dower Transform for better localization of right or left flutter cir-cuit is presented. An error compensation model was pro-posed. Estimation of the model parameters was made con-sidering a more direct endpoint (maximizing localization accuracy). Optimization goals and properties were dis-cussed and a procedure was proposed. This resulted in an increase in classification accuracy (up to 7.8%), also shown to be transferable to other classifier models. Perfor-mance using an alternative transform showed inferior per-formance of 17 − 19% less compared to the optimization proposed here.
References
[1] Kamarul Azman MH, Meste O, Kadir K. Localizing atrial flutter circuit using variability in the vectorcardiographic loop parameters. In Computing in Cardiology, volume 45. September 2018; 4.
[2] Frank E. An accurate, clinically practical system for spatial vectorcardiography. Circulation 1956;13(5):737–749. [3] Edenbrandt L, Pahlm O. Vectorcardiogram synthesized from
a 12-lead ECG: superiority of the inverse Dower matrix. Journal of Electrocardiology 1988;21(4):361 – 367. [4] Guillem MS, Sahakian A, Swiryn S. Derivation of
orthogo-nal leads from the 12-lead ECG. accuracy of a single trans-form for the derivation of atrial and ventricular waves. In Computing in Cardiology, volume 33. September 2006; 249– 252.
[5] Yang XS, Suash Deb. Cuckoo search via l´evy flights. In 2009 World Congress on Nature & Biologically Inspired Comput-ing (NaBIC). IEEE, 2009; 210–214.
Address for correspondence: Muhammad Haziq Kamarul Azman Room 416
Universiti Kuala Lumpur, British Malaysian Institute Batu 8, Jalan Sungai Pusu
53100 Selangor, Malaysia [email protected]