HAL Id: hal-00349699
https://hal.archives-ouvertes.fr/hal-00349699
Submitted on 9 Jun 2021
HAL is a multi-disciplinary open access
archive for the deposit and dissemination of
sci-entific research documents, whether they are
pub-lished or not. The documents may come from
teaching and research institutions in France or
abroad, or from public or private research centers.
L’archive ouverte pluridisciplinaire HAL, est
destinée au dépôt et à la diffusion de documents
scientifiques de niveau recherche, publiés ou non,
émanant des établissements d’enseignement et de
recherche français ou étrangers, des laboratoires
publics ou privés.
Distributed under a Creative Commons Attribution - NonCommercial - NoDerivatives| 4.0
International License
Foot, hand, face and eye representation in the human
striatum.
Emmanuel Gerardin, Stéphane Lehéricy, Jean-Baptiste Pochon, Sophie
Tézenas Du Montcel, Jean-François Mangin, Fabrice Poupon, Yves Agid,
Denis Le Bihan, Claude Marsault
To cite this version:
Emmanuel Gerardin, Stéphane Lehéricy, Baptiste Pochon, Sophie Tézenas Du Montcel,
Jean-François Mangin, et al.. Foot, hand, face and eye representation in the human striatum.. Cerebral
Cortex, Oxford University Press (OUP), 2003, 13 (2), pp.162-9. �10.1093/cercor/13.2.162�.
�hal-00349699�
The present study aimed at determining the three-dimensional organization of striatal activation during foot, hand, face and eye movements. Seven right-handed, healthy volunteers were studied at 1.5 T using blood oxygen level dependent (BOLD) contrast. The tasks consisted of self-paced flexion/extension of the right and left fingers and right toes, contraction of the lips and saccadic eye movements. For foot, hand and face movements, striatal activation was mainly found in the putamen with a somatotopical organization, the foot area being dorsal, the face area more ventral and medial, the hand area in between. Overlap between somatotopic territories was present, more prominent for hand–face than for foot–face or foot–hand areas. In the putamen, the activated areas of the ipsi- and contralateral hand areas were not identical, suggesting a partial segregation of the ipsi- and contralateral striatal sensorimotor projections. For saccadic eye movements, bilateral activation was observed at the junction between the body and the head of the caudate nucleus and in the right putamen. These data present evidence for a somatotopic organization of the human striatum which corresponds with the topography of corticostriatal projec-tions described in the non-human primates.
Introduction
A lthough the role of the basal ganglia is not precisely under-stood, numerous studies have demonstrated their involvement in psychomotor behavior (Brooks, 1995; Parent and Hazrati, 1995; Middleton and Strick, 2000) and basal ganglia lesions lead to various hypo- or hyperkinetic movement disorders, such as tremor, dystonia or chorea (Brooks et al., 2000; Obeso et al., 2000). In non-human primates, all cortical projections upon the striatum are topographic (Selemon and Goldman-Rakic, 1985). The sensorimotor cortices mainly project toward the dorsal part of the postcommissural portion of the putamen (Künzle, 1975; Parent and Hazrati, 1995) and the sensorimotor compartment of the striatum is somatotopically organized (Künzle, 1975; Flaherty and Graybiel, 1993). In humans, previous studies have shown the potential of functional magnetic resonance imaging (fMRI) in studying basal ganglia activity during motor tasks (Bucher et al., 1995; Lehéricy et al., 1998; Maillard et al., 2000; Scholz et al., 2000).
Improved knowledge of the organization of the striatal sen-sorimotor compartment compared with cortical representation is critical for understanding the role of the striatum in motor behavior. The first fMRI study to address the somatotopical representation of the striatum has reported a foot and hand representation in the putamen similar to that obser ved in non-human primates (Lehéricy et al., 1998). Since then, other reports have further extended these findings for face movements (Maillard et al., 2000) and suggested that activation was less lateralized in the basal ganglia than in the cortex (Scholtz et al., 2000).
Several questions remain to be elucidated. Studies in primates (Künzle, 1975; Hikosaka et al., 1989; Alexander and Crutcher,
1990; Parthasarathy et al., 1992; Flaherty and Graybiel, 1993) and preliminar y studies in humans (Lehéricy et al., 1998; Maillard et al., 2000; Scholz et al., 2000) have suggested a dorsal to ventro-medial representation of the foot, hand and face area in the putamen, and a predominant representation of eye move-ments in the caudate nucleus. In humans, a comprehensive study of the three-dimensional (3-D) somatotopic representations of the foot, hand, face and eye areas is still lacking. The degree of overlap between each territory is also still debated (Lehéricy et al., 1998; Maillard et al., 2000). Within the putamen, the projections zones of the ipsi- and contralateral sensorimotor cortices in primates tended to interdigitate rather than com-pletely overlap (Flaherty and Graybiel, 1993). Basal ganglia, which are connected to bilateral cortical areas, may show more frequent bilateral activation during unilateral movements than in the primary sensorimotor cortex.
The aims of the present study were: to determine the 3-D somatotopic representation of the foot, hand, face and eye areas in the striatum; to study the degree of overlap between these territories and between the projection zones of the ipsi- and contralateral hand areas; and to study further the laterality of basal ganglia activation compared with other cortical areas.
Materials and Methods
Subjects
Seven right-handed, healthy volunteers were studied (six men, one woman; age range 24–31 years). The French National Ethics Committee approved the study. A ll subjects gave informed consent. Handedness was confirmed by a test of laterality (Dellatolas et al., 1988).
Imaging
The MR protocol was carried out using at 1.5 T whole-body system using blood oxygen level dependent (BOLD) fMRI. The head of the subject was immobilized using foam cushions and tape. The protocol included: (i) one sagittal T1-weighted image to localize functional and anatomical
axial slices; (ii) 20 axial gradient echo echo-planar (EPI) images (5 mm no gap, TR= 3000 ms, TE= 60 ms, bandwidth = 125 kHz,α= 90°, FOV = 240
×240 mm2, matrix size: 64×64, in-plane resolution = 3.75×3.75 mm);
and (iii) 110 axial contiguous inversion recover y 3-D fast SPGR images (1.5 mm thick, TI= 400 ms, FOV = 240×240 mm2, matrix size = 256×256)
for anatomical localization. Images were acquired over 60–90 min.
Tasks
The subjects performed five different tasks: (i) f lexion/extension of the fingers of the right hand; (ii) f lexion/extension of the fingers of the left hand; (iii) f lexion/extension of the toes of the right foot; (iv) contraction of the lips; and (v) saccadic eye movements. Saccadic eye movements consisted in horizontal ocular movements of∼20° in the leftward and rightward directions performed in the dark with eyes closed. A ll movements were self-paced. Specific instructions concerning the movements to be made were given to the subjects immediately before the experiment. Movements were shown to the subjects by the experimenter at a rate of∼1 Hz, without any explicit instruction given concerning the movement frequency. Before the scan, subjects performed each
Foot, Hand, Face and Eye Representation
in the Human Striatum
Emmanuel Gerardin1,2,5, Stéphane Lehéricy1,3,5, Jean-Baptiste Pochon1,5, Sophie Tézenas du Montcel6, Jean-François Mangin1, Fabrice Poupon1,3, Yves Agid4, Denis Le Bihan1and Claude Marsault3
1Ser vice Hospitalier Frédéric Joliot, Department of Medical
Research, CEA, Orsay and IFR 49,2Department of
Neuroradiology, Hôpital C. Nicolle, Rouen and Departments of 3Neuroradiology,4Neurology,5Inserm EPI 007 and
6Biostatistics and Medical Informatics, Hôpital de la Salpêtrière, Paris, France
movement for∼15–30 s. The frequency at which the movement was spon-taneously performed by the subject was monitored by the experimenter (∼1 Hz) before and during the scan. During the scan, the subjects laid in the dark with eyes closed. In the rest condition, they were told to remain in a resting awake state. Task switching instructions were recorded on a digital audio device and presented using standard headphones custom-ized for fMRI experiments and inserted in a noise-protecting helmet that provided isolation from scanner noise. One hundred and twenty-four EPI volumes were acquired over 6 min 12 s for each of the five different tasks. During this period, subjects alternated 15 epochs of 24 s of rest (R) and motor conditions (M): M–R–M–R–M–R–M–R–M–R–M–R–M–R–M). The first four volumes of each sequence were discarded to reach signal equilibrium.
Analysis
A ll data analyses were performed with statistical parametric mapping, v. 99 (SPM 99; Wellcome Department of Cognitive Neurology, London, UK). For each subject, anatomical images were transformed stereo-tactically to Talairach coordinates (Talairach and Tournoux, 1988). The functional scans, corrected for subject motion, were then normalized using the same transformation and smoothed with a Gaussian spatial filter to a final smoothness of 5 mm. Data were analyzed on an individual (subject per subject) basis and across subjects (group analysis using fixed effect analysis)
For group analysis, data from each run were modeled using the general linear model with separate delayed boxcar functions modeling hemodynamic responses of each period of tasks. Overall signal differ-ences between runs were also modeled. A temporal cut-off of 120 s was applied to filter subject-specific low frequency drift related mostly to subject biological rhythms. An SPM {F} map was obtained, ref lecting significant activated voxels according to the model used (P < 0.001). Separate analyses were performed during all motor tasks. To test hypotheses about regionally specific condition effects, the estimates were compared using linear contrasts comparing motor tasks and rest. The resulting set of voxel values for each contrast constituted an SPM {T} map. The resulting set of T-values was then thresholded at P < 0.05 (T > 4.78).
Data were corrected for multiple comparisons inside the volume of the whole brain. For basal ganglia, data were first thresholded at T > 3.09 (P < 0.001). In these thresholded maps, activated clusters were corrected for multiple comparisons inside the volume of the striatum [small volume correction (Worsley et al., 1996)] and considered significant if their spatial extent was >4 voxels, corresponding to a P < 0.05 corrected. In this case, the small volume correction is valid because the statistical analysis is guided by a ver y strong anatomical hypothesis, with well-defined and invariant anatomical landmarks across subjects (Worsley et al., 1996). To study the degree of overlap between areas activated during the different movements in the striatum, data were analyzed as a function of the statistical thresholds (from P = 10–6 to P = 10–2) uncorrected for multiple comparison, as the degree of overlap depends on the statistical threshold used to detect activation. For individual analysis, parametric maps were constructed using the same contrasts and thresholds as for the group analysis.
Three-dimensional Anatomical Localization in the Basal Ganglia
The 3-D reconstruction of the basal ganglia was obtained using semi-automatic segmentation software based on region growing. Activation maps in the basal ganglia were superimposed on 3-D reconstructions of the normalized images. Overlap between clusters activated in the striatum during the various motor tasks was calculated using dedicated automatic software.
Results
Striatum
Somatotopic Representation of the Foot, Hand and Face Areas in the Putamen
In the group analysis (P < 0.05, corrected for multiple com-parison), activation was contralateral to right finger movements and bilateral for foot and left hand movements (Table 1). Bilateral lip movements were associated with bilateral activation in Table 1
Coordinates of significant cluster maxima in the group analysis for left and right hands, right foot, lip and eye movements
Anatomic area (Brodmann area) Hemisphere Right hand movement Left hand movement Right foot movement Lip movement Saccadic eye movement
x y z T-score x y z T-score x y z T-score x y z T-score x y z T-score
Cortical areas
Inferior frontal area (BA 44/45) R 54 12 0 6.8 60 12 18 8.0
L –54 9 3 5.6 –51 6 3 5.1 –54 12 6 7.9
Primary sensorimotor area (BA 4) R 39 –21 69 16.8 60 –6 48 14.5 45 0 54 8.7 L –36 –18 66 13.7 –3 –30 66 8.5 –57 –12 42 13.0 –45 –6 54 6.7 Lateral premotor area (BA 6) R 39 –6 66 14.8 63 12 36 6.6 54 0 48 7.0
L –39 –6 57 9.0 –57 6 30 7.8 –57 9 36 6.3
Medial premotor area pre-SMA R 0 3 51 8.1 6 6 54 9.7 6 6 66 6.4 L
Medial premotor area post-SMA R 3 0 66 9.2 3 –3 66 8.3 3 0 66 11.1
L 0 –3 54 8.3 –3 –15 72 10.2 0 6 54 9.2
Inferior parietal/SII area (BA 40/43) R 66 –21 30 5.0 63 –21 27 9.5 66 –21 30 5.9 66 –21 27 7.9 L –54 –24 21 7.7 –51 –39 33 5.4 –54 –24 21 5.4 –60 –15 36 11.8 Striatum
Caudate nucleus R 18 –3 21 5.3 15 3 15 6.0 15 6 15 3.6
L –18 –6 18 4.9
Anterior part of the putamen R 30 3 3 3.8 30 3 0 4.4 24 6 9 3.7 L –27 9 0 4.6 –24 18 3 4.6 –30 3 –3 5.6
Posterior part of the putamen R 33 0 3 4.4 –33 –9 18 5.6
L –30 0 –3 5.4 –30 0 9 4.6 –27 –3 3 6.6 Ventral striatum R 30 6 –9 4.6 27 15 –9 4.9 Thalamus R 15 –12 6 5.4 12 –9 9 4.7 L –12 –15 F 6 6.0 –6 –21 15 4.7 –12 –12 12 4.5 Cerebellum R 18 –45 –18 15.9 12 –57 –6 6.8 15 –57 –12 7.2 12 –57 –12 6.3 L –15 –45 –18 13.0 –12 –39 –3 6.1
Coordinates are in millimeters relative to the anterior commissure, corresponding to the Talairach and Tournoux atlas (Talairach and Tournoux, 1988). Activation differences were considered significant at
P < 0.05 corrected for multiple comparison inside the volume of the whole brain. For basal ganglia, activation differences were considered significant at P < 0.001 and if their spatial extent was >4 voxels
(P < 0.05 corrected for multiple comparison inside the volume of the striatum). L = left; R = right; SMA = supplementary motor area.
Cerebral Cortex Feb 2003, V 13 N 2 163
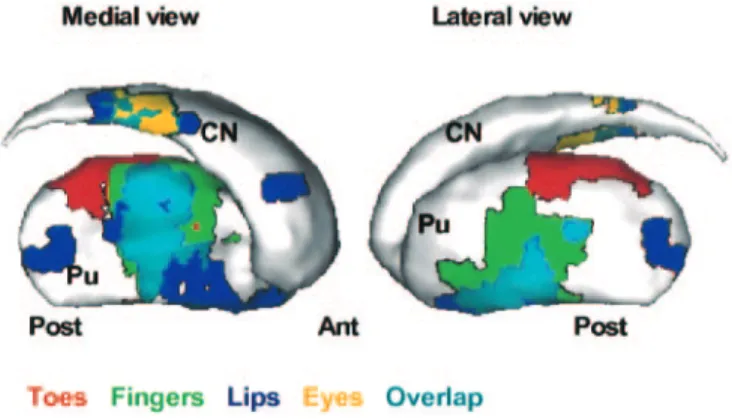
the putamen. Saccadic eye movements were associated with activation in the anterior part of the right putamen. Within the left putamen, pixels activated during movements of the foot were located in the dorsal part of the structure, pixels activated
during lips movements were located more ventrally and medially, and pixels activated during hand movements were located in between (Figs 1 and 2). No significant pixel was activated in the left putamen during eye movements. Activation largely pre-dominated at the level of the anterior commissure and in the post-commissural putamen (Figs 1 and 2). Some activated pixels were also found in the pre-commissural putamen.
Overlap was obser ved between the hand, foot and face areas (Table 2, Fig. 2). Table 2 indicates the variation of the degree of overlap between toe, finger and lip areas as a function of the statistical threshold. As expected, the mean volume of activation varied as a function of the statistical threshold, but was larger for the finger and lip than for toe movements (Table 2). Overlap was limited between the foot and both the hand and face areas, observed at the lowest statistical thresholds, whereas the foot area was completely separated from both the hand and face areas at the highest thresholds. Overlap was more pronounced between the hand and face areas, including about half the activated volume and was still present at the highest statistical thresholds. Distances between centers of mass of the three territories tended to increase slightly with increasing levels of statistical stringency. Except at the lowest statistical threshold of P < 0.01 (Fig. 2), the somatotopic organization tended more to form oblique rather than horizontal bands on coronal sections.
Individual analysis confirmed that activation was mainly contralateral to the moving fingers or toes (Table 3, Fig. 3), whereas activation in the putamen ipsilateral to the moving limb was weaker and smaller. Overall, foot, hand and face activation Figure 1. Somatotopic body representation in the left striatum during toe (red), finger
(light green), lip (dark blue) and eye (yellow) movements (group analysis). Cluster-level activation differences were considered significant at P < 0.05 corrected for multiple comparison inside the volume of the striatum. Overlap between territories is represented in light blue. Within the putamen, pixels activated during movements of the foot were located in the dorsal part of the structure, pixels activated during lip movements were located more ventrally and medially, and pixels activated during hand movements were located in between. Abbreviations: Ant, anterior; CN, caudate nucleus; Post, posterior; Pu, putamen.
Figure 2. Variation of the overlap between toe (red), finger (light green) and lip (dark blue) areas in the left putamen as a function of the level of statistical stringency (from P < 0.01 to P < 0.000001, group analysis). Limited overlap was observed between the foot and both the hand and face areas. Overlap (in light blue) was more pronounced between the hand and face areas and still present at the highest statistical thresholds. Except at the lowest statistical threshold of P < 0.01, this somatotopic organization tended to form vertico-oblique bands on coronal sections. Abbreviations: Ant, anterior; L, left; Post, posterior; R, right.
was reproducible across subjects with variability in extent and center of mass. Statistical comparison (signed rank test) of the centers of mass of foot–hand–face activation in the putamen
confirmed that the foot area (mean Talairach coordinates ± SD: 27.7 ± 1.0; –1.8 ± 4.9; 8.6 ± 2.3) was located dorsal to the hand (mean Talairach coordinates ± SD: 28.8 ± 1.2; –5.1 ± 9.1; 6.8 ± 1.9) and the face areas (mean Talairach coordinates ± SD: 26.9 ± 1.7; –0.4 ± 4.8; 3.8 ± 2.6) and that the face area was medial and ventral to the hand area (all P-values <0.02). No difference was found in the rostro-caudal axis. Three-dimensional reconstruc-tion in individual subjects of foot, hand and face areas showed that activated areas tended to form discrete zones rather than to be distributed in uniform clusters (Fig. 3).
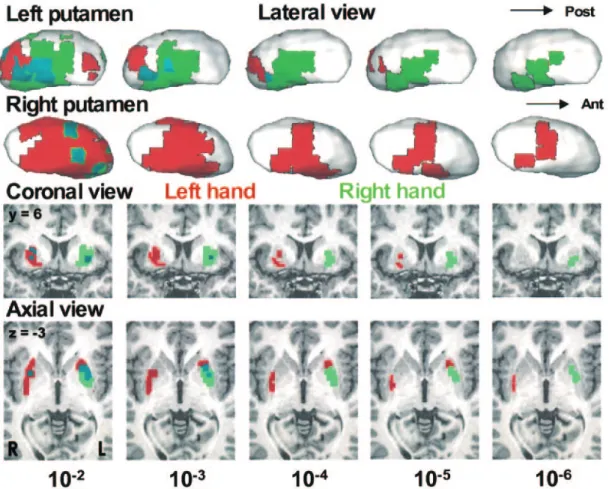
Ipsi- and Contralateral Representation of Hand Areas in the Putamen
For hand movement, activation was larger in the contralateral than the ipsilateral putamen. Ipsilateral activation was more prominent for the non-dominant than the dominant hand movements (Table 4). In the left putamen, ipsilateral activation tended to be anterior to contralateral activation (Fig. 4). The activated zones of the ipsi- and contralateral hand areas were largely separated with only moderate overlap (11% of the right hand area in the left putamen at P < 0.001). In the right putamen, activation during right hand movement was weak and largely overlapped with activation during left hand movement.
Caudate Nucleus
In the group analysis, the caudate nucleus was not activated Table 2
Overlap between toes, fingers and lips areas in the left putamen as a function of statistical threshold
Significance threshold Volume (mm3) COM distance (mm) Overlap (mm3)
Right handa Right footb Lipsc Hand versus foot Hand versus lips Lips versus foot Hand versus foot Hand versus lips Lips versus foot
P < 0.01 5433 2291 5223 12.1 2.5 11.2 815 3477 888
P < 0.001 3840 1366 3256 12.6 3 12.7 346 2150 228
P < 0.0001 2656 797 1921 13.7 3 13 80 1328 38
P < 0.00001 1718 436 1719 16.1 4.6 13.3 34 756 17
P < 0.000001 1019 211 986 20.1 5.4 15.5 0 377 0
Coordinates are in millimeters, relative to the anterior commissure, corresponding to the Talairach and Tournoux atlas (Talairach and Tournoux, 1988). COM, center of mass.
aZ-score = 5.37; coordinates = –30, 0, 0. bZ-score = 4.57; coordinates = –30, 0, 9. cZ-score = 6.6; coordinates = –27, –3, 3.
Table 3
Number of subjects who presented a significant cluster for each of the five contrasts
Anatomic areas (Brodmann area) Side Right fingers Left fingers Toes Lips Eyes
Cortical areas
Primary sensorimotor area (4) R 0 7 0 7 7
L 7 0 7 7 6
SMA R 5 6 3 7 6
L 6 2 7 4 6
Inferior parietal/SII area (40.43) R 2 5 5 5 6
L 4 3 4 5 5 Subcortical areas Caudate nucleus R 0 2 1 2 5 L 1 0 1 1 5 Putamen R 1 4 2 6 7 L 7 1 7 7 6 Thalamus R 0 0 0 1 0 L 2 0 1 2 0 Cerebellum R 5 2 5 4 4 L 1 7 1 2 4
Activation differences were considered significant at P < 0.05 corrected for multiple comparison inside the volume of the whole brain. For basal ganglia, activation differences were considered significant at
P < 0.001 and if their spatial extent was >4 voxels (P < 0.05 corrected for multiple comparison inside the volume of the striatum).
Figure 3. Representation in individual subjects of the somatotopic body maps in the left putamen (external view) during toe (red), hand (light green) and lip (dark blue) movements. Overlap between territories is represented in light blue. Activated areas tended to form discrete zones rather than to be distributed in uniform clusters. Anterior, left; posterior, right.
Cerebral Cortex Feb 2003, V 13 N 2 165
during right hand and foot movements (Table 1). Bilateral activation was obser ved during saccadic eye movements extending from the head of the caudate into the body of the nucleus (Table 1, Fig. 5). R ight caudate activation was also observed during left hand and lip movements (Table 1).
Individual analysis showed that caudate activation was more frequent during saccadic eye movements (five out of seven subjects) than during the other tasks (Table 3).
Activation was also observed in the ventral striatum during left hand and lip movements.
Signal Intensity Variation
Signal changes, expressed as the average percent, were slightly lower in the putamen (1.54, 1.89 and 1.67% during finger, lip and toe movements in the left putamen, respectively) than in the primar y sensorimotor cortex (1.84, 1.88 and 1.90% Table 4
Overlap between left and right hand areas in the left and the right putamen as a function of statistical threshold
Significance threshold Left putamen Right putamen
RH volume (mm3)a LH volume (mm3)b COM distance,
LH versus RH (mm)
RH versus LH overlap (mm3)
RH volume (mm3)c LH volume (mm3)d LH versus RH
(COM distance, mm) RH versus LH overlap (mm3) P < 0.01 5433 2078 8 1358 799 5026 4.7 653 P < 0.001 3840 1146 11.6 422 0 3418 P < 0.0001 2656 563 13.5 53 0 2108 P < 0.00001 1718 402 13.5 17 0 1419 P < 0.000001 1019 0 0 0 743
Coordinates are in millimeters relative to the anterior commissure, corresponding to Talairach and Tournoux atlas (Talairach and Tournoux, 1988). COM, center of mass; RH, right hand; LH, left hand.
aZ-score = 5.37; coordinates = –30, 0, 0. bZ-score = 4.6; coordinates = –24, 18, 3. cZ-score = 2.43; coordinates = 30, 9, 0. dZ-score = 4.99; coordinates = 36, 0, 0.
Figure 4. Variation of the overlap (light blue) between the left (red) and the right (light green) hand areas in the putamen as a function of the level of statistical stringency (from P < 0.01 to P < 0.000001, group analysis). Limited overlap was observed between both hand areas in the left putamen. Activation in the right putamen during right hand movement was small. It was only detectable at the lowest statistical threshold and completely overlapped with left hand activation. Except for the lowest threshold, activation was more bilateral for the left (non-dominant) hand. Abbreviations: Ant, anterior; L, left; Post, posterior; R, right.
during finger, lip and toe movements in the left hemisphere, respectively).
Signal changes were 1.80% in the caudate nucleus and 1.85% in the frontal eye field (FEF) during eye movements.
Thalamus
Activation was obser ved in the ventrolateral–ventral postero-lateral areas of the thalamus (comprising the somatosensor y, cerebellar and pallidal afferent territories of the thalamus), contralateral to the moving hand or foot and bilaterally during lip and eye movements (Table 1).
Cortex
For hand, foot and lip movements, activation was observed in the primar y sensorimotor cortex, premotor cortex, supple-mentary motor area, inferior frontal area (BA44/45), secondary somatosensor y area (SII) and cerebellum (Table 1). In the primar y sensorimotor cortex, activation was always contra-lateral to the moving fingers or toes (Table 3). Bicontra-lateral activation was observed in the inferior frontal area and SII (Tables 1 and 3). For saccadic eye movements, activation was obser ved in the FEF and supplementary eye field (SEF; Tables 1 and 3).
Discussion
These findings provide functional evidence for a somatotopic
organization of the human striatum similar to that observed in non-human primates, with a foot–hand–face disposition along a dorsolateral to ventromedial gradient and a predominant repre-sentation of saccadic eye movements in the caudate nucleus. Overlap between somatotopic territories was present, which may allow interaction between information about different body parts. In the putamen, the activated areas of the ipsi- and contralateral hand areas were not identical, suggesting a partial segregation of the ipsi- and contralateral striatal sensorimotor projections.
Somatotopic Representation of Foot, Hand and Face in the Putamen
The ‘foot’ area was located in the dorsal part of the structure, the ‘face’ area was located more ventrally and medially, and the ‘hand’ area was located in between (Figs 1 and 2). Studies in rats (Brown and Sharp, 1995) and primates (Künzle, 1975; Alexander and DeLong, 1985; Liles and Updyke, 1985; Kimura, 1990; Flaherty and Graybiel, 1993; Parent and Hazrati, 1995) have shown a pronounced degree of somatotopic coding in cortico-striatal projections. Anatomical studies of the somatotopic body representation in the striatum using anterograde tracers (Künzle, 1975; Flaherty and Graybiel, 1993) have reported a similar foot–dorsal, face–ventromedial organization, and the arm area between the foot and the face areas. Electrophysiological studies using microstimulation and microelectrode recordings in the putamen have provided similar results (Alexander and DeLong, 1985; Liles and Updyke, 1985; Kimura, 1990, 1992). A more rostral situation of the ‘foot’ area has also been described, but was not found in the present study. However, unlike the somato-topic maps of the sensorimotor cortex, striatal projections from different body parts of the primary sensorimotor cortex seem to be distributed in patches in the matrix, with a conf luent dense ‘main field’ and fainter satellite zones (Flaherty and Graybiel, 1993). This pattern has been compared with the fractured somatotopy described in the cerebellum with multiple patchy representation of body parts. This raises the question of whether such an organization is specific to the squirrel monkey and re-lated to its different locomotor behavior (Flaherty and Graybiel, 1993), or whether it is common across species and represents a characteristic of striatal somatotopy.
In humans, the present results confirm our preliminary study at 3 T for foot and hand representation (Lehéricy et al., 1998). More recently, a triangular pattern has been reported in the putamen, with the face medial to foot and hand representation (Maillard et al., 2000). The present study is more in favor of somatotopic pattern in vertico-oblique bands on coronal sections, with the ‘face’ area more ventral and medial and the foot more dorsal and lateral (Fig. 2), in agreement with animal studies (A lexander and Crutcher, 1990; Brown and Sharp, 1995). Centers of mass distances between territories tended to be higher in the present study than previously reported (Maillard et al., 2000). The currently limited spatial resolution of fMRI studies may account for these differences between studies. Individual analysis suggested that activated areas were not distributed uniformly, but rather tended to appear as discrete zones reminiscent of the patchy distribution obser ved in primates. It remains to be determined whether this organization ref lects the presence of a single discontinuous body map or of separate functionally differentiated body maps in the putamen (Flaherty and Graybiel, 1993). Given the limited spatial reso-lution of conventional magnets compared to histological studies, this patchy distribution needs to be confirmed at higher spatial resolution. Studies at very high field strength may help elucidate Figure 5. Three-dimensional projection of the activation (in yellow) associated with
saccadic eye movements (group analysis). Cluster-level activation differences were considered significant at P < 0.05 corrected for multiple comparison inside the volume of the striatum. Bilateral activation was observed at the junction between the body and the head of the caudate nucleus and in the right putamen. Abbreviations: Ant, anterior; CN, caudate nucleus; Post, posterior; Pu, putamen.
Cerebral Cortex Feb 2003, V 13 N 2 167
this point (Yacoub et al., 2001). Furthermore, very high field MRI may also provide information on other smaller basal ganglia nuclei, such as the pallidum, the subthalamic nucleus and the substantia nigra, which are not yet accessible to conventional magnets.
Segregation or Convergence of Sensorimotor Areas
Overlap between somatotopic territories is a matter of debate: it may be limited (Lehéricy et al., 1998) or more prominent (Maillard et al., 2000). Overlap between distant cortical terri-tories in the putamen may have functional significance in allowing interaction between information about different body parts. Using fMRI, the degree of overlap depends on several factors, such as the spatial resolution of functional images, data processing, which often includes image spatial filtering, field strength and the statistical threshold used to detect activation. Results in the present studies show that overlap between foot, hand and lip territories was only partial, mainly obser ved at the periphery of each territor y. Overlap was limited between the ‘foot’ and the other two territories and larger between the ‘hand’ and ‘face’ territories. This fits well with animal data. In monkeys, although overlap was uncommon for the dense ‘main field’ of distant somatotopic zones, it was the rule for the fainter satellite zones surrounding these dense zones, even for body parts as distant as foot and hand (Flaherty and Graybiel, 1993).
Ipsi- versus Contralateral Representation of Hand Areas in the Putamen
In contrast to the primar y sensorimotor cortex, in which activation was always contralateral to the moving fingers or toes, activation in the putamen was bilateral for unilateral hand and foot movement, confirming previous reports (Scholz et al., 2000). For hand movement, activation was larger in the contralateral than the ipsilateral putamen. A lthough motor cortical areas project mainly to ipsilateral subcortical structures, a substantial fraction of these connections also project contra-laterally via the corpus callosum (Wiesendanger et al., 1996). In monkeys, the primary sensorimotor cortex sends a modest con-tralateral projection (Flaherty and Graybiel, 1993; Wiesendanger et al., 1996), whereas the SM A sends nearly symmetric bilateral projections (McGuire et al., 1991; Wiesendanger et al., 1996). Similarly, pallido-thalamic projections are known to be bilateral (Hazrati and Parent, 1991). These bilateral projections probably represent the anatomical substrate of bilateral striatal activation. In monkeys, contra- and ipsilateral hand projections formed distinguishable input system in the putamen, largely avoiding each other (Flaherty and Graybiel, 1993). This organization suggests that the putamen segregate motor information about the ipsilateral and contralateral distal part of the body (Flaherty and Graybiel, 1993). The present results are consistent with animal data (Flaherty and Graybiel, 1993), as the projection zones of the ipsi- and contralateral hand areas in the left putamen were largely separated, with only moderate overlap. However, ipsilateral activation tended to be anterior to contralateral acti-vation, in contrast to non-human primates in which projections were at approximately the same antero-posterior levels (Flaherty and Graybiel, 1993). This may be due to the concomitant activation of the SM A territory in the putamen, which has been located more rostrally than the primary sensorimotor territory in monkeys (Selemon and Goldman-Rakic, 1985).
Thalamic activation was only obser ved in the hemisphere contralateral to the moving hand and foot. Thus, information related to unilateral limb movement may be conveyed through the basal ganglia in both hemispheres and converge to the
contralateral thalamus. This point needs to be confirmed, however.
Saccadic Eye Movement and Caudate Nucleus Activation
Saccadic eye movements were associated with bilateral acti-vation in the caudate nucleus. Caudate nucleus actiacti-vation was more specifically obser ved during saccadic eye movements, whereas caudate activation was rarely observed during the other tasks. Caudate nucleus activation extended from the head of the caudate well into the body of the nucleus, predominat-ing at the same coronal level of the anterior pole of the thal-amus. Activation in the right putamen, also obser ved during saccadic eye movements, was located nearby right caudate activation (Fig. 4). These data are in agreement with non-human primate studies (Künzle and Akert, 1977; Shook et al., 1991; Parthasarathy et al., 1992). Anatomical studies showed that the FEF and SEF projected principally to the caudate nucleus and adjoining parts of the putamen. Within the caudate nucleus, the projection field of these two regions was located at the coronal level of the rostral pole of the thalamus (Künzle and Akert, 1977), or extended from the level of the anterior pole of the putamen to the posterior body of the caudate nucleus (Shook et al., 1991; Parthasarathy et al., 1992). In contrast to these studies, the anterior part of the caudate nucleus, which also receives SEF and FEF projections, was not activated. Electrophysiological studies in primates have suggested that neurons in more rostral parts of the caudate nucleus were activated during tasks which require higher-order processes than simple saccadic eye movements (Hikosaka et al., 1989). In humans, a previous fMRI study has reported a predominance of caudate activation during saccadic eye movements, without further precision on the localization (Scholz et al., 2000).
Cortico-subcortical Loop
Motor-related activation occurred mainly in the putamen at the level of the anterior commissure and in the post-commissural putamen. This area corresponds to the sensorimotor territory of the striatum in primates, the major target of cortical efferents from the primar y motor and somatosensory cortices (Künzle, 1975; A lexander and DeLong, 1985; Liles and Updyke, 1985; A lexander and Crutcher, 1990; Kimura, 1990; Flaherty and Graybiel, 1993; Brown and Sharp, 1995; Parent and Hazrati, 1995). In positron emission tomography (PET) and fMRI studies, Talairach coordinates of peak activation in the putamen during simple finger movements, such as a highly practiced sequence (Jenkins et al., 1994), a repetitive movement of the middle finger (Jueptner et al., 1997), or f lexion/extension of all fingers (Lehéricy et al., 1998), were similar to those obser ved in the present study. The same applies for foot movement: –27, –6, 11 (Lehéricy et al., 1998) compared with –30, 0, 9 in the present study. Small interstudy variation may be due the limited spatial resolution of functional images and to differences in data analysis. In these tasks and in the present tasks, cortical acti-vation was mainly restricted to the motor cortex, the posterior SM A and the cerebellum. However, when subjects learned a new sequence of finger movements with additional cognitive demand (Jenkins et al., 1994; Jueptner et al., 1997), generated a random sequence of finger movements making a new decision on each trial as to which finger to move (Jueptner et al., 1997), or imagined hand movements (Gerardin et al., 2000), more anterior parts of the striatum were activated (caudate nucleus and putamen rostral to the anterior commissure), as well as pre-frontal cortex and the anterior cingulate area. Thus, the differ-ent territories of the basal ganglia may be activated during
movements in relation to specific cortical areas corresponding to the cortico-basal ganglia–thalamo-cortical loops described in monkeys (A lexander and Crutcher, 1990; Parent and Hazrati, 1995).
In summar y, these results show the 3-D somatotopic organ-ization of the human striatum, confirming the foot–hand–face disposition along a dorsal to ventromedial gradient in the putamen. Overlap between somatotopic territories was present, although variable, depending on the level of statistical strin-gency. This overlap may allow interaction between information about different body parts. Comparison between the projec-tion zones of the ipsi- and contralateral hand areas in the left putamen suggested that they were not identical, as described in primate studies. Saccadic eye movements were more specifically associated with caudate nucleus activation, in line with animal studies.
Notes
This research was supported by grants from the Délégation à la Recherche Clinique (DRC) and the Assistance Publique-Hôpitaux de Paris (CRC 96067).
Address correspondence to Dr Stéphane Lehéricy, Ser vice de Neuroradiologie, Bâtiment Babinski, Hôpital de la Salpêtrière, 47 Bd de l’Hôpital, 75651 Paris Cedex, France. Email: stephane.lehericy@ psl.ap-hop-paris.fr.
References
A lexander GE, Crutcher MD (1990) Functional architecture of basal ganglia circuits: neuronal substrates of parallel processing. Trends Neurosci 13:266–271.
A lexander GE, DeLong MR (1985) Microstimulation of the primate neostriatum. II. Somatotopic organization of striatal microexcitable zones and their relation to neuronal response properties. J Neurophysiol 53:1417–1430.
Brooks DJ (1995) The role of the basal ganglia in motor control: contributions from PET. J Neurol Sci 128:1–13.
Brooks DJ, Piccini P, Turjanski N, Samuel M (2000) Neuroimaging of dyskinesia. Ann Neurol 47(Suppl. 1):S154–S158.
Brown LL, Sharp FR (1995) Metabolic mapping of rat striatum: somatotopic organization of sensorimotor activity. Brain Res 686:207–222.
Bucher SF, Seelos KC, Stehling M, Oertel WH, Paulus W, Reiser M (1995) High resolution activation mapping of basal ganglia with functional magnetic resonance imaging. Neurology 45:180–182.
Dellatolas G, De Agostini M, Jallon P, Poncet M, Rey M, Lellouch J (1988) Mesure de la préférence manuelle par autoquestionnaire dans la population française adulte. Rev Psychol Appl 38:117–136.
Flaherty AW, Graybiel A M (1993) Two input systems for body representations in the primate striatal matrix: experimental evidence in the squirrel monkey. J Neurosci 13:1120–1137.
Gerardin E, Sirigu A, Lehéricy S, Poline JB, Gaymard B, Marsault C, Agid Y, Le Bihan D (2000) Dissociable neural networks for real and imagined hand movements. Cereb Cortex 10:1093–1104.
Hazrati LN, Parent A (1991) Contralateral pallidothalamic and pallido-tegmental projections in primates: an anterograde and retrograde labeling study. Brain Res 567:212–223.
Hikosaka O, Sakamoto M, Usui S (1989) Functional properties of monkey caudate neurons. I. Activities related to saccadic eye movements. J Neurophysiol 61:780–798.
Jenkins IH, Brooks DJ, Nixon PD, Frackowiak RSJ, Passingham RE (1994)
Motor sequence learning: a study with positron emission tomography. J Neurosci 14:3775–3790.
Jueptner M, Frith CD, Brooks DJ, Frackowiak RSJ, Passingham RE (1997) Anatomy of motor learning. II. Subcortical structures and learning by trial and error. J Neurophysiol 77:1325–1337.
Kimura M (1990) Behaviorally contingent property of movement-related activity of the primate putamen. J Neurophysiol 63:1277–1296. Kimura M (1992) Behavioral modulation of sensory responses of primate
putamen neurons. Exp Brain Res 89:473–477.
Künzle H (1975) Bilateral projections from the precentral motor cortex to the putamen and other parts of the basal ganglia. An autoradiographic study in Macaca fascicularis. Brain Res 88:195–209.
Künzle H, Akert K (1977) Efferent connections of cortical, area 8 (frontal eye field) in Macaca fascicularis. A reinvestigation using the auto-radiographic technique. J Comp Neurol 173:147–164.
Lehéricy S, Van De Moortele P-F, Lobel E, Paradis A-L, Vidailhet M, Neveu P, Agid Y, Marsault C, Le Bihan D (1998) Somatotopical organization of striatal activation during finger and toe movement: a 3 T fMRI study. Ann Neurol 44:398–404.
Liles SL, Updyke BV (1985) Projection of the digit and wrist area of precentral gyrus to the putamen: relation between topography and physiological properties of neurons in the putamen. Brain Res 339:245–255.
McGuire PK, Bates JF, Goldman-Rakic PS (1991) Interhemispheric integration: II. Symmetr y and convergence of the corticostriatal projections of the left and right principal sulcus (PS) and the left and the right supplementar y motor area (SM A) of the rhesus monkey. Cereb Cortex 1:408–417.
Maillard L, Ishii K, Bushara K, Waldvogel D, Schulman A E, Hallett M (2000) Mapping of the basal ganglia. fMRI evidence for somatotopic representation of face, hand, and foot. Neurology 55:377–383. Middleton FA, Strick PL (2000) Basal ganglia and cerebellar loops: motor
and cognitive circuits. Brain Res Rev 31:236–250.
Obeso JA, Rodriguez-Oroz MC, Rodriguez M, Lanciego JL, Artieda J, Gonzalo N, Olanow CW (2000) Pathophysiology of the basal ganglia in Parkinson’s disease. Trends Neurosci 23(Suppl.):S8–S19.
Parent A, Hazrati L-N (1995) Functional anatomy of the basal ganglia. I. The cortico-basal ganglia–thalamo-cortical loop. Brain Res Rev 20:91–127.
Parthasarathy HB, Schall JD, Graybiel A M (1992) Distributed but convergent ordering of corticostriatal projections: analysis of the frontal eye field and the supplementar y eye field in the macaque monkey. J Neurosci. 12:4468–4488.
Scholz VH, Flaherty AW, Kraft E, Keltner JR, Kwong KK, Chen Y I, Rosen BR, Jenkins BG (2000) Laterality, somatotopy and reproducibility of the basal ganglia and motor cortex during motor tasks. Brain Res 879:204–215.
Selemon LD, Goldman-Rakic PS (1985) Longitudinal topography and interdigitation of corticostriatal projections in the rhesus monkey. J Neurosci 5:776–794.
Shook BL, Schlag-Rey M, Schlag J (1991) Primate supplementary eye field. II. Comparative aspects of connections with the thalamus, corpus striatum, and related forebrain nuclei. J Comp Neurol 307:562–583. Talairach J, Tournoux P (1988) Co-planar stereotaxic atlas of the human
brain. New York: Thieme.
Wiesendanger M, Rouiller EM, Kazennikov O, Perrig S (1996) Is the supplementary motor area a bilaterally organized system? Adv Neurol 70:85–93.
Worsley KJ, Marrett S, Neelin P, Vandal AC, Friston KJ, Evans AC (1996) A unified statistical approach for determining significant signals in images of cerebral activation. Hum Brain Mapp 4:58–73.
Yacoub E, Shmuel A, Pfeuffer J, Van De Moortele PF, Adriany G, Andersen P, Vaughan JT, Merk le H, Ugurbil K, Hu X (2001) Imaging brain function in humans at 7 Tesla. Magn Reson Med 45:588–594.
Cerebral Cortex Feb 2003, V 13 N 2 169