HAL Id: hal-01140171
https://hal-paris1.archives-ouvertes.fr/hal-01140171
Submitted on 7 Apr 2015HAL is a multi-disciplinary open access archive for the deposit and dissemination of sci-entific research documents, whether they are pub-lished or not. The documents may come from teaching and research institutions in France or abroad, or from public or private research centers.
L’archive ouverte pluridisciplinaire HAL, est destinée au dépôt et à la diffusion de documents scientifiques de niveau recherche, publiés ou non, émanant des établissements d’enseignement et de recherche français ou étrangers, des laboratoires publics ou privés.
Mining Users’ Intents from Logs
Ghazaleh Khodabandelou, Charlotte Hug, Camille Salinesi
To cite this version:
Ghazaleh Khodabandelou, Charlotte Hug, Camille Salinesi. Mining Users’ Intents from Logs. Inter-national Journal of Information System Modeling and Design, IGI Global, 2015, Special Issue from the 8th IEEE International Conference on Research Challenges in Information Science (RCIS): 2014, Marrakesh, Morocco, 6 (2), pp.43-71. �10.4018/IJISMD.2015040102�. �hal-01140171�
Mining Users' Intents from Logs
Ghazaleh Khodabandelou, Charlotte Hug, Camille Salinesi
Centre de Recherche en Informatique, Université Paris 1 Panthéon – Sorbonne, France
ABSTRACT
Intentions play a key role in information systems engineering. Research on process modeling has highlighted that specifying intentions can expressly mitigate many problems encountered in process modeling as lack of flexibility or adaptation. Process mining approaches mine processes in terms of tasks and branching. To identify and formalize intentions from event logs, this work presents a novel approach of process mining, called Map Miner Method (MMM). This method automates the construction of intentional process models from event logs. First, MMM estimates users' strategies (i.e., the different ways to fulfill the intentions) in terms of their activities. These estimated strategies are then used to infer users' intentions at different levels of abstraction using two tailored algorithms. MMM constructs intentional process models with respect to the Map metamodel formalism. MMM is applied on a real-world dataset, i.e. event logs of developers of Eclipse UDC (Usage Data Collector). The resulting Map process model provides a precious understanding of the processes followed by the developers, and also provide feedback on the effectiveness and demonstrate scalability of MMM.
Keywords: Intentional Process Models, Machine Learning, Process Mining, Hidden Markov Models
INTRODUCTION
Process mining approaches aim at modeling users' behaviors in terms of sequences of tasks and branching in an automatic way (Van der Aalst, 2004) (Agrawal, 1998) (Cook, 1998) (Datta, 1998) (van Dongen, 2004) (Weijters, 2003) (Herbst, 2000) where the mined process models are activity-oriented models. However, processes can be seen as teleological (Ralph, 2008). A teleological process is a process that takes into account the teleological behaviors of process enactment (behaviors attached to the notion of goal). It describes the intentions (goals, objectives) associated with a result that an individual wants to obtain. In the late 90s, Rolland introduced a new category of process models, called intentional process models (Rolland, 1999), which takes into account the notions of intention and strategy to model the process enactment. A strategy is an approach, a manner or a means to achieve an intention (Rolland, 2007). Specifying intentions and strategies has proved to be a powerful tool to better
understand the deep nature of processes, to see how processes interweave and combine, to abstract processes and visualize them under man-manageable form, even when they are extremely complex (Rolland, 2005). Intentional process models have emerged to offer a flexible structure to model processes. Many research works in intentional process modeling demonstrate that the fundamental nature of processes is mostly intentional and the processes should be modeled from an intentional point of view (Davis, 1989) (Plihon, 1996) (Rolland, 1999). According to these approaches, an enacted process is a reflection of humans' intention performed as a sequence of activities. Therefore, it is not possible to model humans' cognitive operators, e.g., thinking, deciding, and acting process only in terms of a simple sequence of activities. Indeed, an intention is a goal that a user wants to achieve regarding the context in
which he/she is working (Plihon, 1996). The notion of context plays a key role for the intention, since a given intention emerges in a given context, which not only promotes its appearance, but also influences the realization of this intention (Rolland, 2005). In the method engineering context (Jankovic, 2013), it is essential to capture intentions that led to the
implementation of activities to understand methods used by stakeholders and their ways of working.
Intentions are a first class concept of information systems engineering (Rolland, 2005). In the early 80s, intentional process models have been proposed in information systems community (Swanson, 1974) (Christie, 1981) as a potential theoretical foundation to determine user's behavior (Davis, 1989). Intention models take root in a former work Technology Acceptance Model (TAM) (Davis, 1989) one of the extensions of Theory of Reasoned Action (TRA) (Ajzen, 1975) designed to model humans' behavioral intention, especially for computer usage behavior.
The TRA has proven effective in predicting and explaining humans' behavior through various domains. Since the early 90s, intentional software process specification have been promoted as a driving paradigm to study strategic alignment (Thévenet, 2007) (Etien, 2006) to define actors and roles, to specify the outcome of business process models (Salinesi, 2003) and name them, to analyze, to support guidance (Rolland, 1993) (Deneckère, 2010) to describe
intentional services (Rolland, 2010), to handle traceability issues (Jarke, 1993) to express pervasive information systems (Najar, 2011) to define systems requirements (Ralyté, 1999), to study users' behavior to identify and name use cases, to tailor methods (Ralyté, 2003) or to design more flexible methods (Mirbel, 2006), etc. Further, research on guidance in method engineering shows that many method engineering issues, such as rigidity or lack of
adaptation, are solved more effectively when intentions and strategies are explicitly specified (Rolland, 2005).
Many works (Rolland, 1998) on intentional process modeling indicate how to express the intentions, formalize them in models, relate them with other concepts and analyze them to solve a series of information systems engineering issues. However many questions still remain: can all the intentions be identified using those approaches? Do the theoretical
intentions in models fit with the actual real life intentions, and how to check this? As process mining approaches aim at discovering and modeling activity process models from event logs, in the same manner, intentions could be identified and modeled from event logs. To the best of our knowledge, event logs have been neglected to model intentional process models so far. Therefore, the main challenge of this work is how to identify and formalize intentions from event logs.
This paper proposes a novel approach of process mining, called Map Miner Method (MMM) that mines users' activities within a given process using event logs. MMM stands out from process mining approaches by modeling the process in terms of users' intentions and
strategies instead of users' activities. MMM takes users' traces as input to find users' intentions and strategies and constructs a Map process model (Rolland, 1999). More precisely, MMM consists in inferring the implicit users' intentions and strategies from users' traces recorded during the enactment of a given process. The discovery of intentions and strategies allows constructing a Map process model and thereby rebuilding the actual process model, i.e., the model followed by users. MMM is a generic approach which can be useful at different stages of process model life-cycle, for instance: (i) at the requirements level, to semi-automatically construct the actual processes enacted by users in organizations, from their daily activities recorded in logs; (ii) at the project management level, to check the alignment between a prescribed process model and what users actually do and possibly adapt and improve it to actual practice, (iii) at the application level, to monitor users activities and provide them recommendations at run-time according to their intentions.
MMM generates intentional process models specified with the Map formalism (Rolland, 2005). In this work, this formalism is chosen rather than other goal-oriented formalisms as i* (Yu, 2011) or KAOS (Dardenne, 1993) since, (a) it has already proven effective for specifying software engineering processes (Rolland, 1993), (b) it supports process variability and multi-process specification (Rolland, 1999), (c) it combines intentions and strategies at multiple levels of abstraction (Rolland, 2005), and (d) it scales well to large and complex processes (Rolland, 2009).
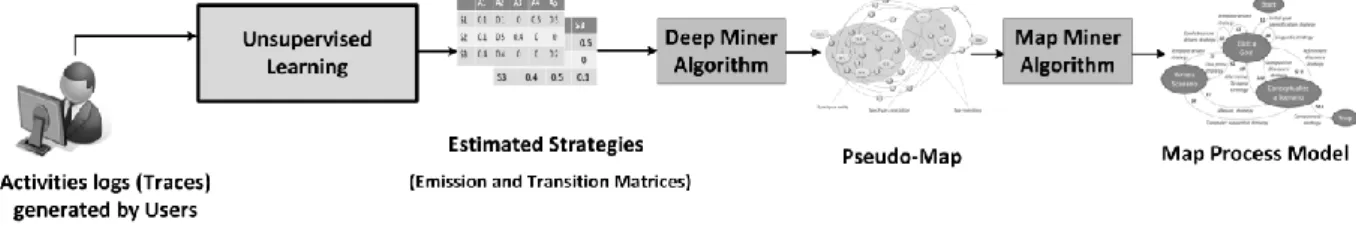
Figure 1. Overview of Map Miner Method.
From a technical point of view, MMM consists of three stages (see Figure 1 for an overview of MMM): (i) Estimating users' strategies: MMM uses Hidden Markov Models (HMMs) (Rabiner, 1989) to model users' activities into a multi-level topology of users' activities and corresponding strategies. Then using different techniques of learning, the users' strategies can be estimated. Mining the intentions needs the design of new algorithms and tools to generate Map process models. In this perspective, two algorithms are developed: (ii) Deep Miner algorithm: from estimated users' strategies, Deep Miner algorithm identifies users' intentions and discovers Map process models comprising low-level intentions, which are called pseudo-Maps, and (iii) Map Miner algorithm: starting from pseudo-pseudo-Maps, Map Miner algorithm constructs Map process models by clustering low-level intentions into high-level intentions with respect to the definition of intention in the Map formalism.
The entire proposed method was applied and validated on a large-scale dataset, i.e., on event logs of developers of Eclipse UDC (Usage Data Collector) (Eclipse, 2013) which
demonstrates the scalability of MMM. The resulting Map process model provides a precious understanding of the processes followed by the developers.
The reminder of this work is organized as follows: Section 2 presents the more salient process mining approaches and techniques which are used for mining processes. This current work is then positioned regarding these approaches. Section 3 investigates Map Miner Method which consists in three stages; first, we present Hidden Markov Models and how they can be adapted to estimate users' strategies; second, Deep Miner algorithm is introduced to explain how users' intentions can be modeled in a low-level of abstraction; finally, Map Miner algorithm is presented to explain how users' intentions can be modeled in a high-level of abstraction. Results of the case study are presented in Section 4. Finally, Section 5 concludes this work and gives the perspectives.
RELATED WORKS
The idea of mining process models from workflow logs was introduced by Agrawal (Agrawal, 1998). At the same time, Datta proposed to discover business process models (Datta, 1998) by using their own process mining technique. Cook et al. investigated similar issues in the context of software engineering processes (Cook, 1998). The majority of the process mining techniques focus on process models discovery based on observed event logs
(Van der Aalst, 2004) (Agrawal, 1998) (Cook, 1998) (Datta, 1998) (van Dongen, 2004) (Weijters, 2003) (Herbst, 2000). An overview of the early work in this domain is given in (Van der Aalst, 2003). The most important process mining techniques are described as follows:
Inference methods: these methods infer process models with a trade-off between results accuracy and noise robustness. Cook compares in (Cook, 1995) three inference algorithms of RNet (Das, 1994), Ktail (Biermann, 1972) and Markov models (Baum, 1966) for process discovery. The latter two are considered as the most promising approaches.
α-algorithm (Van der Aalst et al., 2004): this algorithm was proposed by Van der Aalst et al. to rebuild the causality in the Petri nets workflow from the existing relations in the event log. α-algorithm cannot handle noise and certain complicated routing constructs of workflow nets as loops and long-term dependencies, particularly during complex situations (Rozinat, 2010).
Directed acyclic graphs (Agrawal, 1998): this approach proposes to transform events into dependency graphs or workflow graphs using directed acyclic graph, representing events and their causal relations without loop. However, using this kind of graphs to model the processes is delicate due to the existing loops in process models.
Inductive workflow acquisition (Herbst, 2000) (Herbst, 2004): in the context of workflow management, this technique aims at finding the best Hidden Markov Models (HMMs) (Rabiner, 1989) that reflect the process models acquisition out of workflow models as well as their adaptation to requirements changes. A notable difference of this technique with others is that the same task can appear multiple times in the workflow model, i.e., the approach allows for duplicate tasks. However, some works using this approach are limited to sequential models (Herbst, 2000).
Hierarchical clustering (Greco 2005) (Song, 2009): this technique separates a set of event logs for a given process into clusters and finds the dependency graph for each log. Some clustering techniques use theory of regions to discover processes (van der Aalst et al., 2010) (van der Werf, 2008) (Carmona, 2008).
Genetic algorithm (De Medeiros, 2005): this technique provides process models (Petri nets) built on causal matrix, i.e., input and output dependencies for each activity. This technique tackles problems as noise, incomplete data, non-free-choice constructs, hidden activities, concurrency, and duplicate activities. Nevertheless, it requires the configuration of many parameters to deal with irrelevant data, which is a complex task.
Heuristic algorithm (Weijters, 2003) (van der Aalst et al., 2002) (Weijters, 2001): this technique is based on α-algorithm. It calculates the frequencies of relations between the tasks, e.g., causal dependency, loops, etc. and construct dependency/frequency tables and dependency/frequency graphs. However, heuristic algorithm needs a complex
configuration phase since there are several parameters to adjust.
The process mining approaches use many well-known or particular algorithms, classification or clustering techniques, ontologies-based techniques, etc. For instance, they mainly use
α-algorithm to model event logs. MMM derives the essential principle of process mining field, which means mining event logs to find users' behaviors pattern within a process. However, contrary to process mining approaches, MMM models users' behaviors in terms of their intentions and strategies. It adopts intention-oriented process model to design the processes while process mining approaches specify users' behaviors in terms of sequences of tasks and branching. Process mining approaches adopt an operational view focusing on how the process is performed, i.e., they do not consider users' intentions as a part of the process enactment. In contrast, MMM focus on what the process is intended to achieve, thus providing the rationale underlying the process, i.e. why the process is performed. In other words, MMM follows the humans' intentions during the process enactment as the force that drives the process, and concentrate on what the process must do, i.e., on its rationale.
Intentions are fundamental to human behavior, playing a central role in both its enactment and its understanding . In addition, the Map process models discovered by MMM are not
hampered by the problem of loops. This is due to the fact that Map process models can handle the loops as its sections can be enacted several times, until the desired intention is achieved. From a technical point of view, due to the multi-levels structure of MMM (users' activities, strategies and intentions), there has to be a mathematical model (i.e., HMM) to set up, at least, a two-level topology for the users' activities and strategies. None of the existing techniques considers the hidden states of HMMs as humans' cognitive process (e.g., users' strategies). The proposition of this paper is to model an HMM makes a huge difference of the application of HMMs on the logs to model users' behaviors.
The mathematical model used in MMM is Hidden Markov Models (HMMs). Among the techniques to model different aspects of humans' behavior (Gray, 1992), HMMs have been proven to be appropriate for modeling the real world process, particularly unobservable cognitive processes (Hayashi, 2003) (Hoey, 2007). HMMs are stochastic finite automaton and a special kind of Bayesian Network (Friedman, 1997). HMMs offer all the properties of the stochastic model in both statistical and probabilistic framework. HMMs have been used in a wide variety of contexts and have proven valuable in diverse fields such as speech recognition (Juang, 1991), signal processing (Kil, 1996), etc. Several reasons motivate this choice, which are described hereafter. The real-world processes generate a sequence of signals - observable discrete or continuous symbols (representation of a physical phenomenon) (Rabiner, 1989). Due to the nature of the input data - the users' activities - and the output data - the users' intentions and strategies - a stochastic model should be chosen because it allows:
(i) describing a given system as a theoretical statistical model, e.g., knowing the significance of the observed sequences, (ii) analyzing the observed sequences over time, (iii) modeling and predicting the latent states of these observed sequences, (IV) extracting the characteristics of observed and latent sequences.
Discovering intentions from event logs is not limited to MMM. Mining humans' goals is a challenging issue that is widely studied today in the contexts of business process (Outmazgin, 2013) and information retrieval (Yu, 1987) (Hashemi, 2008) (Baeza-Yates, 2006) (Chen, 2002). Intention mining approaches usually identify individual intentions for individual activities. Analyzing single activities leads to low-level intentions, also called basic intentions or action-intentions (Chen, 2002), which are closer to activities than proper intentions. On the contrary, MMM offers a model that integrates the concept of high-level intentions by
developing a new method that is based on extracting the information out of users' traces. This information (intentions and strategies of users) is then modeled by an intentional process model. Analyzing a sequence of activities allows determining the high-level intentions, e.g.,
organizational goals. Indeed, intentions in a process are related to each other to reach the ultimate goal; thus, intentions cannot be considered as independent entities resulting from a single activity.
MAP FORMALISM
Map process model
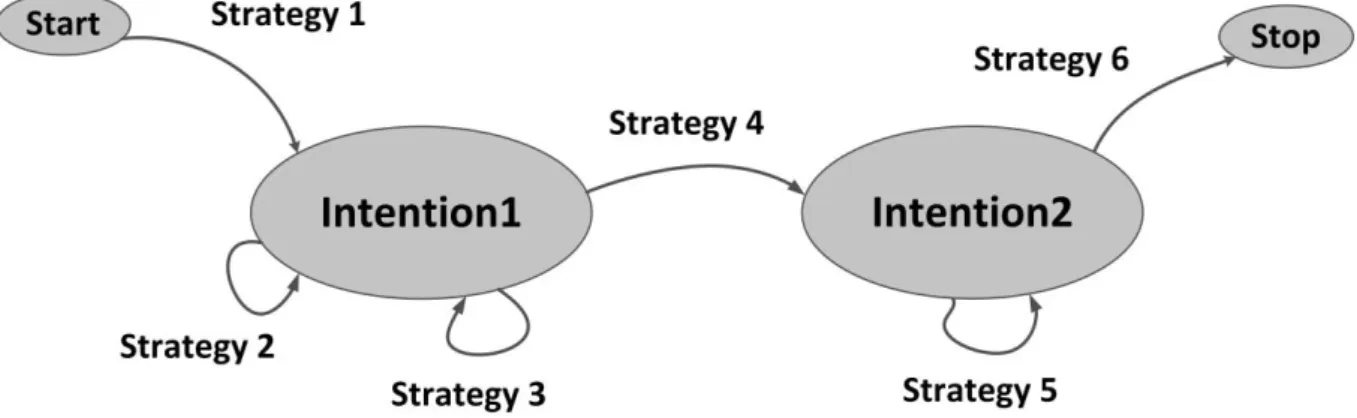
Map is an intentional process metamodel (Rolland et al., 1999). Map process model (an instance of Map metamodel) allows representing process models in terms of users' intentions and strategies. Figure 2 illustrates a Map process model where the nodes represent the
intentions and the edges represent the strategies. A set of <Source Intention, Target Intention, Strategy> represents a section in the Map. Map allows representing flexible process models, enacted in a dynamic way since the sections of a Map can be executed non-sequentially and as long as intentions are not completely fulfilled.
An intention is a goal that a user wants to achieve regarding the context in which he/she is working. Indeed, if intentions do not produce any activity, they cannot be directly detected from traces. In other words, we are only able to determine users' intentions through analyzing their performed activities. From a technical point of view, the notion of intention in MMM highly depends on the definition of the intention in the Map formalism, since MMM formalizes the intentions by using this formalism.
Figure 2. An example of Map process model. Pseudo-Map
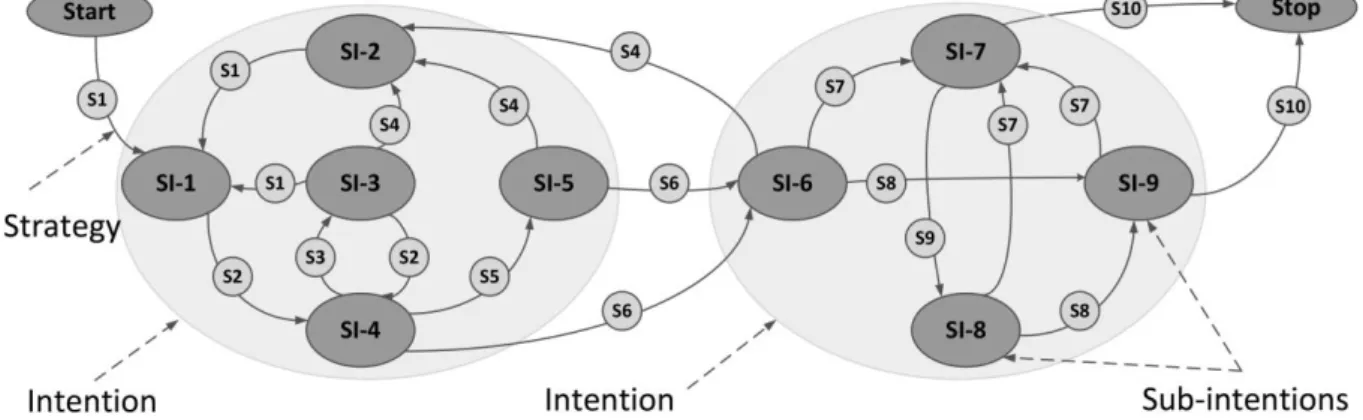
The intentions that MMM discovers have a higher degree of precision in the sense that they are more precise than the prescribed intentions. The notion of sub-intentions does not exist in the Map semantic. This led us to create a new concept in the Map formalism: sub-intention. Therefore, this notion can be considered as an extension of the Map metamodel.
Sub-intentions are the finest intentional objects, which are associated to a parent intention, and an intention is fulfilled if at least one of its sub-intention is fulfilled. They are shown with small nodes in Figure 3 and indexed by SI SI1, 2, . A process model containing sub-intentions, strategies, the Start and Stop intentions is called a pseudo-Map. MMM first discovers the sub-intentions and then it clusters them into high-level intentions to obtain a Map process model. The relationships between users' activities, strategies, and intentions are defined as: performing one or several activities relates to the enactment of a strategy and consequently to
the fulfillment of an intention. The relationships between users' activities and strategies are defined in the matrices. This is explained in the next section.
Figure 3. An example of a pseudo-Map.
MAP MINER METHOD
Map Miner Method (MMM) aims at inferring underlying users' intentions and strategies from users' traces recorded during the process enactment. As mentioned earlier, the definition of intention in MMM highly depends on the definition of the intention in the Map formalism. In Map formalism, intentions can be fulfilled with different alternative ways, i.e., strategies. These strategies must lead to intentions. Indeed, the relationships between users' activities, strategies, and intentions are defined as: performing one or several activities relates to the enactment of a strategy and consequently to the fulfillment of an intention. . MMM uses this rule to discover the intentions. The relationships between users' activities and strategies are estimated in the matrices. Then it uses the relationships between the strategies and intentions defined in the Map formalism to discover the intentions by using Deep Miner and Map Miner algorithms. This all is explained throughout this section.
Applying Hidden Markov Models
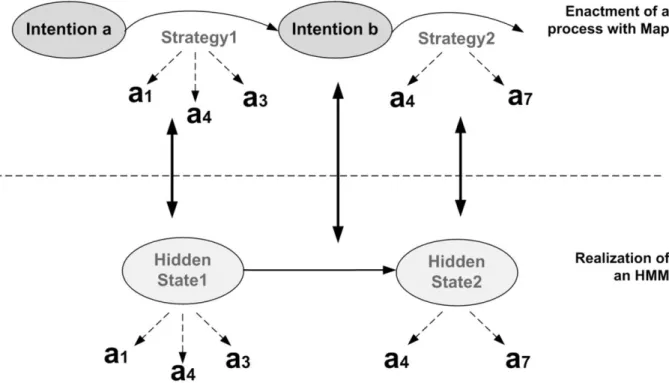
A HMM can be considered as the simplest Dynamic Bayesian Network (DBN) (Murphy, 2002). It turns out that the topology of HMMs is particularly adapted to model the relations between strategies and activities in the Map formalism. To make it clear, let us consider an example for a Map process model enacted with 2 strategies and an HMM realized with 2 hidden states (see Figure 4). As shown in this figure, strategies are used to pass from one intention to another and are made of one or several activities. For instance, strategy 1 allows moving from intention a to intention b and is made of activities
1 a ,
3
a and a4 (the order is not important).
The same structure can be found in a HMM, where hidden states generate observations. In other words, hidden state 1 generates the activities a1, a3 and a4. This similar topology motivates using HMMs to model hidden states as strategies, and transitions between the strategies as intentions. The next sections will describe how to obtain the intentions from the transitions.
Figure 4. An example for a Map process model enacted with 2 strategies (above) and a HMM realized with 2 hidden states (below).
Mathematical Definition of HMMs
HMMs are stochastic Markov chains used for modeling a hidden sequence by a finite number of states. HMMs allow modeling the structure of complex temporal dependencies. In order to use HMMs, one needs to determine their topology and estimate their statistical parameters. The flexible nature of HMMs, due to their topological structure, allows defining dependencies between hidden states and observed data from the past to the future ones, according to the context. HMM consists of two complementary Markov processes: hidden and observed processes. The states of hidden processes generate the symbol of observed processes. The states in hidden processes are not visible but the probability of being in a given state can be inferred by computing the Maximum Likelihood (ML) of symbols in observed process. Thus, there are two probability parameters: probabilities of the symbol emission and the
probabilities of the states ‘transition. Let X be a stationary and discrete source which generates a random observable sequence ( ,x , )x , of length . The generation process follows a Markov chain of order m (or with memory m), where m is finite, if the transition probability from one state to another depends on the m previous states. The choice of the order of Markov process (m) allows determining how far in the past one has to look to know the probability of the next state. The generation process can be written as follows:
( 1) ( 1) ( 2) ( 2) 1 1 ( 1) ( 1) ( 2) ( 2) ( ) ( ) Pr( | , , , ) Pr( | , , , m m ) X x X x X x X x X x X x X x X x for m (1.1)
Hidden Markov Models Adapted to MMM
Hereafter, the formal definition of HMM and unsupervised learning approach to compute its parameters are discussed. On the one hand, in the Map metamodel, strategies are used to move from one intention to another. A strategy is made of one or several activities; consequently, intentions are not directly related to activities. Furthermore, activities are observable through event logs while strategies are hidden and must be inferred from
observations. On the other hand, the topology of HMM permits modeling observed process (observations) in terms of hidden states (hidden part of observations). Therefore, to model the relationships between activities and strategies, HMM models activities as observed process and strategies as hidden states. Interestingly, this model also allows inferring intentions since once a strategy is inferred from activities, according to the Map formalism, a strategy leads to a target intention. For this reason in this framework, the hidden states of HMM are modeled as users' strategies and the observed process as users' activities. The set of possible strategies is denoted as and the set of possible activities as . For both Markov processes of an HMM, i.e., hidden and observed processes, the topology (the order of the Markov process) is defined next.
Topology of HMM in MMM Framework
For each Markov process of an HMM, i.e., for the hidden and the observed process, the topology (the order of process) must be defined. When the transition to the next state depends only on the current state, the Markov chain is of order 1 (model M1). When the transition to the next state does not depend on any state, the Markov chain is of order 0 (model M0). The
1 0
M M topology is chosen to model activities and related strategies. M1 is chosen to model the users' strategies transitions and M0 is chosen to model the users' activities transition. This choice is justified by the fact that strategies are performed in a logical order by users; a
strategy in one step impacts the transition to the next strategy in the next step. Even though the chosen model for users' activities is M0, an activity in a given step depends indirectly on the previous performed activity.
Hidden process: users' strategies
Let ( ,1 , )
L L
s s
s be a temporal sequence of users' strategies of length L. The topology 1
M is chosen for hidden process, which means that the strategy s1 at step only depends on the strategy at step 1. A homogeneous Markov chain, which parameters are denoted by T and π, models the hidden process of strategies with:
1
1
( , )u v Pr s v s| u u v, , 2,L , ( ) u Pr s u u
T (1.2)
The vector
contains the probabilities of strategy at the initial state and the matrix T contains the transition probabilities for the following strategies, i.e., the transitionObserved process: users' activities
Let a
a1,,aL
L be the temporal sequence of users' activities of length L.The model M0 is chosen for observed process, meaning that the emission of a , at a given step , does not depend on any previous observation. It only depends on the hidden strategy at the same time step. The emission probability of an a for a given strategy u is given by:
( , )a u Pr a u|E (1.3)
The matrix E contains the emission probabilities of any activity for any strategy. Assuming that , and π are known, the HMM model is fully described by { , }E T , which represents the core information about the HMM behavior. The transition probabilities are the probabilities of a hidden state at step to reach another hidden state at step 1 (or to stay in the same state). Let N | | and M | | be the cardinals of and , i.e. the total number of hidden states and observed data, respectively. The following constraints must be verified by the parameters of an HMM:
1 1 ( , ) 1, ( ) 1, N M u v a u v a u
T
E (1.4) where ( , ) 1, ( , )u v u v ; u( ) 1,a u , a T EFrom an initial hidden state given by
, an observation is generated according to E, then and for each step of the process a new hidden state is generated according to T and a newobservation is generated according to E.
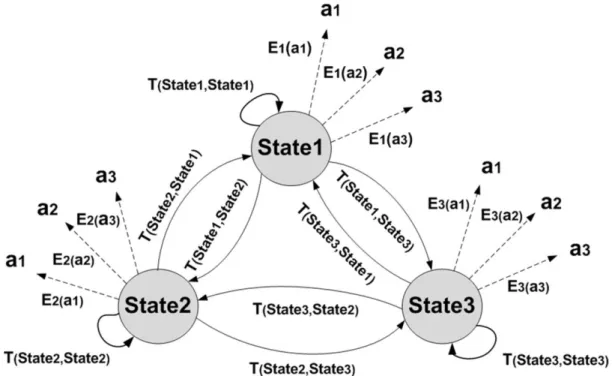
Figure 5 illustrates an example of the relationships between hidden states, observations as well as transition matrix T, and emission matrix Ein an HMM. For instance,
3 2
(State State, )
T represents the transition probability from State3 to State2 and E3( )a2 represents the emission probability of observation a2 in the state State3. As mentioned earlier in MMM, the observations represent the users' activities and the hidden states represent users' strategies. Henceforth in this work, the activities and the strategies are used instead of
observations and hidden states, respectively.
Estimating the Model Parameters
As discussed in the previous section, MMM highly relies on the emission matrix E and the transition matrix Tto respectively characterize the occurrence of activities in each strategy and the transition probabilities from one strategy to another. For these reasons, it is extremely important that these two matrices precisely match the process under study. Therefore, it is essential to choose a learning approach to estimate the model parameters ( = {T and E}) which fit the process model optimally. Estimating the parameters of an HMM depends on the learning approach. There are two learning approaches for estimating these matrices:
Supervised or Unsupervised learning. These approaches, their conditions of use as well as their respective performances are discussed in (Khodabandelou et al., 2014a) (Khodabandelou et al., 2014b) (Khodabandelou , 2014c) (Khodabandelou et al., 2014d)(Deneckère et al., 2014). The results demonstrate that several issues hinder the application of supervised
learning in modeling humans' cognitive process, such as considerable humans' involvement in terms of data labeling, introducing inherent humans' biases and lack of accurate ground truth. Therefore, unsupervised learning offers better results than supervised learning to discover intentional process models (Maps). In this work, unsupervised learning will be explained in details and will be applied on a case study.
Unsupervised Learning
Unsupervised learning estimates the matrices E and T based only on traces of activities. Since there is no prior knowledge on the strategies set , this method is significantly less biased than supervised learning but the associated computational complexity is high. Figure 6 depicts an overview of unsupervised learning for Map Miner Method.
Figure 6. An overview of MMM using unsupervised learning.
The Baum-Welch algorithm (BWA) (Baum 1970) is the most commonly used algorithm in HMM framework to estimate the model parameters E and T. Given N observed sequences
probability of having these sequences generated by the HMM. More precisely, the BWA maximizes the likelihood of .
Indeed, a large number of intentions can produce the traces of activities that are observed. However, all these intentions do not have the same probability to produce the observed traces. Thus, the challenge is to find the intentions that maximizes the probability to produce the observed traces. The Baum-Welch algorithm is the key for solving this challenge. Precisely, given a set of observed activities, it outputs the parameters of an HMM that is the most likely to have produced the observed activities.
BWA uses the Expectation Maximization (EM) algorithm (Dempster, 1977). The aim of the EM algorithm is to estimate the Maximum-Likelihood Estimation or maximum a posteriori of the statistical models (with latent variables) parameters in an iterative way. The EM algorithm consists in two steps that alternate between an expectation (E-Step) and a maximization step (M-step). Through an iterative procedure, it is proven that BWA converges to a local
optimum (Rabiner, 1986). This property ensures that the parameters found by the BWA are locally the parameters with the highest probability of generating the observed activities.
Conditions of Use:
For unsupervised learning, the required knowledge includes the set of activities , some traces of activities
a1,,aL
and the cardinality of the set | |, i.e., the number of possible strategies. Regarding strategies, neither the set nor some traces of strategies
s1,,sL
should be known, only the number of possible strategies is required. This parameter can be chosen by experts (e.g. as a way to set the level of complexity of the model) or can be set with techniques as BIC (Burnham 2002). Similarly to supervised learning, this choice introduces a bias, but given that only the number of strategies is set and not the strategies themselves, this bias is less important. The advantage of unsupervised learning is being applicable on traces comprising only activities traces and there is no need to have strategies traces, contrarily to supervised learning.
Performance:
Given a trace made of Nobserved sequences of activities
a1,,aL
, the BWA finds the HMM matrices E and T that locally maximize the probability of having these sequences generated by the HMM. More precisely, the BWA maximizes the likelihood of E and T:
,
1 , arg max Pr | , N n n E T
E T a E T (1.5)As it is mentioned earlier, the number of strategies is required to know the dimensions of matrices E and T since the BWA cannot run without E and T being initialized.
What is interesting to note here is the fact the likelihood is not maximized depending on some traces of strategies s1,,sN, as it was the case for supervised learning. It means that the space
in which the likelihood is maximized is larger than the space for supervised learning. As a consequence,
, , 1 1 max Pr | , max Pr | , , N N n n n n n
E T a E T E T a s E T . (1.6)In other words, the maximum likelihood of unsupervised learning is always higher than the maximum likelihood obtained by supervised learning since the latter comes from a
constrained space. Unfortunately, the BWA cannot guaranty to converge to the global maximum likelihood since it is only proved to converge to a local optimum (Rabiner, 1989). The limit of convergence depends on the initialization of the matrices E and T and it is
verified by experimental results (see Khodabandelou, 2014c), that a simple initialization of E and T leads to a maximum likelihood of unsupervised learning higher than supervised
learning.
Determining the Number of Strategies
The BWA requires the sets and to be known or at least, their cardinality, i.e. | | and | | for the algorithm to run. Regarding the set of activities , it can simply be obtained by identifying the different activities in the trace. However, obtaining the set of strategies is impossible since there is no information about strategies in the trace. There are several ways to obtain the number of strategies (Khodabandelou, 2014c). The method that is used in this work to set the right number of strategies is heuristic. It consists in generating several HMM models with different numbers of strategies and observing the associated emission matrices. It occurs that as the number of possible strategies increases, the number of different strategies obtained in the emission matrices reaches a threshold. It means that when the number of possible strategies is too high, the BWA produces an emission matrix with several identical strategies. Consequently, to set the right number of strategies of the model, this observed threshold is chosen. This method has the advantage of being adaptable for different traces. The drawback of this method is its computation complexity.
Developing Deep Miner Algorithm
Once the strategies are estimated, a pseudo-Map process model can be extracted from these matrices generated by the BWA. This can be realized by Deep Miner algorithm that was especially developed to construct the sections of Map process model out of the transition matrix. However, the question of measuring the quality of this Map remains.
We recall that the matrices generated by the BWA are:
An emission matrix E, giving the probabilities of generating any activity while performing a strategy. In other words, for any strategy s , it gives the activities the strategy is composed of.
A transition matrix T, giving the probabilities of transition between any couple of strategies ( , )s s 2.
Clearly, there is a strong link between the transition matrix and the topology of the Map process model to be extracted. However, in the general case, it is a difficult task to manually extract a Map from a transition matrix while verifying the two following constraints: (i) any transition between the strategies in the transition matrix should be possible in the Map, (ii) any transition between the strategies in the Map should be possible in the transition matrix. The first constraint can be seen as a criterion for fitness since it ensures that all the transitions learned from the trace are present in the Map. The second constraint corresponds to a criterion of precision since it aims at avoiding introducing extra transitions in the Map that are not learned from the trace. Our goal is to find the Map that best satisfies both of them.
Additionally, transitions probabilities in Thave different values according to their respective importance for the model. This means that some transitions are more important than others and in consequence, the fitness and the precision are also more important for these transitions. In the next part, a metric is defined which is a trade-off between fitness and precision and also captures the relative importance of transitions.
Proposed Metrics of Fitness and Precision
The topology of a Map
m
can be defined by the set of its sections, each one comprising a source sub-intention, a strategy and a target sub-intention. It can be formally written as:{1, , }
(mk k) K ,
m
where k denotes the index of a section and Kis the total number of sections of the Map. For each k {1, ,K}, mk ( , , )i j s . The component mk(1) is the source sub-intention of section k, mk(2) is the target sub-intention, and mk(3) is the strategy of section k . On
the Map
m
, a transition from strategy s to strategy s' is possible if and only if there exist 2( , ) {1,k k , }K such that mk(3)s, mk(3)s, and mk(2)mk(1). In the following, the
symbol
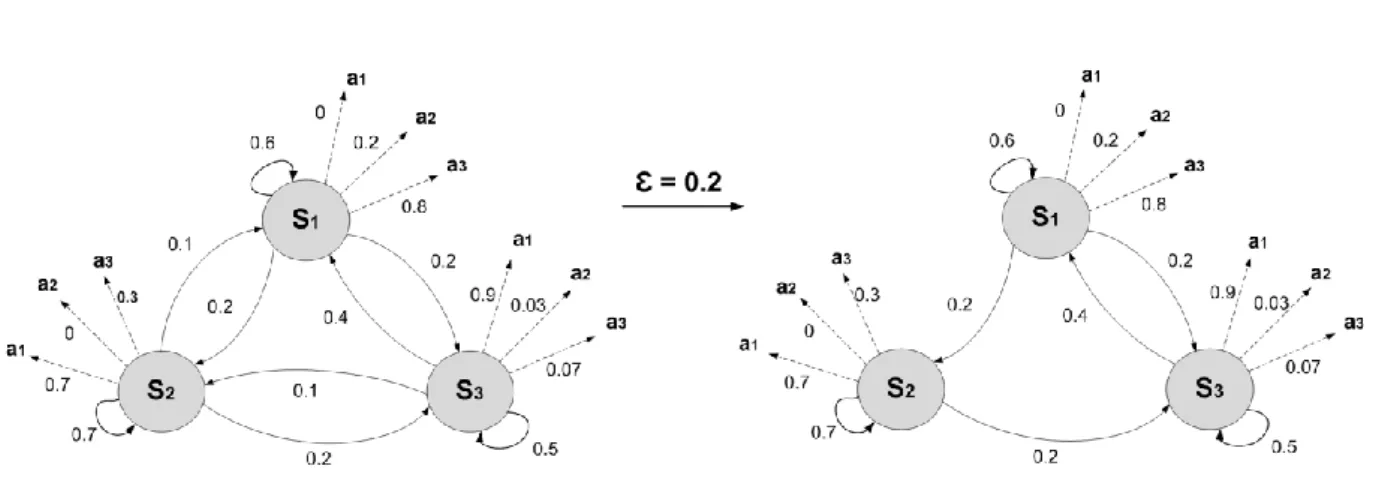
is used to denote if a transition is possible or not in the Map: 2 , 1 if ( , ) {1, , } such that (3) , (3) , and (2) (1), 0 otherwise. k s s k k k k k K m s m s m m In the transition matrix T, the only valid transitions are considered with a probability above a given threshold
. The value of
has to be chosen heuristically, to counter the effects of noise and artifacts in the trace. Figure 7 depicts an example showing the effect of threshold (
=0.2) before and after applying it on the transition matrix. As shown on the right part of the figure, all the transitions lower than 0.2 are eliminated. Therefore, according to the value of
, Deep Miner takes into account certain transitions. This can be defined as follows:, 1 if ( , ) , 0 if ( , ) . s s s s s s T T
Classically, the criteria of fitness and precision between T and m can be expressed by the expressions known as recall and precision. In our context, these two expressions are defined as: , , , , , , , , , , Rec( , ) , Pre( , ) . s s s s s s s s s s s s s s s s s s s s
T m T m (1.7)The numerator of both expressions is the number of significant transitions in T that are present on the Map m, while the denominators are the number of significant transitions in T
Figure 7. The effect of applying the threshold (
) on the transition matrix.and the number of transitions on
m
, respectively. Since our goal is to find a Map that fits best the transition matrix with respect to both recall and precision, the classical F-measure can be used, which expression is:1 Pre( , )Rec( , ) ( , ) 2 . Pre( , ) Rec( , ) F T m T m T m T m T m (1.8) Optimization problem
Once the proper metric has been defined, a Map that maximizes this metric must be found. The solution of this problem belongs to the set
1
arg max F( , ).
m T m (1.9)
Since the goal is obtaining a Map with the simplest structure, the solution with the lowest number of sections is chosen. In other words, the solution is
*
arg min | |,
m
m m (1.10)
where |m| stands for the number of sections in |m|. However, finding *
m is a difficult task since
m
generally belongs to a high-dimension space. Indeed, it can be shown that there are2
| |
2
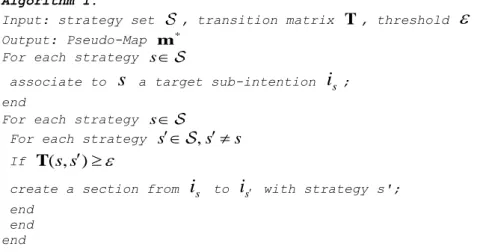
possible Maps for | | different strategies. Consequently, computing all the possible Maps with a brute force method then comparing their F-measures is not an option. Instead, an algorithm is developed that solves (1.10) with a complexity bounded by | | *(| | 1) . This algorithm is detailed below. The first part of algorithm 1 associates a target sub-intention to each strategy of . In the second part, if a transition probability from strategysto strategys'is above the threshold
, a section is added to the Map from the target sub-intention of s' tothe target sub-intention of s. This section ensures that the transition given by T is also present in the Map.
Algorithm 1.
Input: strategy set , transition matrix T, threshold
Output: Pseudo-Map m*For each strategy s
associate to s a target sub-intention is; end
For each strategy s
For each strategy s ,ss
If T( , )s s
create a section from is to is with strategy s'; end
end end
With this algorithm, recall and precision, defined in (1.7), have the advantage of being equal to 1. Indeed, ε defines the granularity of the Map. When
is close to 0, almost all the transitions from the unsupervised model are present in the obtained Map. Consequently, the likelihood of the obtained Map is high but the Map is hardly understandable by humans since it has too many sections. However, when
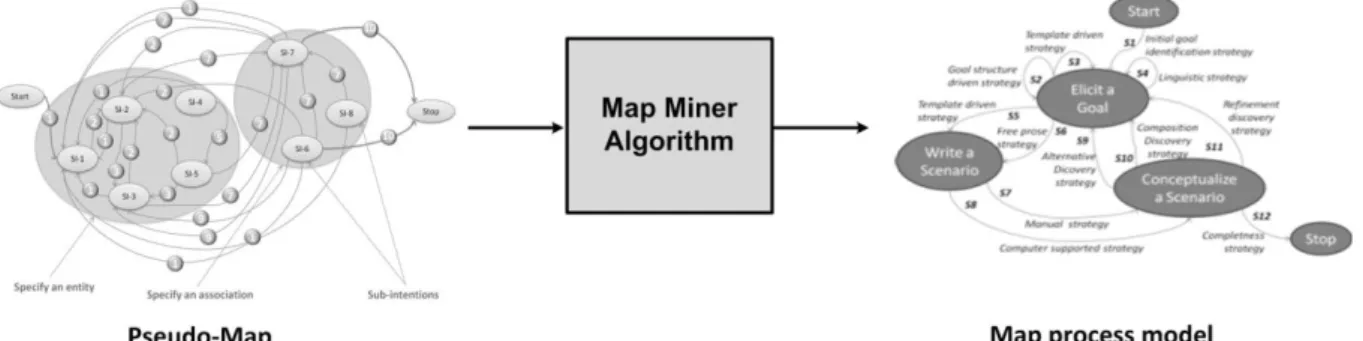
increases, the number of sections, as well as the likelihood of the obtained Map, decrease. The Map gets more easily understandable by humans but it is not as accurate in terms of transition. Figure 8 depicts an overview of the Deep Miner algorithm. Its input are the estimated strategies and its output is a pseudo-Map.Figure 8. Overview of Deep Miner Algorithm.
Developing Map Miner Algorithm
Granularity refers to the level of detail of a process model. While a Map process model with a coarse-grained granularity represents intentions with a high-level of abstraction (e.g.
organizational intentions), a Map process model with a fine-grained granularity, called a pseudo-Map, provides intentions with a low-level of abstraction , called sub-intentions.
Determining the Level of Abstraction for the Intentions
Given that the pseudo-Map obtained from Deep Miner algorithm has a high degree of granularity (in terms of sub-intentions and sections), it can be useful to extract some
higher-level Maps of the same process from this pseudo-Map. An algorithm has been developed to automatically perform this task and is presented in this section. It falls into three main parts: 1. The sub-intentions from the pseudo-Map are represented in a space in which they can be
classified into clusters.
2. A clustering algorithm, namely K-means (Hartigan et al., 1979), is applied on the sub-intentions in order to group them into clusters of sub-intentions. This allows determining the level of abstraction for the intentions. Note that the number of intentions is a parameter that has to be chosen. The choice of this parameter allows researchers obtaining Maps with different levels of granularity.
3. Finally, a Map process model is rebuilt from the new groups of intentions with updated sections.
Figure 9 represents an overview of Map Miner Algorithm.
Figure 9. Overview of Map Miner Algorithm.
Sub-intentions Representation in a Space
Before clustering intentions into groups of intentions, we need to represent each sub-intention in a space that trustfully accounts for the topology around the sub-sub-intention in the pseudo-Map. Given that each sub-intention is connected to other sub-intentions by strategies, a proper way to represent sub-intentions is to indicate to which other sub-intentions it is connected. Since the Map is an oriented graph, a difference is made between sub-intentions from which there is a strategy going to the sub-intention to be represented and sub-intentions that can be fulfilled with strategies from the sub-intention to be represented.
From a formal perspective, let us consider a pseudo-Map with Nintentions. The sub-intention in is represented by a vector vn in a space of dimension 2N such that the first N
coefficients correspond to the sub-intentions from which there is a strategy going to in, and the final N coefficients correspond to the sub-intentions that can be fulfilled from in.
For all n[1,N], if there is a section from in to in then v nn( ) 1 , otherwise v nn( ) 0 For all n[1,N], if there is a section from in to in then vn(2 ) 1n , otherwise vn(2 ) 0n
Since in is implicitly considered to be connected to itself, then v nn( ) 1 and vn(2 ) 1n
With this representation, two sub-intentions connected to similar sub-intentions will be represented with a short distance between them, while two sub-intentions connected to
different sub-intentions will be represented with an important distance between them. This way, the clustering algorithm that is applied on the sub-intentions can group sub-intentions efficiently.
Clustering sub-intentions into high-level intentions
Once the sub-intentions are represented in the space, a clustering algorithm can be applied to group them into clusters of intentions. In this work, the K-means (Hartigan, 1979) algorithm is applied to perform this task. This algorithm works as the following way: given a numberK
of clusters and a set of points
[1, ]n n N
v , the algorithm determines the gravity center ck of each cluster k, such that the sum of the distances from the points to the center of their cluster
is minimized. In other words, it minimizes the sum,
1: , ( ) , n n N d v c v
(1.11)where c v( )n is the center of gravity which is the closest to vn. For example, if vnis closer to k
c , c v( )n ck. And d(.,.) is a distance between two points. Said in another way, the K-means
algorithm finds K groups of sub-intentions such that in each group, sub-intentions are in a same area of the Map process model. The mapping between the sub-intentions and the intentions is called g, such that g n( )is the intention of sub-intentionn.
Rebuilding the Map
To obtain a new Map from the clusters of intentions, all the previous sub-intentions are replaced by the intention of their group. The sections also need to be updated to take into account the simplified topology of the Map. We recall that the pseudo-Map discovered by the Deep Miner algorithm is denoted by m*. Note that the identical sections have to be removed
from the discovered Map. Algorithm 2 shows how to rebuild a Map process model from K
clusters of intentions given that the mapping from sub-intentions to intentions obtained from K-means is denoted by g.
Algorithm 2.
Input: Map m*, mapping g
Output: Map m
For each section mu*, u[1,U]
*
(1) : (1) u u m g m
*
(2) : (2) u u m g m endRemove identical sections in m
For applying MMM on real dataset, one needs to adjust some parameters: threshold to compromise between the accuracy of the model and its complexity, number of strategies to determine how many strategies the model could generate and number of high-level intentions to determine how many high-level intentions the final Map process model should generate. We note that these parameters can also be obtained heuristically.
CASE STUDY: USAGE DATA COLLECTOR OF ECLIPSE
Presentation of the Case Study
This case study demonstrates the capability of MMM to handle the large-scale data along with providing comprehensive and reliable results. Eclipse Usage Data Collector (UDC) (Eclipse, 2013) is a system which collects information about how developers use the Eclipse platform. The Eclipse Foundation provides these data to help committers and organizations to better understand how the community makes use of Eclipse (UDC, 2013). In this perspective, this case study aims at modeling the UDC developers' activities in terms of intentions and strategies by constructing automatically a Map process model that is actually followed by developers. The discovered Map process model is useful to analyze developers' behaviors (see 5.1.3).
Usage Data Collector Event logs
The event logs of this case study are event logs of developers who committed their activities to Usage Data Collector (UDC) of Eclipse (Eclipse, 2013). The event logs are uploaded to servers hosted by the Eclipse Foundation. The event logs contain 1, 048, 576 event logs from developers who agreed to send their data back to the Eclipse Foundation. These data
aggregate activities from over 10, 000 Java developers between September 2009 and January 2010. The activities are recorded by timestamps for each developer, which allows knowing when and by whom activities were committed.
Developers' Activities
In order to apply MMM, it is important to prepare the traces. The number of unique developers' activities per month exceeds 500 activities. This number contains both the recurring activities and the non-recurring activities (i.e., activities which are not frequently performed by developers). The non-recurring activities are not representative of the
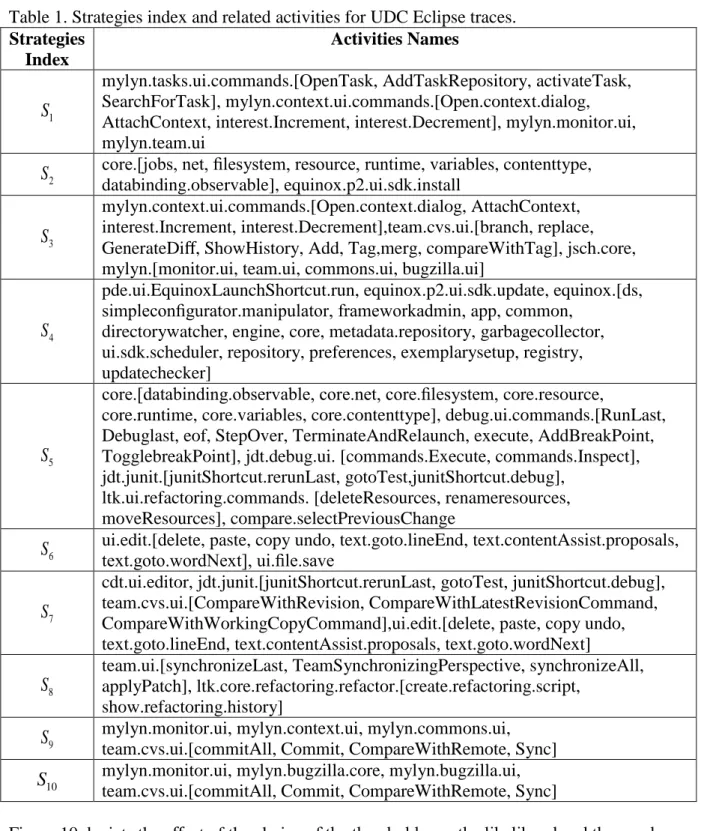
developers' behavior characteristics because they have not been repeated enough to be a behavioral-pattern. For this reason, and also for readability, the case study is limited to the 130 most frequent activities performed by developers. Table 1 contains the list of these activities. Some of these activities are the commands performed directly by developers; some of them are the frameworks, plug-ins or built-in features of Eclipse used by developers during their development process. For readability reasons, the prefix org.eclipse of the activities is removed. The plug-ins and frameworks are shown in bold letters and the related activities are inside brackets.
Applying MMM on the Traces
Once the trace is ready, BWA estimates the transition matrix (developers' strategies). Note that, once again the number of strategies obtained by the heuristic method for this case study is 10. The strategies are represented in Table 1 with their corresponding groups of activities.
Table 1. Strategies index and related activities for UDC Eclipse traces. Strategies Index Activities Names 1 S
mylyn.tasks.ui.commands.[OpenTask, AddTaskRepository, activateTask, SearchForTask], mylyn.context.ui.commands.[Open.context.dialog, AttachContext, interest.Increment, interest.Decrement], mylyn.monitor.ui, mylyn.team.ui
2
S core.[jobs, net, filesystem, resource, runtime, variables, contenttype, databinding.observable], equinox.p2.ui.sdk.install
3 S
mylyn.context.ui.commands.[Open.context.dialog, AttachContext, interest.Increment, interest.Decrement],team.cvs.ui.[branch, replace, GenerateDiff, ShowHistory, Add, Tag,merg, compareWithTag], jsch.core, mylyn.[monitor.ui, team.ui, commons.ui, bugzilla.ui]
4 S
pde.ui.EquinoxLaunchShortcut.run, equinox.p2.ui.sdk.update, equinox.[ds, simpleconfigurator.manipulator, frameworkadmin, app, common,
directorywatcher, engine, core, metadata.repository, garbagecollector, ui.sdk.scheduler, repository, preferences, exemplarysetup, registry, updatechecker]
5 S
core.[databinding.observable, core.net, core.filesystem, core.resource,
core.runtime, core.variables, core.contenttype], debug.ui.commands.[RunLast, Debuglast, eof, StepOver, TerminateAndRelaunch, execute, AddBreakPoint, TogglebreakPoint], jdt.debug.ui. [commands.Execute, commands.Inspect], jdt.junit.[junitShortcut.rerunLast, gotoTest,junitShortcut.debug],
ltk.ui.refactoring.commands. [deleteResources, renameresources, moveResources], compare.selectPreviousChange
6
S ui.edit.[delete, paste, copy undo, text.goto.lineEnd, text.contentAssist.proposals, text.goto.wordNext], ui.file.save
7 S
cdt.ui.editor, jdt.junit.[junitShortcut.rerunLast, gotoTest, junitShortcut.debug], team.cvs.ui.[CompareWithRevision, CompareWithLatestRevisionCommand, CompareWithWorkingCopyCommand],ui.edit.[delete, paste, copy undo, text.goto.lineEnd, text.contentAssist.proposals, text.goto.wordNext] 8
S
team.ui.[synchronizeLast, TeamSynchronizingPerspective, synchronizeAll, applyPatch], ltk.core.refactoring.refactor.[create.refactoring.script,
show.refactoring.history] 9
S mylyn.monitor.ui, mylyn.context.ui, mylyn.commons.ui, team.cvs.ui.[commitAll, Commit, CompareWithRemote, Sync] 10
S mylyn.monitor.ui, mylyn.bugzilla.core, mylyn.bugzilla.ui, team.cvs.ui.[commitAll, Commit, CompareWithRemote, Sync]
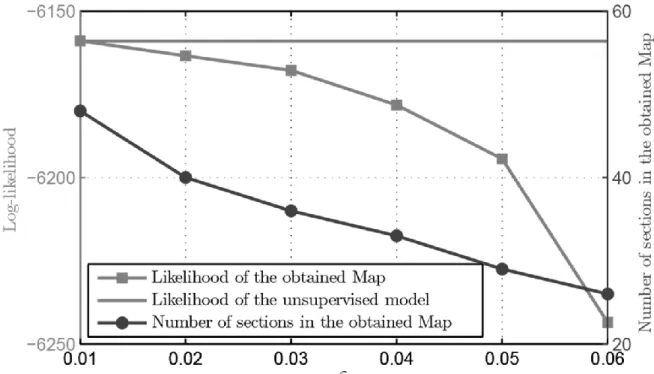
Figure 10 depicts the effect of the choice of the threshold ε on the likelihood and the number of sections of the obtained Map. As mentioned earlier the sub-section of Developing Deep Miner Algorithm, ε expresses the level of granularity for a Map. An expert can choose the value of ε regarding the expected level of granularity. In this case study, the value of ε is set to 0.06 to have a good trade-off between having a likelihood with a relative high value and a reasonable number of sections.
Figure 10. Likelihood and Number of sections of the Discovered Map with respect to
for the Eclipse Traces.Finally, the Pseudo-Map obtained by Deep Miner is shown in Figure 11. Figure 12 presents the Map process model obtained by Map Miner algorithm with manual inference of the labels of intentions and strategies.
Figure 12. The obtained Map process model for Eclipse UDC by MMM with manual labeling.
Regarding the obtained Map, 22 sub-intentions are grouped by Map Miner algorithm into 7 groups of high-level intentions. Note that MMM can discover accurately the beginning and the end of a process; thus the intentions Start and Stop are clearly determined on the obtained Map. The transition probabilities from one intention to another are annotated on the strategies (the edges). These values correspond to the probabilities that the developers selected a
strategy from a given intention. The values on the reflexive strategies indicate the probabilities that the developers enacted the process having in mind the same intention.
Strategies and Intentions Naming Procedure
MMM discovers the strategies that lead to intentions. In other words, MMM reconstructs the topology of the Map process model from traces; the names of the strategies and intentions are not fully automatically generated. Nevertheless, it is possible to infer the names of strategies and intentions from the emission matrix E. Indeed, Especifies the activities associated to each strategy discovered by the MMM (see Table 1). Therefore, based on the names of the activities grouped into a strategy, it is possible to manually infer the names of the strategies through a semantic analysis of their properties and interrelationships. In the same way, since the strategies lead to intentions, the names of intentions can be inferred by analyzing the strategies leading to each intention. For instance, the main activities grouped into the strategy
5
S are 'refactoring.commands', 'jdt.junit', 'debug.ui.commands', etc. From these activities one can infer the developers wanted to debug, to refactor and to test the code; thus, the name
inferred for this strategy is ‘by refactoring, testing and debugging’. Further, the main activities for strategyS6are 'delete', 'paste', 'copy', 'undo', etc. This means the developers wanted to modify a code or a file; the name inferred for this strategy is ‘by file modification’. Since both strategies lead to an intention, it is possible to infer that the developers who performed S5 and
6
S intended to Fix a bug. By applying this procedure, the names of all strategies (denoted on the edges) and intentions are inferred. Table 2 presents the topics obtained by E and the inferred strategies names. The inferred names of intentions are Start, Initiate the development, Manage tasks, Fix a bug, Improve the code, Commit the code. This naming protocol remains to be fully automated by building sophisticated ontologies.
Table 2. Strategies index, topics and inferred strategies names for UDC Eclipse.
Strategies Index
Topics Obtained by E Inferred Strategies Names
1 S
OpenTask, AddTaskRepository, activateTask, SearchForTask, Open.context.dialog, AttachContext, interest.Increment, interest.Decrement,
mylyn.monitor.ui, mylyn.team.ui
By project tracking and team Planning
2 S
jobs, net, filesystem, resource, runtime, variables, contenttype, databinding.observable, equinox.p2.ui.sdk.install By regular programming activities 3 S
Open.context.dialog, AttachContext, interest.Increment, interest.Decrement, branch, replace, GenerateDiff, ShowHistory, Add, Tag,merg, compareWithTag, jsch.core, monitor.ui, team.ui, commons.ui, bugzilla.ui
By code/tasks sharing
4 S
pde.ui.EquinoxLaunchShortcut.run, ds,
simpleconfigurator.manipulator, frameworkadmin, app, common, directorywatcher, engine, core,
metadata.repository, garbagecollector, ui.sdk.scheduler, repository, preferences, exemplarysetup, registry, updatechecker
By OSGI-based design
5 S
databinding.observable, core.net, core.filesystem, core.resource, core.runtime, core.variables,
core.contenttype, RunLast, Debuglast, eof, StepOver, TerminateAndRelaunch, execute, AddBreakPoint, TogglebreakPoint, commands.Execute, commands.Inspect, junitShortcut.rerunLast, gotoTest,junitShortcut.debug, deleteResources, renameresources, moveResources, compare.selectPreviousChange By refactoring, testing and debugging 6 S
delete, paste, copy undo, text.goto.lineEnd, text.contentAssist.proposals, text.goto.wordNext, ui.file.save
By file modification
7 S
junitShortcut.rerunLast, gotoTest, junitShortcut.debug, CompareWithRevision,
CompareWithLatestRevisionCommand,
CompareWithWorking, CopyCommand,delete, paste, copy undo, text.goto.lineEnd, text.goto.wordNext text.contentAssist.proposals
By reviewing and testing
8 S synchronizeLast, TeamSynchronizingPerspective, synchronizeAll, applyPatch, create.refactoring.script,show.refactoring.history By patch applying 9
S mylyn.monitor.ui, mylyn.context.ui, mylyn.commons.ui,
commitAll, Commit, CompareWithRemote, Sync By CVS committing 10
S
mylyn.monitor.ui, mylyn.bugzilla.core, mylyn.bugzilla.ui, commitAll, Commit, CompareWithRemote, Sync
By updating issues tracking
Analysis of Eclipse Developers' Behavior
Discovering the Map for developers of Eclipse UDC allows understanding the developers' behaviors during the development process. As shown in Figure 12, they selected different paths (sequences of strategies) with different probabilities to fulfill their intentions. An expert can analyze these behaviors in order to understand how, why and with which probabilities developers make use of different components or plug-ins of Eclipse: where they follow the best practice of software development projects and where they deviate from these rules, which components or plug-ins are more involved than others, which paths are more/less taken or where are the system problems, etc. The Map can also be used to provide recommendations to developers in order to choose the best path to fulfill their intentions. In this case study, there is no prior model to compare with the obtained Map. Hereafter, some observations are detailed to address some of the aforementioned claims in practice.
Observation 1. The developers' activities involve the usage of frameworks and plug-ins such
as Mylyn, Equinox, team/CVS, Junit, built-in features of Eclipse such as Eclipse Core, Debug and API such as ltk (Language Toolkit). Figure 13 depicts the usage probabilities of these frameworks in each strategy. It is possible to observe the usage frequency of each
framework/plugin/tools among the strategies. For instance, Mylyn framework is used in 4 strategies amongst 10 and its usage probabilities for strategy S1is 1 whereas for strategy S5 it is 0. These values help detecting if any of these frameworks or tools is underused. For
instance, one observation is that the refactoring tool ltk is underused since it has a low usage probability (see also observation 4).
Observation 2. The developers who start a development process choose one of the 4 first
strategies i.e. S1, S2, S7, S9. If they already have an ongoing program at hand, they tend to adopt either strategy S7: by reviewing and testing to Improve the code or strategy S9: by CVS committing to Commit the code. On the other hand, the developers who start a new
development choose either the strategy S2: by regular programming activities to Initiate the development or choose strategy S1: by project tracking and team planning to Manage tasks with probability 0.39 and 0.12 respectively. This observation suggests that the developers of this case study tend to start programming by building first the baselines for software
architecture through dividing the programs into different modules/packages using OSGI-based design. After decomposing the software into sub-modules, the developers apply strategy S3: by code/task sharing which involves mainly Mylyn framework (described in observation 3) which can be integrated with the Bugzilla bugtracker system and issue system. Therefore, tasks and the content of these tasks can be shared among developers. The high transition probability of this strategy means the developers tend to share code/task in order to fulfill Manage tasks.
Figure 13. Usage probabilities of different Eclipse elements for each strategy.
Observation 3. The developers who have the intention to ‘Manage tasks’ choose strategies
S1 and S3. Regarding Table 1, the activities related to these strategies involve Mylyn framework which is the task and application life-cycle management (ALM) framework for Eclipse. It helps the developers to work efficiently with many different tasks such as bugs, problem reports or new features. It monitors users' activities and preserve the context of the task-at-hand to focus the Eclipse UI on the related information. For instance, while working on a current task, if the developers have to work on another task, e.g. an occurred bug, Mylyn preserves the context of the current task. Thus, the developers can work on another task without losing the context of the previous task. This procedure is discovered in the obtained Map of Eclipse. The activities of the developers while they Manage tasks are interrupted (e.g., for an urgent bug) and they choose strategy S5to Fix a bug. To switch to the previous task, they first commit and report the bug then they continue managing tasks. This means the Mylyn framework has reliable and relevant functionalities for developers and it is not underused since they work with it 47% (transition probability of 0.47) of their time and they use it frequently (Figure 13).
Observation 4. When the activities of the developers during Manage tasks are interrupted,
they choose strategy S5to Fix a bug. The procedure of fixing a bug may involve refactoring existing code, writing unit tests, editing and modifying involved code and finally fixing the affected code. Strategy S5: by refactoring, testing and debugging represents this procedure. This strategy is defined as a best practice to fix a bug, which means the developers who adopt this strategy respect the guidelines of software development. However, they perform this strategy with a probability of 0.22 whereas they prefer to Fix a bug by file modification with a higher transition probability (0.33). Moreover, Figure 13 shows a low usage frequency and usage probability for ltk (Language Toolkit) which is an API for automated refactoring in