HAL Id: hal-03007441
https://hal.archives-ouvertes.fr/hal-03007441
Submitted on 3 Jan 2021HAL is a multi-disciplinary open access archive for the deposit and dissemination of sci-entific research documents, whether they are pub-lished or not. The documents may come from teaching and research institutions in France or abroad, or from public or private research centers.
L’archive ouverte pluridisciplinaire HAL, est destinée au dépôt et à la diffusion de documents scientifiques de niveau recherche, publiés ou non, émanant des établissements d’enseignement et de recherche français ou étrangers, des laboratoires publics ou privés.
Nonlinear Phase Imaging of Gold Nanoparticles
Embedded in Organic Thin Films
Marion Hurier, Maxime Wierez-Kien, Cecilia Mzayek, Bertrand Donnio,
Jean-Louis Gallani, Mircea Rastei
To cite this version:
Marion Hurier, Maxime Wierez-Kien, Cecilia Mzayek, Bertrand Donnio, Jean-Louis Gallani, et al.. Nonlinear Phase Imaging of Gold Nanoparticles Embedded in Organic Thin Films. Langmuir, Ameri-can Chemical Society, 2019, 35 (52), pp.16970-16977. �10.1021/acs.langmuir.9b02369�. �hal-03007441�
Nonlinear
Phase
Imaging
of
Gold
Nanoparticles Embedded in Organic Thin
Films
Marion A. Hurier, Maxime Wierez-Kien, Cecilia Mzayek, Bertrand Donnio, Jean-Louis Gallani, Mircea V. Rastei*
Cite this: Langmuir 2019, 35, 16970–16977
Publication Date:December 5, 2019
https://doi-org.scd-rproxy.u-strasbg.fr/10.1021/acs.langmuir.9b02369
Abstract
The phase detection in the dynamic mode of the atomic force microscopes is a known technique for mapping nanoscale surface heterogeneities. We present here an additional functionality of this technique, which allows high-resolution imaging of embedded inorganic nanoparticles with diameter and interparticle distances of a few nanometers. The method is based on a highly nonlinear tip–sample interaction occurring markedly above the nanoparticles, giving thus a high phase contrast between zones with and without nanoparticles. A relationship between the tip–sample interaction strength and the phase signal is established in experiments and from calculations conducted with the model developed by Haviland et al. [ Soft Matter 2016, 12, 619], which is based on solving a combined equation of motion for both the cantilever and surface while taking into account the time-varying interaction forces. The nonlinear phase behavior at the origin of the subnanometer spatial resolution is found by numerical analyses to be the result of a local mechanical stiffening of the zone containing nanoparticles, which is enhanced by 2 orders of magnitude or more.
Introduction
Many research fields require a simple technique for nondestructive subsurface imaging of inorganic nanoparticles.(1−4) In this respect, several advanced techniques based on
ultrasound(5−7) or heterodyne(8−10) force detection demonstrated exceptional lateral
resolution at the nanometer scale.(11,12) These techniques, implemented in some custom-built
atomic force microscopes, represent significant advancements in subsurface imaging and tomography, but their use by the broader community unfortunately is hindered by added/intrinsic complexity.(13) On the other hand, the possibility of measuring the phase of
the cantilever oscillation with respect to the excitation phase at a fixed driving frequency has been implemented very early(14−17) in all atomic force microscopes working in dynamic mode.
The phase shift method, which has been successfully used for imaging surface heterogeneities(18−20) or for a local measurement of conservative and dissipative nanoscale
forces,(21−24) has in turn the drawback of probing sample characteristics only in regions near
(Derjaguin, Muller and Toporov) model.(25) Moreover, the phase shift signals have
demonstrated large instabilities and fluctuations even for relatively weak surface heterogeneities.(26) Such unwanted phase instabilities are often caused by finite imaging
bandwidths of the cantilever sensor or intrinsically by cantilevers with low spring constants.(27,28) Indeed, looking beyond the force gradient approximation introduced by Mertz
et al.,(29) it was shown that the amplitude and phase signals may present discontinuities due
to nonlinear tip–surface interactions.(26,30,31) Since then, the phase shift was recognized as an
ample and stable imaging tool only for weak enough tip–sample interactions, which are distance dependent, that ensure a rather constant cantilever spring constant (linear response approximation). This is critical not only for amplitude-modulation (AM) imaging mode,(32−35) where the cantilever is externally driven at a constant excitation and frequency,
but also for frequency-modulation (FM) mode when the excitation frequency is permanently adjusted by an external electronic device or by changing the probe–sample distance.(14,26) The
situation is even more challenging when adhesion(36,37) and viscosity(37) are considered, their
effects being increasingly important when soft molecular surfaces are investigated.(38−40)
Molecular films containing metal nanoparticles are crucial for applications in fields such as optics, energy production and storage, microelectronics, information technologies, etc. The interesting aspect related to the use of organic matrices is the possibility they offer to preserve some of the intrinsic properties of the incorporated nanoparticles and, moreover, to specifically tune the overall material response through a controlled adjustment of the particle nature and interparticle separation.(41,42) Such functionalities can be achieved by modifying
the nature of the capping organic molecules which govern the growth of precise nanoparticle networks having various organizational structures and lattice constants.(43−45) Having the
possibility to easily and readily image and characterize these systems at the nanometer scale is of critical importance for checking the structure–property relationship. The fact that the nanoparticles are embedded in an organic matrix precludes or strongly hampers the use of techniques such as electron microscopy.
Here, we experimentally and numerically investigate the formation of AFM phase images on samples composed of gold nanoparticles (NPs) embedded in soft organic films, namely, Au NPs capped with oleylamine ligands. We evidence an abrupt transition from a linear to nonlinear tip–sample interaction, exploited here for subnanometer high-resolution imaging. Working in AM-AFM mode, we identify a set of oscillation and excitation amplitudes that permit a very fine-tuning of the tip–sample interaction. We reveal that small variations in the oscillation amplitude generate rapid and substantial amplifications of the phase-shift signal, triggered by nonlinear effects. A precise control of the excitation amplitude then allows one to image subsurface NPs, which are otherwise difficult to resolve in topographic images, demonstrating that the phase shift method in AM-AFM mode still has an imaging interest. This also works in vacuum conditions where the high oscillation quality factor of the cantilever significantly reduces the frequency bandwidth used for detection.
Experimental Details
The measurements were performed at atmospheric pressure and occasionally under high vacuum (10–6 Torr). Under vacuum conditions, the main conclusions of the study remain true,
although spatial resolution is sometimes increased because of the higher mechanical quality factor. Nevertheless, we choose to present here only results obtained under ambient conditions. The substrates used for sample deposition were silicon wafers covered with a 2–4 nm thick oxide layer. Some excess of organic ligands was removed by rinsing with ethanol and deionized water and N2 drying prior to imaging. We used a modified atomic force microscope
(Enviroscope) from Bruker, which is controlled by Nanoscope V electronics. An automatic gain control (AGC) was used to keep the oscillation amplitude of the cantilever at a fixed value. AFM probes of a spring constant of 40 N/m (resonant frequency of about 320 kHz) were employed; the tips were natively oxidized Si tips with an apex radius smaller than 10 nm. The samples were prepared outside the AFM microscope in ambient conditions and then transferred in the microscope.
The samples consisted of gold NPs incorporated in organic molecular films, as schematically shown for a single NP in Figure 1. The NPs have been chemically synthesized following the procedure of Peng et al.(46) The average diameter of the particles is 8.0 nm with a distribution
width of about ±1 nm. The particles are coated with oleylamine, a weak ligand that does not strongly bind to gold unlike, e.g. alkanethiols. There is a need of an excess ligand to be present in the diluted liquid suspension for stability reasons. These ligands are not bound to the NPs and have the possibility of assembling on the surface during the spin-coated deposition. As seen below, this excess of organic ligands in the deposition suspension induces the formation of molecular films, which hide the NPs below the surface. An exact value of the thickness of the molecular film is not easily measurable, as the spin coating does not produce abrupt deposition edges. The film structure appears rather isotropic without evidence of an inner molecular organization. A few intentional scratches made on the film revealed a molecular thickness varying from a few nanometers up to about 30 nm, depending on the exact sample area. As a consequence, the standard AFM tapping mode is unable to clearly distinguish the subsurface localization of NPs. It is worth noting that upon deposition on surfaces such a situation is encountered for most of the weakly bound organic ligands used for the synthesis and stabilization of the nanoparticles. The precise depth of the NP with respect to the molecular surface is hence difficult to evaluate. However, the oscillation amplitude variations, as well as the numerical calculations presented below, suggest that NPs are rather close to the film surface, conceivably in the first few nanometers.
Phase Signal Formation
In tapping mode, the AM-AFM operates by constantly driving the cantilever near its mechanical resonance. The cantilever holder–sample distance is adjusted so that, for each cantilever oscillation, the tip can enter in repulsive interaction with the sample surface (contact regime).(18,30) Depending on the cantilever/tip and surface elastic properties, the
is pushed back by the surface, as depicted in Figure 1. This mechanical reaction of the surface is more or less delayed with respect to the initial oscillation, depending on the local elastic properties of the probed zone. As a general rule, the stiffer the surface, the stronger and quicker is the surface back-action on the cantilever oscillation. This effect has been exploited for imaging the heterogeneity of the mechanical properties of the molecular surfaces, particularly when adhesion forces (attractive interactions) were small as compared with the cantilever restoring force (see eq 1 hereafter). This is because the oscillation amplitude is large enough to enable the tip to oscillate in both attractive and repulsive regimes. As depicted in Figure 1, an embedded metal NP is also expected to impact the surface back-action on the tip because of its inertial mass and viscosity within the organic film. We will see below that above the NPs the repulsive interactions increase significantly, inducing a transition toward nonlinear phase responses, an effect that depends on the oscillation amplitude. It is perhaps important to note that the technique presented here is at variance with the magnetic force microscopy performed on partially or fully embedded magnetic nanoparticles, where phase shifts are induced by the far longer-range magnetostatic interactions.(47−49)
Figure 1. Schematic view of amplitude and phase changes when a tapping tip passes above an inorganic nanoparticle embedded in a soft organic molecular film. Amplitude and phase changes are accompanied by displacements of the mechanical resonance frequency of the cantilever (not shown).
Results and Discussion
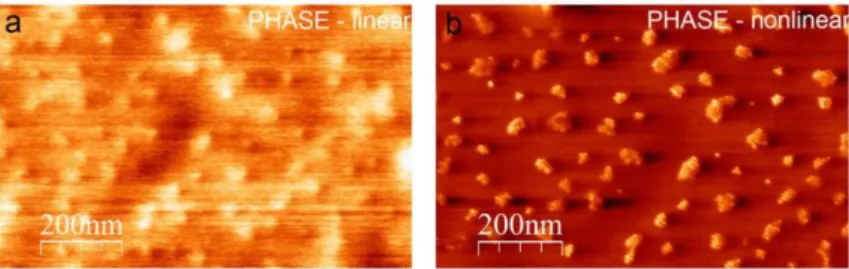
An example of a phase image in both linear and nonlinear regimes on the same surface area is shown in Figure 2. It can be seen that the phase image from Figure 2a shows only little information about the location and organization of the NPs. Instead, increasing the tip–surface interaction by reducing the amplitude set point translates into a significant and abrupt contrast enhancement. The phase stability is also notably ameliorated, meaning that the tip– surface interaction is more homogeneous from oscillation to oscillation. Importantly, the lateral spatial resolution is remarkably enhanced, allowing not only the localization of the NPs within the aggregates below the surface but also their organization and to some extent an estimation of the particle sizes.
Figure 2. Phase images (600 × 900 nm2) acquired in standard tapping mode over the same area
with the same tip. The excitation amplitude of the cantilever (drive amplitude DA) was 330 mV. The amplitude set point was 380 mV in (a) and 360 mV in (b). Between the two images, there is a transition from a linear to nonlinear phase response, which is induced here by reducing the oscillation amplitude set point.
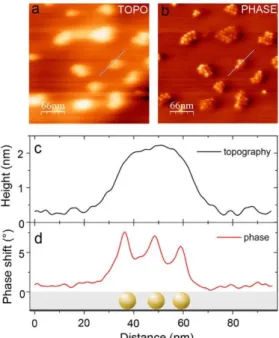
In order to gain insight into the enhancement mechanism of the spatial resolution in phase images, we show in Figure 3a a tapping mode image acquired simultaneously with the phase image from Figure 3b. As seen, the topographic image reveals only a few details about the subsurface NPs; it would be impossible to locate precisely the NPs within the organic film or to count them. On the contrary, this information is readily accessible in the corresponding phase image acquired in the nonlinear regime. It is nevertheless important to recall that in phase images quantitative spatial information is however available only in the surface plane (x,y plane) and not on the z-axis. As a consequence, phase images are particularly valuable for revealing interparticle distances and organization. The profiles shown in Figure 3c,d, traced along the small lines from (a) and (b), provide additional information, namely, that an aggregate of NPs is seen in the topographic image only as a small surface protrusion, which has a significantly lower height than a nanoparticle diameter, an effect induced by the molecular film.
The phase line profile in Figure 3d shows that interparticle distances as small as 10 nm can easily be resolved in phase images. The maximum achievable spatial resolution depends on the exact scanning parameters, but a simple estimation performed on areas containing individual embedded NPs or defects reveals a spatial resolution higher than one nanometer, as shown hereafter.
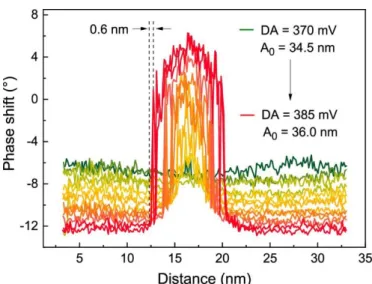
Along this line, we show in Figure 4 a series of four phase images acquired for increasing values of cantilever drive amplitude (DA). First, it is seen that upon changing the DA value by 10 mV (from 375 mV to 385 mV) that the phase signal is enhanced by about 20°. This expresses the large sensitivity of the phase response triggered by the nonlinear tip–surface interaction above the NP. Second, the image acquired at 385 mV shows a remarkable abrupt phase variation in less than a 1 nm lateral scan, which is relevant for estimating the lateral resolution. To emphasize even better the lateral resolution, we show in Figure 5 phase profiles for different DA values, corresponding to the horizontal scan above the center of the NP from Figure 4. Each profile corresponds to a DA value from 370 mV to 385 mV using a step of 1 mV. The oscillation amplitudes associated with the DA values are also indicated.
Figure 3. (a) Height (topographic) image (300 × 300 nm2) acquired simultaneously with the
phase image from (b). The lines are showing the location of the profiles from (c) and (d), respectively. (c) Height profile revealing the weak degree of the NP resolution. (d) Phase profile showing the increased lateral resolution with respect to the topographic data.
Figure 4. Phase images (18 × 18 nm2) recorded above an individual embedded NP recorded
for increasing values of drive amplitude (values in upper right corner). The images emphasize the lateral resolution and the high phase sensitivity near the linear to nonlinear transition.
At 370 mV and free oscillation amplitude (A0) of 34.5 nm, the phase signal remains around −6°
when scanning across the NP (Figure 5, green line). Upon increasing the DA toward 385 mV (A0 = 36 nm), the tip–surface interaction is gradually increased. At 385 mV (Figure 5, upper red
curve), the phase signal exhibits a sharp increase at the NP edge, which measures about 0.6 nm. The phase signal is still not saturated, presenting instead a roof-like shape at the center of the NP, which is expected if one considers a phase dynamics reflecting the local stiffness of a finite indented area defined by the size of the tip apex. Considering that the molecular film has an identical surface nature above and near the NP, adhesion effects can hardly explain such a behavior (Figure 5). On the contrary, an increase of the surface stiffness may induce an abrupt enhancement of the surface reaction when the tip starts scanning above the NP, as we will see quantitatively in the simulations section.
Figure 5. Phase profiles acquired across a single nanoparticle for different drive amplitudes near the linear to nonlinear transition.
The linear to nonlinear transition is conveniently revealed by plotting the evolution of the phase shift as a function of the variation of oscillation amplitude (Figure 6), where the zero value indicates the initial amplitude set point. If the tip–surface interaction (toward positive values of amplitude variation) is progressively increased, the phase signal switches to a nonlinear behavior when the tip is located above the NP, whereas it remains linear if the tip stays above the molecular organic film. The amplitude variation is calculated here as the difference between the initial free oscillation amplitude (the one chosen before to approach the tip) and the corresponding free oscillation amplitude that results from subsequent modifications of the DA value. The amplitude variation is consequently a good representation of the sign and magnitude of the tapping force, as quantitatively described in refs (27,30).
Figure 6. Phase shift evolution when approaching an individual subsurface NP. Each curve corresponds to a fixed lateral distance with respect to the center of the NP. The amplitude variation results from the change of the driving amplitude, which alters the tip–surface interaction and consequently the resonance oscillation frequency of the cantilever. Positive
amplitude variation values mean larger oscillation amplitudes. The thick dark-blue line is an average of all curves taken on the NPs, whereas the thick light-blue line is an average of the curves acquired on the organic film when approaching the NP.
Note however that, after the tip–surface approach, the oscillation amplitude at the drive frequency is reduced in our case to about 80% of the free oscillation amplitude because of the tip–surface interaction. This implies that for null or slightly negative amplitude variation (Figure 6), the tip is still oscillating in both repulsive and attractive regimes (once per period). In any case, the plot from Figure 6 noticeably highlights the fact that, as the tapping force is increased, the phase dynamics above the NP exhibits a linear to nonlinear transition. It is important to recall now that, from the point of view of phase dynamics, a negative phase shift means an averaged attractive interaction whereas a positive shift means a repulsive interaction. On the organic film, the attractive interaction monotonically increases when the cantilever amplitude is increased, suggesting a monotonic enhancement of the attractive force. On the NP, the behavior is similar up to an amplitude variation of about −0.2 nm, when the repulsive forces start compensating the attraction force. Thus, at an amplitude variation of 0.6 nm, the repulsive force dominates and the phase shift transforms into positive values. Per se, a nonlinear phase shift means that the phase response of the cantilever is not a linear function of the cantilever resonant frequency anymore. In other words, the phase of the cantilever oscillation does not change synchronously with the resonant frequency. Our automatic feedback loop adjusts the height of the cantilever holder in order to keep the amplitude constant. This means that the resonant frequency of the cantilever under the influence of the surface is not controlled. In any case, the nonlinearity observed on the NP in Figure 6 not only indicates that the phase presents a nonlinear behavior but also shows that the overall sign of the tip–surface interaction changed from attractive to repulsive.
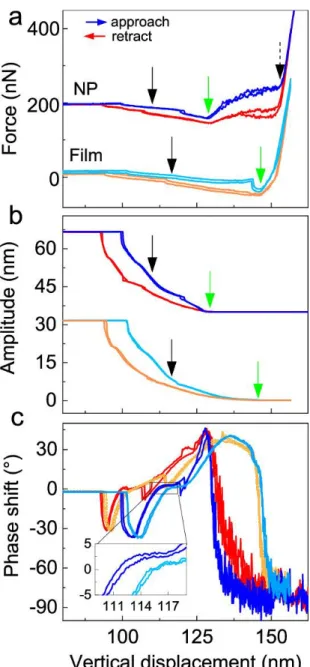
In order to better understand the tip–sample interaction, we show in Figure 7 approach– retract curves acquired above an embedded NP and over the organic layer. The force curves on the NP were vertically shifted for clarity. The first major difference between the two cases is observed in the approach force curves [Figure 7a]. As indicated by the green arrows, the total force acting on the tip changes the slope (repulsive forces start to dominate) at two different positions of the vertical displacement. Then, the repulsive force above the NP presents a rather smooth increase as can be seen between the green and black dashed arrows. This interval, where a repulsive interaction is progressively built up, is sensibly larger on the NP than on the organic layer. Afterward, the force follows a typical behavior of a tip in contact with a hard incompressible surface, which is likely the substrate surface; i.e. the slope of this last part is basically the spring constant of the cantilever. It is important to mention that the vertical displacement corresponds to the extension of the cantilever holder, which is not exactly the tip–apex displacement because of the cantilever deformation. The retract curves are reminiscent of the approach curves, although there is a clear hysteretic behavior (energy dissipation) in both cases, but it is slightly larger on the NP. The behavior seen in the force curves is confirmed by amplitude [Figure 7b] and phase [Figure 7c] signals acquired simultaneously with the curves from Figure 7a. The tip vertical positions where the phase
signal changes sign in the approach curves [inset to Figure 7c] are indicated by solid black arrows. The earlier sign reversal of the phase on the NP again indicates a stiffening above the NP. It is, however, worth noting that the amplitude and phase curves depicted in Figure 7 can only be used here as additional information on the variation of the interaction force as a function of distance and cannot be directly linked with the phase variation from Figure 6 where the drive amplitude was continuously changed. Nonetheless, the fact that the tip experiences an earlier repulsion regime on the NP than on the organic film is in agreement with the change of the sign of the phase shift in Figure 7, speaking indeed in the favor of a stiffer local area at the NP location, which is the main driving force for contrast formation in our images.
Figure 7. (a) Approach–retract force curves acquired on top of an embedded NP and on the organic film. (b, c) Corresponding amplitude and phase signals acquired simultaneously with the force curves. Force and amplitude data for the NP were vertically shifted for a better
visualization. The force signal was acquired by measuring the average deflection of the cantilever. The free oscillation amplitude was 32 nm. In each case, there are two consecutive approach–retract curves taken at the same location, revealing a good reversibility after the indentation process. Black arrows show tip vertical positions where the phase signal changes the sign, as seen in the inset (zoom) from (c). Green arrows show tip vertical positions where the oscillation amplitude vanished.
To further assess this larger stiffness induced by the presence of NPs, we numerically evaluated the phase dynamics of the cantilever by using a recent model developed by Haviland et al., which is based on solving the dynamics of the cantilever and of the surface by the following equations of motions:(40)
(1) (2)
where m is the mass of the AFM probe, z is the out-of-plane coordinate, ω0 is the cantilever’s
angular resonance frequency, and Q is the oscillation quality factor. In eq 2, ηs is the surface
damping (viscosity) and k is the mechanical stiffness. Equation 1 describes the dynamics of the cantilever under the influence of the surface forces Fts(s, ṡ). The instantaneous tip–surface
separation s is a function of s0, which is the tip–surface distance when the tip is at equilibrium,
and of velocity ṡ. Negative s values correspond to tip indentation into the surface. The distance s between the tip and surface is s = s0 + z – ds, where ds is the instantaneous tip–
surface separation, which partly changes because of the surface deformation.
The tip–surface interaction force Fts(s, ṡ) reads:(40)Fts(s, ṡ) = Fcon(s) – [ηiṡ]s<0, where Fcon(s) is the
conservative force and the second term represents the dissipative part of the interaction with ηi being the interaction viscosity, existing only when the tip is in noncontact with the surface.
Thus, the conservative force is(40)
(3)
for s > 0 and
(4)
for s < 0, i.e., when the tip indents the surface. In eqs 3 and 4, Fadh is the adhesion force at s =
0, R is the tip radius, a0 is the interatomic distance, and E* is the reduced Young modulus.
Using the above equations, we numerically evaluate the effect of different sample stiffnesses, i.e., various ks values. It is worth noting that a small tip radius R as used here triggers
deviations from standard models of contact mechanics,(50) because of nanoscale
elastocapillary effects.(51,52) These effects are intrinsically captured in the model described
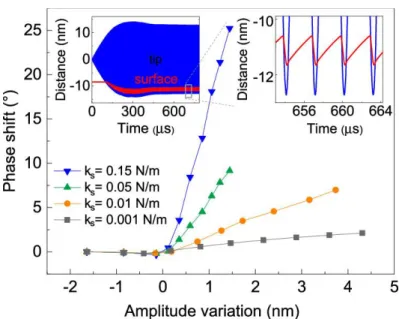
above.(40,38) The results shown in Figure 8 correspond to the simulated phase of the cantilever with respect to the driving phase, as also experimentally measured. The curves in Figure 8 are for various sample stiffness ks values, which were found by several numerical
tests to be able to approach the experimental results from Figure 6 (see blue curve for instance).
Figure 8. Simulated phase shift for increasing values of sample stiffness. The large phase variation for ks = 0.15 N/m shows a phase variation very close to the experimental results
for Figure 6. Insets are instantaneous cantilever and surface amplitudes.
For a rather soft sample (ks = 0.001 N/m), the cantilever phase is only slightly affected by the
presence of the sample. On the other hand, by progressively increasing ks to 0.15 N/m, the
phase signal becomes very similar to the one measured experimentally (Figure 7). In particular, it is seen that, in the first 1 nm of amplitude variation (starting from zero), the phase signal rises for the blue curve (ks = 0.15 N/m) up to about 12°, a value that can also be found
in the experimental phase variation in Figure 7. It is also worth noting that these stiffness values are representative for the whole local zone probed by the tip, as the film thickness as well as the localization of the NPs within the film are not parameters explicitly taken into account into the model. We can nevertheless conclude from our numerical analyzes that the presence of a NP enhances the sample stiffness by more than 2 orders of magnitude. In addition, our simulations reveal that the surface elastically recovers after each tip oscillation, although the full local relaxation is delayed as compared to the tip trajectory (see insets, Figure 8), which is expected for a cantilever with a spring constant far larger than the surface stiffness.
Since the first demonstration of phase imaging for resolving surface heterogeneity,(53) the
technique has been successfully exploited for various and very diverse purposes,(18,54,55) including for the imaging of embedded NPs.(56−59) We showed here that the
phase contrast of embedded NPs presents a nonlinear behavior as compared to the softer organic film. In other words, the phase sign does not change precisely at the new resonance frequency triggered by the tip–surface interaction, which is by definition a nonlinear behavior. As schematically shown in Figure 1, when the tip scans above a NP, the repulsive response of the sample is strong enough to push back the tip well before its oscillation is completed. This
significantly advances the oscillation phase with respect to the cantilever mechanical shaking, translated into a bright contrast (positive phase shifts) above the NP in phase images (see Figure 5). For weak tip–sample interactions, the phase changes are small, showing only weak and linear variations when the drive amplitude is increased. Despite these variations being small, they are nevertheless easily measurable by the microscope lock-in electronics. In general, for strong repulsive interactions, there can be two scenarios, depending on the tip size (adhesion scales with tip size) and, importantly, cantilever stiffness. To better describe the impact of these two parameters, let us first briefly recall the main differences between amplitude and phase variations when used for imaging. It is important to recognize that in AM-AFM tapping mode the amplitude modification of the cantilever is constantly surveyed by the feedback loop, which role is to keep the tip at the user-imposed set point value. This is achieved by a permanent readjustment of the cantilever holder–sample distance, providing the topography. The cantilever phase shift is expected to be driven by the amount of dissipation energy through inelastic tip–surface interactions,(18) which in turn depends on the
local probed area. The large phase variation measured above the NPs can therefore be linked to large modifications in the amount of energy transferred by the tip to the sample. It is also important to remark that the amplitude is measured by averaging over a time interval, which usually consists of at least hundreds of oscillation periods, whereas the phase signal can be measured a bit faster. As a matter of fact, the phase is generally used to recover the amplitude. This, along with the fact that the phase acquisition does not require the operation of the feedback loop, is why the lateral resolution in phase images is generally higher, but as shown all along this work, this is not the sole advantage.
In order to track the phase changes during scanning, it is necessary to have some degree of coherence between consecutive oscillations; although for the typical lateral-scan speeds used in standard AFM imaging (some hundreds of ms per scan line), there is enough time per pixel to average over thousands of oscillations. The more dissimilar the oscillations are, the less resolved is the pixel-to-pixel average value, translating in a poor spatial resolution. This effect strongly depends on cantilever stiffness and surface adhesion force. The surface adhesion force scales in turn with the tip–apex size, increasing in a quadratic way with the tip–apex radius. Surface adhesion thus impedes the tip, at each oscillation, to freely detach from the surface, therefore also being very relevant for phase changes, as seen in the eq 4 through the tip radius R. This interferes with the local out-of-plane surface stiffness and, consequently, with the molecular volume probed by the tip, which is different on zones with or without NPs. Now, let us consider that the surface adhesion is constant all over the surface, which in the case of deeply embedded NPs is a rather good approximation. Hence, as the surface is able to retain the tip attached until the potential energy of the cantilever oscillation breaks the contact, abrupt phase changes will appear, translating in strong phase variations or instabilities. Importantly, such a process is a statistical process, first because of the finite temperature and second because the tip–surface contact is not identical for each oscillation. In this last process, the surface relaxations, which depend on the surface viscosity, may also play a relevant role, as also quantified in the numerical simulations via ηs.
These last aspects are increasingly important when soft cantilevers are used, as they are less able to detach the tip from the surface as fast as the oscillation proceeds. Choosing the right cantilever stiffness is therefore a necessary condition for stable phase imaging. Coupling this requirement with the surface adhesion force previously discussed brings us to the conclusion that, the stronger the surface adhesion, the stronger the cantilever stiffness should be in order to avoid instabilities. It should also be remembered that this depends on the tip size, meaning that an initially sharp tip may provide good results and, progressively, as it becomes blunter, instabilities may appear, as very often encountered experimentally. These aspects are implicitly captured by the analytical model introduced by Haviland et al.(40) and used here to
reproduce our experimental results. The only free parameter in our case was the surface stiffness, which we find exalted by more than 2 orders of magnitude above an embedded NP. All the other parameters needed to solve the equations were considered known and kept constant.
As fundamentally pointed out in a recent work conducted by scanning thermal noise microscopy by Yao et al.,(59) the variation of surface stiffness and damping introduced by the
presence of embedded nanoparticles in a soft polymer is indeed a key ingredient for subsurface imaging, as our findings also revealed. Their method further brings additional understanding in the subsurface imaging mechanism, but it has the disadvantage of requiring extremely long acquisition times for one image (>5 h). This is because a thermal noise spectrum is needed for each pixel of the image and because the frequency resolution in a noise spectrum scales with the total acquisition time of the cantilever fluctuation. An interesting aspect of the technique presented in ref (59) is that it can easily be implemented
with techniques that involve a cantilever excitation, like the phase method presented here, in order to conduct point spectroscopy in a thermal noise regime at specific locations. This can be achieved by a temporary stopping of the cantilever excitation, i.e. the time to acquire a thermal noise spectrum. Such a combined technique would afford the possibility for one to obtain additional information otherwise hidden by spurious peaks and skewness induced by the nonlinear interactions.
Conclusion
We have shown that a conventional atomic force microscope can be conveniently set to image hard nanoparticulate structures embedded in a soft organic matrix, like oleyamine. A little tweaking of the scan parameters allows very good imaging of the sample with high lateral resolution, the only cost being the loss of precise measurement along the vertical direction to the surface. As an example, we have shown how the packing of 8 nm gold nanoparticles becomes clearly visible while the usual topographic image only returns blurred contours of the clusters. This technique allows the imaging of materials that would be hardly or more costly imaged by other microscopy techniques. Composite materials made of nanoparticles dispersed in polymer melts or small molecules are nowadays more and more present in research and technology, like in organic photocells, plasmonic materials, bioactive materials, and energy storage and production, to cite but a few. It is of obvious importance to be able to
probe the quality of the NP dispersion within the matrix, and the suggested procedure makes it quite easy to perform.
Notes
The authors declare no competing financial interest.
Acknowledgments
We thank N. Beyer for technical assistance. This work is supported by ANR METABIP (12 BS10 003 01), ANR OH-RISQUE SMARAGD (14 OHRI 0008 01), and EOARD (FA8655-13-1-3001) and partially by ANR-11-LABX-0058-NIE within the Investissement d’Avenir program ANR-10-IDEX-0002-02.
References
1. Krieg, M.; Fläschner, G.; Alsteens, D.; Gaub, B. M.; Roos, W. H.; Wuite, G. J. L.; Gaub, H. E.; Gerber, C.; Dufrêne, Y. F.; Müller, D. J. Atomic Force Microscopy-Based Mechanobiology. Nature Reviews Physics 2019, 1, 41, DOI: 10.1038/s42254-018-0001-7 [Crossref], Google Scholar
2. Behzadi, S.; Serpooshan, V.; Tao, W.; Hamaly, M. A.; Alkawareek, M. Y.; Dreaden, E. C.; Brown, D.; Alkilany, A. M.; Farokhzad, O. C.; Mahmoudi, M. Cellular Uptake of Nanoparticles: Journey inside the Cell. Chem. Soc. Rev. 2017, 46 (14), 4218– 4244, DOI: 10.1039/C6CS00636A [Crossref], [PubMed], [CAS], Google Scholar
3. Tan, H.; Santbergen, R.; Smets, A. H. M.; Zeman, M. Plasmonic Light Trapping in Thin-Film Silicon Solar Cells with Improved Self-Assembled Silver Nanoparticles. Nano
Lett. 2012, 12 (8), 4070– 4076, DOI: 10.1021/nl301521z [ACS Full Text ], [CAS], Google
Scholar
4. Corbierre, M. K.; Cameron, N. S.; Sutton, M.; Khalid Laaziri, A.; Bruce Lennox, R. Gold Nanoparticle/Polymer Nanocomposites: Dispersion of Nanoparticles as a Function of Capping Agent Molecular Weight and Grafting Density. Langmuir 2005, 21 (13), 6063– 6072, DOI: 10.1021/LA047193E [ACS Full Text ], [CAS], Google Scholar
5. Kolosov, O.; Yamanaka, K. Nonlinear Detection of Ultrasonic Vibrations in an Atomic Force Microscope. Jpn. J. Appl. Phys. 1993, 32 (Part 2, No. 8A), L1095– L1098, DOI: 10.1143/JJAP.32.L1095 [Crossref], [CAS], Google Scholar
6. Angeloni, L.; Reggente, M.; Passeri, D.; Natali, M.; Rossi, M. Identification of Nanoparticles and Nanosystems in Biological Matrices with Scanning Probe Microscopy. Wiley Interdisciplinary Reviews: Nanomedicine and Nanobiotechnology 2018, 10 (6), e1521 DOI: 10.1002/wnan.1521 [Crossref], [PubMed], Google Scholar
7. van Es, M. H.; Mohtashami, A.; Thijssen, R. M. T.; Piras, D.; van Neer, P. L. M. J.; Sadeghian, H. Mapping Buried Nanostructures Using Subsurface Ultrasonic Resonance Force Microscopy. Ultramicroscopy 2018, 184, 209– 216, DOI:
8. Cuberes, M. T.; Assender, H. E.; Briggs, G. A. D.; Kolosov, O. V. Heterodyne Force Microscopy of PMMA/Rubber Nanocomposites: Nanomapping of Viscoelastic Response at Ultrasonic Frequencies. J. Phys. D: Appl. Phys. 2000, 33 (19), 2347– 2355, DOI: 10.1088/0022-3727/33/19/301 [Crossref], [CAS], Google Scholar
9. Verbiest, G. J.; van der Zalm, D. J.; Oosterkamp, T. H.; Rost, M. J. A Subsurface Add-on for Standard Atomic Force Microscopes. Rev. Sci. Instrum. 2015, 86 (3), 033704 DOI: 10.1063/1.4915895 [Crossref], [PubMed], [CAS], Google Scholar
10. Verbiest, G. J.; Rost, M. J. Beating Beats Mixing in Heterodyne Detection Schemes. Nat.
Commun. 2015, 6 (1), 6444, DOI: 10.1038/ncomms7444 [Crossref], [PubMed], [CAS], Google
Scholar
11. Verbiest, G. J.; Oosterkamp, T. H.; Rost, M. J. Cantilever Dynamics in Heterodyne Force Microscopy. Ultramicroscopy 2013, 135, 113– 120, DOI:
10.1016/j.ultramic.2013.07.008 [Crossref], [PubMed], [CAS], Google Scholar
12. Verbiest, G. J.; Oosterkamp, T. H.; Rost, M. J. Subsurface Contrast Due to Friction in Heterodyne Force Microscopy. Nanotechnology 2017, 28 (8), 085704 DOI: 10.1088/1361-6528/aa53f2 [Crossref], [PubMed], [CAS], Google Scholar
13. Garcia, R.; Herruzo, E. T. The Emergence of Multifrequency Force Microscopy. Nat.
Nanotechnol. 2012, 7 (4), 217– 226, DOI: 10.1038/nnano.2012.38 [Crossref], [PubMed],
[CAS], Google Scholar
14. Albrecht, T. R.; Grütter, P.; Horne, D.; Rugar, D. Frequency Modulation Detection Using High- Q Cantilevers for Enhanced Force Microscope Sensitivity. J. Appl.
Phys. 1991, 69 (2), 668– 673, DOI: 10.1063/1.347347 [Crossref], Google Scholar
15. Leclère, P.; Lazzaroni, R.; Brédas, J. L.; Yu, J. M.; Dubois, P.; Jérôme, R. Microdomain Morphology Analysis of Block Copolymers by Atomic Force Microscopy with Phase Detection Imaging. Langmuir 1996, 12 (18), 4317– 4320, DOI: 10.1021/la9600964 [ACS Full Text ], [CAS], Google Scholar
16. Tamayo, J.; García, R. Effects of Elastic and Inelastic Interactions on Phase Contrast Images in Tapping-Mode Scanning Force Microscopy. Appl. Phys. Lett. 1997, 71 (16), 2394, DOI: 10.1063/1.120039 [Crossref], [CAS], Google Scholar
17. Rabe, U.; Janser, K.; Arnold, W. Vibrations of Free and Surface-coupled Atomic Force Microscope Cantilevers: Theory and Experiment. Rev. Sci. Instrum. 1996, 67 (9), 3281, DOI: 10.1063/1.1147409 [Crossref], [CAS], Google Scholar
18. Martínez, N. F.; García, R. Measuring Phase Shifts and Energy Dissipation with Amplitude Modulation Atomic Force Microscopy. Nanotechnology 2006, 17 (7), S167– S172, DOI: 10.1088/0957-4484/17/7/S11 [Crossref], [PubMed], [CAS], Google Scholar
19. Claesson, P. M.; Dobryden, I.; Li, G.; He, Y.; Huang, H.; Thorén, P.-A.; Haviland, D. B. From
Force Curves to Surface Nanomechanical Properties. Phys. Chem. Chem.
Phys. 2017, 19 (35), 23642– 23657, DOI: 10.1039/C7CP02612A [Crossref], [PubMed],
[CAS], Google Scholar
20. Huang, H.; Dobryden, I.; Thorén, P.-A.; Ejenstam, L.; Pan, J.; Fielden, M. L.; Haviland, D. B.; Claesson, P. M. Local Surface Mechanical Properties of PDMS-Silica Nanocomposite Probed with Intermodulation AFM. Compos. Sci. Technol. 2017, 150, 111– 119, DOI: 10.1016/j.compscitech.2017.07.013 [Crossref], [CAS], Google Scholar
21. García, R.; Pérez, R. Dynamic Atomic Force Microscopy Methods. Surf. Sci.
Rep. 2002, 47 (6–8), 197– 301, DOI: 10.1016/S0167-5729(02)00077-8 [Crossref],
22. Platz, D.; Forchheimer, D.; Tholén, E. A.; Haviland, D. B. Interaction Imaging with Amplitude-Dependence Force Spectroscopy. Nat. Commun. 2013, 4 (1), 1360, DOI: 10.1038/ncomms2365 [Crossref], [PubMed], [CAS], Google Scholar
23. Farrell, A. A.; Fukuma, T.; Uchihashi, T.; Kay, E. R.; Bottari, G.; Leigh, D. A.; Yamada, H.; Jarvis, S. P. Conservative and Dissipative Force Imaging of Switchable Rotaxanes with Frequency-Modulation Atomic Force Microscopy. Phys. Rev. B: Condens. Matter Mater.
Phys. 2005, 72 (12), 125430, DOI: 10.1103/PhysRevB.72.125430 [Crossref], [CAS], Google
Scholar
24. Cleveland, J. P.; Anczykowski, B.; Schmid, A. E.; Elings, V. B. Energy Dissipation in Tapping-Mode Atomic Force Microscopy. Appl. Phys. Lett. 1998, 72 (20), 2613, DOI: 10.1063/1.121434 [Crossref], [CAS], Google Scholar
25. Garcia, R.; Gómez, C. J.; Martinez, N. F.; Patil, S.; Dietz, C.; Magerle, R. Identification of Nanoscale Dissipation Processes by Dynamic Atomic Force Microscopy. Phys. Rev.
Lett. 2006, 97 (1), 016103 DOI: 10.1103/PhysRevLett.97.016103 [Crossref], [PubMed],
[CAS], Google Scholar
26. Sugawara, Y.; Kobayashi, N.; Kawakami, M.; Li, Y. J.; Naitoh, Y.; Kageshima, M. Elimination of Instabilities in Phase Shift Curves in Phase-Modulation Atomic Force Microscopy in
Constant-Amplitude Mode. Appl. Phys. Lett. 2007, 90 (19), 194104, DOI:
10.1063/1.2737907 [Crossref], [CAS], Google Scholar
27. Paulo, Á. S.; García, R. Tip-Surface Forces, Amplitude, and Energy Dissipation in Amplitude-Modulation (Tapping Mode) Force Microscopy. Phys. Rev. B: Condens. Matter
Mater. Phys. 2001, 64 (19), 193411, DOI: 10.1103/PhysRevB.64.193411 [Crossref], Google
Scholar
28. Schirmeisen, A.; Anczykowski, B.; Fuchs, H. Dynamic Modes of Atomic Force Microscopy. In Nanotribology and Nanomechanics; Springer Berlin Heidelberg: Berlin, Heidelberg, 2008; pp 235– 277; DOI: 10.1007/978-3-540-77608-6_6 [Crossref], Google Scholar
29. Mertz, J.; Marti, O.; Mlynek, J. Regulation of a Microcantilever Response by Force
Feedback. Appl. Phys. Lett. 1993, 62 (19), 2344– 2346, DOI:
10.1063/1.109413 [Crossref], Google Scholar
30. García, R.; San Paulo, A. Attractive and Repulsive Tip-Sample Interaction Regimes in Tapping-Mode Atomic Force Microscopy. Phys. Rev. B: Condens. Matter Mater.
Phys. 1999, 60 (7), 4961– 4967, DOI: 10.1103/PhysRevB.60.4961 [Crossref], [CAS], Google
Scholar
31. Nony, L.; Boisgard, R.; Aimé, J. P. Nonlinear Dynamical Properties of an Oscillating Tip– Cantilever System in the Tapping Mode. J. Chem. Phys. 1999, 111 (4), 1615, DOI: 10.1063/1.479422 [Crossref], [CAS], Google Scholar
32. Martin, Y.; Williams, C. C.; Wickramasinghe, H. K. Atomic Force Microscope–Force Mapping and Profiling on a Sub 100-Å Scale. J. Appl. Phys. 1987, 61 (10), 4723– 4729, DOI: 10.1063/1.338807 [Crossref], [CAS], Google Scholar
33. Giles, R.; Cleveland, J. P.; Manne, S.; Hansma, P. K.; Drake, B.; Maivald, P.; Boles, C.; Gurley, J.; Elings, V. Noncontact Force Microscopy in Liquids. Appl. Phys.
Lett. 1993, 63 (5), 617– 618, DOI: 10.1063/1.109967 [Crossref], [CAS], Google Scholar
34. Hansma, P. K.; Cleveland, J. P.; Radmacher, M.; Walters, D. A.; Hillner, P. E.; Bezanilla, M.; Fritz, M.; Vie, D.; Hansma, H. G.; Prater, C. B.Tapping Mode Atomic Force Microscopy in Liquids. Appl. Phys. Lett. 1994, 64 (13), 1738– 1740, DOI: 10.1063/1.111795 [Crossref], [CAS], Google Scholar
35. Putman, C. A. J.; Van der Werf, K. O.; De Grooth, B. G.; Van Hulst, N. F.; Greve, J. Tapping Mode Atomic Force Microscopy in Liquid. Appl. Phys. Lett. 1994, 64 (18), 2454– 2456, DOI: 10.1063/1.111597 [Crossref], [CAS], Google Scholar
36. Brandsch, R.; Bar, G.; Whangbo, M.-H. On the Factors Affecting the Contrast of Height and
Phase Images in Tapping Mode Atomic Force
Microscopy. Langmuir 1997, 13 (24), 6349– 6353, DOI: 10.1021/la970822i [ACS Full Text ], [CAS], Google Scholar
37. Yablon, D. G.; Gannepalli, A.; Proksch, R.; Killgore, J.; Hurley, D. C.; Grabowski, J.; Tsou, A. H. Quantitative Viscoelastic Mapping of Polyolefin Blends with Contact Resonance Atomic
Force Microscopy. Macromolecules 2012, 45 (10), 4363– 4370, DOI:
10.1021/ma2028038 [ACS Full Text ], [CAS], Google Scholar
38. Thorén, P.-A.; Borgani, R.; Forchheimer, D.; Dobryden, I.; Claesson, P. M.; Kassa, H. G.; Leclère, P.; Wang, Y.; Jaeger, H. M.; Haviland, D. B. Modeling and Measuring Viscoelasticity with Dynamic Atomic Force Microscopy. Phys. Rev. Appl. 2018, 10 (2), 024017 DOI: 10.1103/PhysRevApplied.10.024017 [Crossref], [CAS], Google Scholar
39. Killgore, J. P.; Yablon, D. G.; Tsou, A. H.; Gannepalli, A.; Yuya, P. A.; Turner, J. A.; Proksch, R.; Hurley, D. C. Viscoelastic Property Mapping with Contact Resonance Force Microscopy. Langmuir 2011, 27 (23), 13983– 13987, DOI: 10.1021/la203434w [ACS Full Text ], [CAS], Google Scholar
40. Haviland, D. B.; van Eysden, C. A.; Forchheimer, D.; Platz, D.; Kassa, H. G.; Leclère, P. Probing Viscoelastic Response of Soft Material Surfaces at the Nanoscale. Soft
Matter 2016, 12 (2), 619– 624, DOI: 10.1039/C5SM02154E [Crossref], [PubMed],
[CAS], Google Scholar
41. Ye, X.; Zhu, C.; Ercius, P.; Raja, S. N.; He, B.; Jones, M. R.; Hauwiller, M. R.; Liu, Y.; Xu, T.; Alivisatos, A. P. Structural Diversity in Binary Superlattices Self-Assembled from
Polymer-Grafted Nanocrystals. Nat. Commun. 2015, 6 (1), 10052, DOI:
10.1038/ncomms10052 [Crossref], [PubMed], [CAS], Google Scholar
42. Bell, A. T.; Lewandowski, E.; Ghosh, M.; Harris, N.; Schatz, G. C.; Mirkin, C. A. The Impact of Nanoscience on Heterogeneous Catalysis. Science 2003, 299 (5613), 1688– 1691, DOI: 10.1126/science.1083671 [Crossref], [PubMed], [CAS], Google Scholar
43. Boles, M. A.; Talapin, D. V. Many-Body Effects in Nanocrystal Superlattices: Departure from Sphere Packing Explains Stability of Binary Phases. J. Am. Chem.
Soc. 2015, 137 (13), 4494– 4502, DOI: 10.1021/jacs.5b00839 [ACS Full Text ], [CAS], Google
Scholar
44. Malassis, L.; Jishkariani, D.; Murray, C. B.; Donnio, B. Dendronization-Induced
Phase-Transfer, Stabilization and Self-Assembly of Large Colloidal Au
Nanoparticles. Nanoscale 2016, 8 (27), 13192– 13198, DOI: 10.1039/C6NR03404G [Crossref], [PubMed], [CAS], Google Scholar
45. Diroll, B. T.; Jishkariani, D.; Cargnello, M.; Murray, C. B.; Donnio, B. Polycatenar Ligand Control of the Synthesis and Self-Assembly of Colloidal Nanocrystals. J. Am. Chem.
Soc. 2016, 138 (33), 10508– 10515, DOI: 10.1021/jacs.6b04979 [ACS Full Text ],
[CAS], Google Scholar
46. Peng, S.; Lee, Y.; Wang, C.; Yin, H.; Dai, S.; Sun, S. A Facile Synthesis of Monodisperse Au Nanoparticles and Their Catalysis of CO Oxidation. Nano Res. 2008, 1 (3), 229– 234, DOI: 10.1007/s12274-008-8026-3 [Crossref], [CAS], Google Scholar
47. Kim, Y.-T.; Jung, H.; Lee, U.-H.; Kim, T.-H.; Jang, J. K.; Park, J. B.; Rhee, J. Y.; Yang, C.-W.; Park, J.-G.; Kwon, Y.-U. High-Density Ordered Arrays of CoPt 3 Nanoparticles with
Individually Addressable Out-of-Plane Magnetization. ACS Applied Nano
Materials 2019, 2 (2), 975– 982, DOI: 10.1021/acsanm.8b02281 [ACS Full Text ],
[CAS], Google Scholar
48. Rastei, M. V.; Meckenstock, R.; Bucher, J. P. Nanoscale Hysteresis Loop of Individual Co
Dots by Field-Dependent Magnetic Force Microscopy. Appl. Phys.
Lett. 2005, 87 (22), 222505, DOI: 10.1063/1.2138349 [Crossref], [CAS], Google Scholar
49. Krivcov, A.; Schneider, J.; Junkers, T.; Möbius, H. Magnetic Force Microscopy of in a Polymer Matrix Embedded Single Magnetic Nanoparticles. Phys. Status Solidi
A 2019, 216 (12), 1800753, DOI: 10.1002/pssa.201800753 [Crossref], Google Scholar
50. Butt, H.-J.; Cappella, B.; Kappl, M. Force Measurements with the Atomic Force Microscope: Technique, Interpretation and Applications. Surf. Sci. Rep. 2005, 59 (1-6), 1– 152, DOI: 10.1016/j.surfrep.2005.08.003 [Crossref], [CAS], Google Scholar
51. Style, R. W.; Hyland, C.; Boltyanskiy, R.; Wettlaufer, J. S.; Dufresne, E. R. Surface Tension and Contact with Soft Elastic Solids. Nat. Commun. 2013, 4 (1), 2728, DOI: 10.1038/ncomms3728 [Crossref], [PubMed], [CAS], Google Scholar
52. Butt, H.-J.; Pham, J. T.; Kappl, M. Forces between a Stiff and a Soft Surface. Curr. Opin.
Colloid Interface Sci. 2017, 27, 82– 90, DOI: 10.1016/j.cocis.2016.09.007 [Crossref],
[CAS], Google Scholar
53. Magonov, S. N.; Elings, V.; Whangbo, M.-H. Phase Imaging and Stiffness in Tapping-Mode Atomic Force Microscopy. Surf. Sci. 1997, 375 (2–3), L385– L391, DOI: 10.1016/S0039-6028(96)01591-9 [Crossref], [CAS], Google Scholar
54. García, R.; Magerle, R.; Perez, R. Nanoscale Compositional Mapping with Gentle Forces. Nat. Mater. 2007, 6 (6), 405– 411, DOI: 10.1038/nmat1925 [Crossref], [PubMed], [CAS], Google Scholar
55. Forchheimer, D.; Platz, D.; Tholén, E. A.; Haviland, D. B. Model-Based Extraction of Material Properties in Multifrequency Atomic Force Microscopy. Phys. Rev. B: Condens.
Matter Mater. Phys. 2012, 85 (19), 195449, DOI: 10.1103/PhysRevB.85.195449 [Crossref],
[CAS], Google Scholar
56. Tetard, L.; Passian, A.; Venmar, K. T.; Lynch, R. M.; Voy, B. H.; Shekhawat, G.; Dravid, V. P.; Thundat, T. Imaging Nanoparticles in Cells by Nanomechanical Holography. Nat.
Nanotechnol. 2008, 3 (8), 501– 505, DOI: 10.1038/nnano.2008.162 [Crossref], [PubMed],
[CAS], Google Scholar
57. Tetard, L.; Passian, A.; Lynch, R. M.; Voy, B. H.; Shekhawat, G.; Dravid, V.; Thundat, T. Elastic Phase Response of Silica Nanoparticles Buried in Soft Matter. Appl. Phys.
Lett. 2008, 93 (13), 133113, DOI: 10.1063/1.2987460 [Crossref], [CAS], Google Scholar
58. Ebeling, D.; Eslami, B.; Solares, S. D. J. Visualizing the Subsurface of Soft Matter: Simultaneous Topographical Imaging, Depth Modulation, and Compositional Mapping with Triple Frequency Atomic Force Microscopy. ACS Nano 2013, 7 (11), 10387– 10396, DOI: 10.1021/nn404845q [ACS Full Text ], [CAS], Google Scholar
59. Yao, A.; Kobayashi, K.; Nosaka, S.; Kimura, K.; Yamada, H. Visualization of Au Nanoparticles Buried in a Polymer Matrix by Scanning Thermal Noise Microscopy. Sci.
Rep. 2017, 7 (1), 42718, DOI: 10.1038/srep42718 [Crossref], [PubMed], [CAS], Google