HAL Id: hal-02987581
https://hal.archives-ouvertes.fr/hal-02987581
Submitted on 4 Nov 2020
HAL is a multi-disciplinary open access
archive for the deposit and dissemination of
sci-entific research documents, whether they are
pub-lished or not. The documents may come from
teaching and research institutions in France or
abroad, or from public or private research centers.
L’archive ouverte pluridisciplinaire HAL, est
destinée au dépôt et à la diffusion de documents
scientifiques de niveau recherche, publiés ou non,
émanant des établissements d’enseignement et de
recherche français ou étrangers, des laboratoires
publics ou privés.
The implications of the surprising existence of a large,
massive CO disk in a distant protocluster
H. Dannerbauer, M. D. Lehnert, B. Emonts, B. Ziegler, B. Altieri, C. de
Breuck, N. Hatch, T. Kodama, Y. Koyama, J. D. Kurk, et al.
To cite this version:
H. Dannerbauer, M. D. Lehnert, B. Emonts, B. Ziegler, B. Altieri, et al.. The implications of the
surprising existence of a large, massive CO disk in a distant protocluster. Astronomy and Astrophysics
- A&A, EDP Sciences, 2017, 608, pp.A48. �10.1051/0004-6361/201730449�. �hal-02987581�
DOI:10.1051/0004-6361/201730449 c ESO 2017
Astronomy
&
Astrophysics
The implications of the surprising existence of a large,
massive CO disk in a distant protocluster
?
H. Dannerbauer
1, 2, 3, M. D. Lehnert
4, B. Emonts
5, 6, B. Ziegler
3, B. Altieri
7, C. De Breuck
8, N. Hatch
9, T. Kodama
10,
Y. Koyama
10, 11, J. D. Kurk
12, T. Matiz
3, G. Miley
13, D. Narayanan
14, R. P. Norris
15, 16, R. Overzier
17,
H. J. A. Röttgering
13, M. Sargent
18, N. Seymour
19, M. Tanaka
10, I. Valtchanov
7, and D. Wylezalek
201 Instituto de Astrofísica de Canarias (IAC), 38205 La Laguna, Tenerife, Spain
e-mail: helmut@iac.es
2 Universidad de La Laguna, Dpto. Astrofísica, 38206 La Laguna, Tenerife, Spain 3 Universität Wien, Institut für Astrophysik, Türkenschanzstraße 17, 1180 Vienna, Austria
4 Sorbonne Universités, UPMC Univ. Paris 6 et CNRS, UMR 7095, Institut d’Astrophysique de Paris, 98bis Bd Arago, 75014 Paris,
France
5 Centro de Astrobiología (INTA-CSIC), Ctra de Torrejón a Ajalvir, km 4, 28850 Torrejón de Ardoz, Madrid, Spain 6 National Radio Astronomy Observatory, 520 Edgemont Road, Charlottesville, VA 22903, USA
7 Herschel Science Centre, European Space Astronomy Centre, ESA, 28691 Villanueva de la Cañada, Spain 8 European Southern Observatory, Karl-Schwarzschild-Straße 2, 85748 Garching, Germany
9 School of Physics and Astronomy, University of Nottingham, University Park, Nottingham NG7 2RD, UK
10 Optical and Infrared Astronomy Division, National Astronomical Observatory of Japan, Mitaka, 181-8588 Tokyo, Japan 11 Department of Space Astronomy and Astrophysics, Institute of Space and Astronautical Science (ISAS), Japan Aerospace
Exploration Agency (JAXA), 3-1-1 Yoshinodai, Chuo-ku, Sagamihara, 252-5210 Kanagawa, Japan
12 Max-Planck-Institut für extraterrestrische Physik, Giessenbachstraße 1, 85748 Garching, Germany 13 Leiden Observatory, PO Box 9513, 2300 RA Leiden, The Netherlands
14 University of Florida, Department of Astronomy, 211 Bryant Space Sciences Center, Gainesville, FL 32611-2055, USA 15 CSIRO Astronomy & Space Science, PO Box 76, Epping, NSW 1710, Australia
16 Western Sydney University, Locked Bag 1797, Penrith South, NSW 1797, Australia
17 Observatório Nacional, Rua José Cristino 77, 20921-400 São Cristóvão, Rio de Janeiro, Brazil
18 Astronomy Centre, Department of Physics and Astronomy, University of Sussex, Brighton BN1 9QH, UK
19 International Center for Radio Astronomy Research, Curtin University, GPO Box U1987, Perth, WA 6845, Australia
20 Johns Hopkins University Bloomberg Center, Department of Physics & Astronomy, 3400 N. Charles Street, Baltimore, MD 21218,
USA
Received 17 January 2017/ Accepted 3 July 2017
ABSTRACT
It is not yet known if the properties of molecular gas in distant protocluster galaxies are significantly affected by their environment as galaxies are in local clusters. Through a deep, 64 h of effective on-source integration with the Australian Telescope Compact Array (ATCA), we discovered a massive, Mmol= 2.0 ± 0.2 × 10¹¹M , extended, ∼40 kpc, CO(1–0)-emitting disk in the protocluster
surrounding the radio galaxy, MRC 1138−262. The galaxy, at zCO = 2.1478, is a clumpy, massive disk galaxy, M∗ ∼ 5 × 10¹¹ M ,
which lies 250 kpc in projection from MRC 1138−262 and is a known Hα emitter, named HAE229. This source has a molecular gas fraction of ∼30%. The CO emission has a kinematic gradient along its major axis, centered on the highest surface brightness rest-frame optical emission, consistent with HAE229 being a rotating disk. Surprisingly, a significant fraction of the CO emission lies outside of the UV/optical emission. In spite of this, HAE229 follows the same relation between star-formation rate and molecular gas mass as normal field galaxies. HAE229 is the first CO(1–0) detection of an ordinary, star-forming galaxy in a protocluster. We compare a sample of cluster members at z > 0.4 that are detected in low-order CO transitions, with a similar sample of sources drawn from the field. We confirm findings that the CO-luminosity and full-width at half maximum are correlated in starbursts and show that this relation is valid for normal high-z galaxies as well as for those in overdensities. We do not find a clear dichotomy in the integrated Schmidt-Kennicutt relation for protocluster and field galaxies. Our results suggest that environment does not have an impact on the “star-formation efficiency” or the molecular gas content of high-redshift galaxies. Not finding any environmental dependence in these characteristics, especially for such an extended CO disk, suggests that environmentally-specific processes such as ram pressure stripping do not operate efficiently in (proto)clusters.
Key words. galaxies: clusters: individual: MRC 1138–262 – galaxies: high-redshift – galaxies: evolution – galaxies: ISM –
submillimeter: galaxies – galaxies: individual: HAE229
? The reduced datacube (FITS file) is only available at the CDS via
anonymous ftp tocdsarc.u-strasbg.fr (130.79.128.5) or via
http://cdsarc.u-strasbg.fr/viz-bin/qcat?J/A+A/608/A48
1. Introduction
Over the last decade detections of molecular line emis-sion in high-redshift galaxies have become routine (e.g.,
Carilli & Walter 2013). These detections mainly came from ob-servations of the bright high order transitions of CO and gen-erally from extreme source populations such as submillime-ter galaxies (SMGs; see Blain et al. 2002; Casey et al. 2014, for detailed reviews) or high-z QSOs (e.g., Walter et al. 2004) which are intrinsically gas-rich (MH2 ∼ few times 10
10 M ),
or from strongly lensed sources (e.g., Baker et al. 2004;
Lestrade et al. 2010;Weiß et al. 2013;Spilker et al. 2014,2015;
Cañameras et al. 2015; Dye et al. 2015; Swinbank et al. 2015;
Aravena et al. 2016; Béthermin et al. 2016; Harrington et al. 2016; Sharon et al. 2016). Very few detections are avail-able for normal star-forming galaxies (e.g., Daddi et al. 2008,
2010a, 2014; Dannerbauer et al. 2009; Tacconi et al. 2010,
2013; Genzel et al. 2015). These are found to have substantial reservoirs of molecular gas, but convert their gas into stars with a lower efficiency.
The number of CO detections of galaxies which lie in over-densities (protoclusters) at z > 1 is still small (e.g.,Daddi et al. 2009;Capak et al. 2011;Aravena et al. 2012;Wagg et al. 2012;
Casey 2016; Wang et al. 2016). This is unfortunate and the limited sample size of well-studied protocluster galaxies in CO hampers our ability to study the build-up of galaxy popula-tions in clusters. Almost all of the CO detecpopula-tions of protocluster galaxies are in the environments of high-redshift radio galax-ies (Ivison et al. 2008,2012;Casasola et al. 2013;Emonts et al. 2014).Tadaki et al.(2014) detected three galaxies – two robustly and one tentatively – in CO(1–0) in the protocluster surround-ing USS 1558−003 at z = 2.53. These three galaxies were all originally identified as Hα emitters (HAEs). They conclude that these HAEs, based on their estimated star-formation efficiencies, SFE= SFR/Mmol (the ratio of star-formation rate and
molecu-lar gas mass), are gas-rich major mergers. Geach et al.(2011) andAravena et al.(2012) find that the SFE of IR-bright cluster members are similar to disk-like galaxies at lower redshifts. On the contrary,Ivison et al.(2013) find that two of four discovered CO-bright galaxies within a region of ∼100 kpc do have high SFEs.Jablonka et al.(2013) made the first detailed study of how molecular gas properties depend on the environment beyond the local universe. They find that, at intermediate redshifts, z ∼ 0.4, environment starts to affect the cold gas content of the most mas-sive galaxies in clusters. Since we know that cluster galaxies in the nearby universe and at moderate redshifts are relatively gas poor (Chamaraux et al. 1980, 1986; Vollmer et al. 2001a;
Jablonka et al. 2013), the crucial question to investigate is: When does environment begin to play a significant role in shaping the gas content of galaxies (Vollmer et al. 2001b;Gnedin 2003a,b;
Husband et al. 2016)? Of course, like many questions in astro-physics, answering this is hampered by small sample sizes and the lack of systematic studies (cf.Chapman et al. 2015).
In one of the best studied protocluster fields, MRC 1138−262 at z = 2.16 (e.g., Kurk et al. 2000, 2004a,b; Pentericci et al. 2000;Hatch et al. 2011;Dannerbauer et al. 2014;Emonts et al. 2016), using the Australia Telescope Compact Array (ATCA),
Emonts et al. (2013) tentatively detected the CO(1–0) emis-sion from the Hα bright galaxy, HAE229 (Kurk et al. 2004b;
Doherty et al. 2010).Dannerbauer et al.(2014) found evidence that HAE229 – about 3000(∼250 kpc in projected distance) from
the radio galaxy MRC 1138−262 – is an SMG and part of the overdensity of dusty starbursts in the field of MRC 1138−262. Its redshift also indicates it is a protocluster member (Kuiper et al. 2011). Here we present a robust detection of the CO(1–0) line of this source adding new, deeper, and higher-resolution ATCA data (Emonts et al. 2013). Other than the radio galaxy MRC 1138−262 (Emonts et al. 2013,2016), HAE229 is the first
unambiguously confirmed gas-rich member of this well-studied protocluster.
The structure of this paper is as follows. Sections 2 and 3 describe the properties of HAE229 and our new ATCA tions. In Sect. 4 we present the results of the CO(1–0) observa-tions of HAE229 and in Sect. 5 we discuss the properties of this gas-rich HAE and compare the molecular gas properties of pro-tocluster galaxies and field galaxies. We adopt the cosmological parametersΩm = 0.27, ΩΛ= 0.73, and H0 = 71 km s−1Mpc−1
(Spergel et al. 2003, 2007). At redshift z = 2.16, 1 arcsec corresponds to 8.4 kpc. All magnitudes in this paper are on the AB magnitude scale (Oke & Gunn 1983) and we assume a Salpeter initial mass function (IMF; Salpeter 1955) in our analysis.
2. A brief history of HAE229
Kurk et al. (2004a) discovered HAE229 through Hα narrow-band imaging at the approximate redshift of the radio galaxy. The excess emission in the narrow-band image of HAE229 was subsequently confirmed spectroscopically to be Hα emission at z = 2.1489 (Kurk et al. 2004b; see also Koyama et al. 2013).
Doherty et al.(2010) found that HAE229 (#464 in their paper) is a massive, dust-obscured star-forming red galaxy, [J−K] > 2.41, with a stellar mass, M∗= 5.1+1.5−2.0× 10¹¹M , and a star-formation
rate estimated from spectral energy distribution (SED) fitting, SFRSED = 35 ± 6 M yr−1. Ogle et al. (2012) observed this
source with Spitzer IRS, detecting polycyclic aromatic hydrocar-bons (PAH) emission at 7.7 µm, concluding that the star forma-tion in HAE229 is heavily obscured and implying a much higher SFR, SFRPAH = 880 M yr−1, than was estimated previously
(e.g.,Doherty et al. 2010). HAE229 is one of the most massive HAEs embedded in the large scale structure at z = 2.16 (see Fig. 6 inKoyama et al. 2013; and Fig. 8 in Dannerbauer et al. 2014). Finally, when observing the radio galaxy MRC 1138−262 with ATCA,Emonts et al. (2013) serendipitously found a ten-tative CO(1–0) emission line at zCO = 2.147 at the
posi-tion of HAE229 and Dannerbauer et al. (2014) associated this source with a Submillimeter Common-User Bolometric Array (SCUBA) submm detection (Stevens et al. 2003).
3. Observations
3.1. ATCA observations of CO(1–0)
Our CO(1–0) observations of HAE229 were performed with the Australia Telescope Compact Array during April 2011– February 2015 in the H75, H168, H214, 750A, 750D, and 1.5A array configurations and only including baselines ranging from 31−800 m in our reduction. Data from the longest baselines of the 1.5A array configuration were discarded because these data were obtained during day-time under moderate weather condi-tions. Excluding them from the reduction resulted in a more uni-form uv-coverage and a more robust image. Our total on-source integration time is ∼90 h. Our primary goal with these observa-tions was to obtain ultra-deep data on the radio galaxy within the protocluster MRC 1138−262. Hence the pointing center of the observations was 30 arcsec east of our target HAE229 (see
Emonts et al. 2013). This increased the effective noise at its lo-cation by a factor of ∼1.4 as a result of the primary beam correc-tion (FWHMPrimBeam∼ 77 arcsec). The effective integration time
is therefore only 60 h or 2/3rd of the total on-source time. Obser-vations were centered around 36.5 GHz, using a channel width of 1 MHz and an effective bandwidth of 2 GHz.
Phase and bandpass calibration were performed by observing the strong calibrator PKS 1124−186 every 5−12 min. The fre-quency of the observations depended on the weather conditions. However, given the 8.2◦distance of PKS 1124–186 from our tar-get, we used the weaker but closer (2.8◦) calibrator PKS 1143–
287 for phase calibration in the more extended 750A/D and 1.5A array configurations. The bandpass calibration scans of PKS 1124–186 were taken approximately every hour. An abso-lute flux scale was determined using observations of Mars for array configurations, H75 and H168, the ultra-compact H II re-gion G309 for H214, and PKS 1934–638 for array configura-tions, 750A/D and 1.5A (Emonts et al. 2011)1. The strong ra-dio continuum of MRC 1138−262 allowed us to verify that the flux scaling between all observations stayed within the typical 30% accuracy for flux calibration at the ATCA. These data were reduced in MIRIAD (Sault et al. 1995) and analysed with the KARMA software (Gooch 1996), following the strategy de-scribed inEmonts et al.(2013). The continuum-subtracted line-data products that we present in this paper were weighted using a robustness parameter of+1 (Briggs 1995), binned into 34 km s−1 channels and subsequently Hanning-smoothed to an effective velocity resolution of 68 km s−1 (equivalent to two 34 km s−1 binned channels). This procedure results in a root-mean-square noise of 0.12 mJy beam−1per channel in the region of HAE229, after correcting for the primary beam response. At the half-power point, the synthesized beam is 400. 7 × 300. 1 (PA = −6◦).
Velocities in this paper are defined in the optical barycentric ref-erence frame with respect to z= 2.1478.
3.2. HAWK-I
We mapped the field around the radio galaxy, MRC 1138−262, with the near-infrared wide-field imager High Acuity Wide field K-band Imager (HAWK-I) at the ESO Very Large Telescope (VLT). The observations were taken in the Y-, H-, and Ks-bands
during February and March 2012, April, May, and July 2013, and January and February 2015 in service mode. The seeing was 000. 4−000. 6 during these observations. The dithered HAWK-I
data were reduced using the ESO/MVM data reduction pipeline (Vandame 2004), following the standard reduction steps for near-infrared imaging data.
4. Results
HAE229 has been observed with the Advanced Camera for Surveys (ACS) on Hubble Space Telescope (HST) through the F475W and F814W filters (Miley et al. 2006) and with the Near Infrared Camera and Multi-Object Spectrometer (NIC-MOS) on HST through the J110 and H160 filters (Zirm et al.
2008). In all of these images, we only detect HAE229 in the ACS F814W band (rest-frame ∼2560 Å)2. There are several regions of higher surface brightness rest-frame UV emission seen in the HST image (labeled a, b, c, d; Fig.1) embedded in more diffuse, lower surface brightness emission. Two of them, a and b, are “clumps” of UV emission (meaning marginally ex-tended, point-like sources), while c and d have fainter clumps
1 The reason for altering the flux calibrators is that the reliability of
the absolute flux scale of PKS 1934–638 was still questionable during the epoch 2011–2013. Mars was not always visible and G309 (with flux bootstrapped from Uranus;Emonts et al. 2011) is fully resolved in the longer-baseline 750A/D and 1.5A array configurations.
2 We note thatKoyama et al.(2013) discuss the HST F814W imaging
of 54 HAEs, one of which is HAE229.
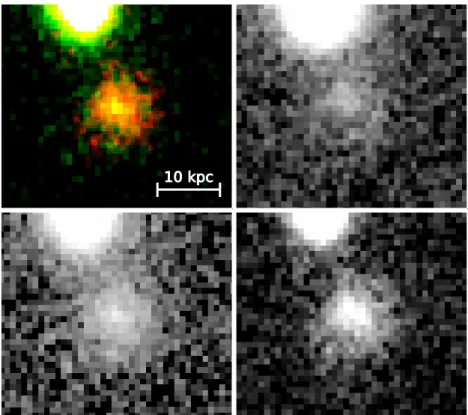
Fig. 1.The 300
× 300
HST F814W image of the clumpy galaxy, HAE229. The size of HAE229 is 100.2 × 000.6 (10 × 5 kpc). Regions a and b are
clumpy and knot-like whereas areas c and d have more diffuse rest-frame UV emission morphology.
superposed on diffuse continuum emission. The size of this clumpy galaxy – with marginally resolved sources evident in the HST/ACS light distribution system – is 100. 2 × 000. 6 (10 ×
5 kpc). Despite its clumpy structure, estimating the “Gini” co-efficient (e.g.,Abraham et al. 2003) of the HST F814W image of HAE229 suggests that its light is dominated by a uniform, lower surface brightness diffuse component (see Koyama et al. 2013, for details). We detect this source in Subaru MOIRCS and VLT HAWK-I near-infrared imagery but not in shallower HST near-infrared (NIR) images. At near-infrared wavelengths, HAE229 becomes much more regular in appearance (Fig.2). We do not see an offset of centers between the rest-frame UV (∼2560 Å) and rest-frame optical regions (∼3063−7300 Å) of HAE229. The comparable images of normal SFGs (star-forming galaxies) shows that they often consist of clumps within diffuse continuum emission similar to what we observe for HAE229 (see the image montages in, e.g.,Tacconi et al. 2013). In addi-tion, the highest surface brightness region in the near-infrared, presumably the center of mass of the stellar component, is very red and is responsible for giving HAE229 its overall red color. Again, this is found among many distant disk galaxies, espe-cially ones that are similarly massive (e.g.,Pannella et al. 2009) The CO(1−0) transition is now robustly detected in our new data for HAE229, with a total significance of ∼7σ (Fig.3). We measure a peak flux, Sv = 0.57 ± 0.06 mJy beam−1, at the
position: RA2000.0= 11:40:46.05 and Dec2000.0 = −26:29:11.2s
(Table 1). The full-width at half maximum (FWHM) of the line is 359 ± 34 km s−1 and we obtain an integrated flux,
ICO(1−0)= 0.22 ± 0.03 Jy km s−1. The CO line redshift zCO(1−0)=
2.1478 ± 0.0002 agrees with the redshift estimate obtained us-ing Hα (Kurk et al. 2004b;Doherty et al. 2010). Both the mea-sured redshift and line FWHM are consistent with the results of Emonts et al. (2013) for their tentative detection. However, the flux density increased by 80%. We derive L0
CO(1−0) = 5.0 ±
0.07 × 10¹⁰ K km s−1 pc2 from the current data set. We stress that the uncertainties in the flux and luminosity estimates are
Fig. 2.The 4.200
× 3.700
regions centered on HAE229. Top left panel: a composite three-color image made by combining the Y-, H-, and Ks-band
color images taken with HAWK-I on the ESO/VLT (see text and Table2for details). To show the rest-frame blue and red optical morphology, we show each color component of the composite separately, namely, Y-band (approximately rest-frame U-band, top right), H-band (approximately rest-frame B- or V-band, bottom left) and Ks-band (approximately rest-frame R-band, bottom right). The Y-band image has a morphology similar
to that of the F814W image and no offset is detected between the rest-frame UV and rest-frame optical regions. With increasing wavelength, the emission becomes less clumpy, more regular, and a red nucleus is evident. The dynamical center of the CO(1–0) emission corresponds to the highest surface brightness region of the H- and Ks-band images suggesting this region is also the center of mass of the galaxy. The bright galaxy
above HAE229 in all panels lies at zphot≈ 0.5 (Tanaka et al. 2010).
CO(1-0)
Fig. 3.CO(1–0) spectrum of HAE229 from data taken with the com-pact hybrid ATCA configurations (for which the signal is spatially un-resolved). The red line shows a Gaussian fit from which we derived z, L0
CO(1−0)and FWHMCO(1−0).
measurement errors, and do not include the 30% uncertainty in absolute flux calibration (Sect. 3.1), or potential errors in the primary beam calibration (which may be important considering
that HAE229 is located close to the edge of the primary beam; Sect.3.1).
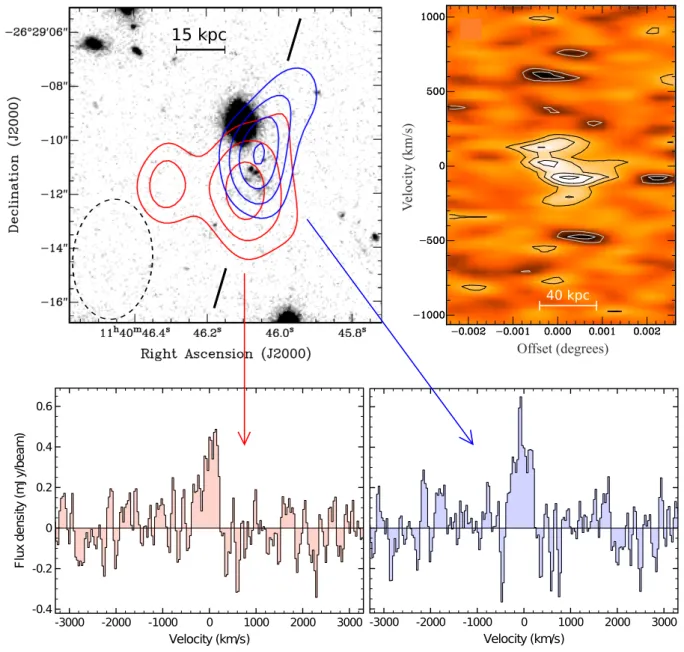
The most important new finding in these deeper data is that the emission in HAE229 appears to be very extended and is ro-tating about the center of mass as indicated in our near-infrared imaging (Fig.4). The northwestern and southeastern sides of the rotating disk are separated ∼1.800or about ∼15 kpc in projection,
along PA ∼ −22◦. Their midpoint corresponds to the peak sur-face brightness of the continuum emission in the near-infrared (within the uncertainties in the astrometry of each data set; Fig.4). The position-velocity diagram along the blue and the red velocity components on the northeastern and southwestern sides of the disk (Fig.4) shows a velocity gradient of ∼200 km s−1in projection. The most likely explanation for the gas properties is rotation of a gaseous disk around the center of the stellar mass of the system. The total CO emission is spread over a region of ≈40 kpc in diameter and much of the gas is well outside the low-est surface brightness stellar continuum emission detected in the optical and near-infrared imaging.
In Fig. 5, we show the rest-frame UV through the FIR/submm spectral energy distribution (SED) of HAE229 (Table2). We compared the SED of HAE229 with those from a variety of other sources (see Pope et al. 2008; Weiß et al. 2009;Michałowski et al. 2010;Magdis et al. 2012;Hodge et al. 2013b; Karim et al. 2013; Swinbank et al. 2014). The far-infrared SED of HAE229 is similar to the templates which we have chosen for making our comparison. The template of the main-sequence galaxies resembles most closely the far-infrared
Table 1. Positions of HAE229.
ID Instrument RA Dec Offset Reference
(J2000.0) (J2000.0) ∆CO − Other
CO counterpart ATCA 11:40:46.05 ± 0.05 −26:29:11.2 ± 0.6 – this paper
HAE#229 VLT-ISAAC 11:40:46.1 −26:29:11.5 0.7 Kurk et al.(2004a)
HAE#902 Subaru-MOIRCS 11:40:46.065 −26:29:11.33 0.2 Koyama et al.(2013)
Notes. Units of right ascension are hours, minutes, and seconds, and units of declination are degrees, arcminutes, and arcseconds.
15 kpc
Offset (degrees) V el oci ty ( km /s ) -3000 -2000 -1000 0 1000 2000 3000 Velocity (km/s) -0.4 -0.2 0 0.2 0.4 0.6 F lu x de ns ity (m Jy /b ea m ) -3000 -2000 -1000 0 1000 2000 3000 Velocity (km/s) -0.4 -0.2 0 0.2 0.4 0.6 F lu x de ns ity (m Jy /b ea m ) 40 kpcFig. 4.Overview of the CO(1–0) full-resolution ATCA data. Top left: total intensity image of the CO(1–0) emission across the velocity ranges −200 < v < 0 km s−1(blue contours) and 0 < v <+200 km s−1(red contours). Contour levels are 3, 4, 5, 6σ, and σ= 0.015 Jy beam−1km s−1.
FollowingPapadopoulos et al.(2008), the relative accuracy in the position of the CO peak emission is <∼0.400. The dashed circle indicates the half-power size of the synthesized beam. Top right: position-velocity plot of the CO(1–0) emission along the line indicated in the top-left plot (along the northwestern-southeastern direction). Contours level shown are −4, −3, −2 (gray), 2, 3, 4, 5 (black) σ. Bottom: CO(1–0) spectra of the peak emission in the blue- and red-shifted velocity components as indicated in the plot at the top left. The spectra are not mutually independent due to the relatively large beam and due to having velocities that over-lap.
SED of HAE229. Just like another protocluster galaxy, DRG55 (Chapman et al. 2015), HAE229 is significantly fainter at rest-frame wavelengths <∼1 µm, demonstrating that it is extremely red and is highly dust-enshrouded. We note that redshifted, z = 2.2 [CII]158 µm emission contributes to the SPIRE 500 µm flux (see
alsoSmail et al. 2011, for a more detailed discussion of this ef-fect). The uncertainty in the SCUBA submm flux measurements of this source is evident in the offset of the different templates relative to these measurements (Stevens et al. 2003). The SED of HAE229 appears to be typical of the general population of
dusty star-forming galaxies in the infrared and submm. By inte-grating the infrared emission from 40−1000 µm, we estimate a star-formation rate of SFRIR = 555 M yr−1for HAE2293.
5. Discussion
In extremely deep observations with the ATCA, we have found a very extended, massive, rotating disk of cold gas in a galaxy embedded in the protocluster surrounding the radio galaxy, MRC 1138−262. HAE229 has a high stellar mass, a few 1011 M
, already in place at z = 2.16. Its high CO(1–0)
lumi-nosity suggests that it has a similar mass in cold molecular gas. HAE229 is moving at high speed relative to the radio galaxy MRC 1138−262, over −1200 km s−1, and has a small projected separation, ∼250 kpc (Emonts et al. 2013). Dannerbauer et al.
(2014) showed that the far-IR and sub-mm emission detected by Herschel/SPIRE 250 µm and APEX LABOCA at the posi-tion of MRC 1138−262 is extended in the direcposi-tion of HAE229. Although it has a relatively high velocity relative to the radio galaxy, it has a similar velocity to other protocluster galaxies that lie to the west of the radio galaxy (Kuiper et al. 2011), so it is likely that HAE229 is a member of the protocluster surround-ing MRC 1138−262.
HAE229 is the first CO(1–0) emitting HAE that is classi-fied as a disk galaxy in a (proto)cluster. This is only the fifth detection of CO in an HAE residing in an overdensity at high redshift. For all, with one exception, DRG55 (Chapman et al. 2015), the low-order CO transitions are detected, enabling ro-bust estimates of their total molecular gas mass to be made with-out significant uncertainties due to the unknown excitation of the gas. Three galaxies with possible low-order CO detections, bHAE-191, rHAE-193, and rHAE-213 (which is only tentatively detected), reside in the protocluster USS 1558−003 at z = 2.53 (Tadaki et al. 2014) and two of them4, bHAE-191 and rHAE-193, are classified as mergers.
Given the uniqueness of HAE229 – it has a large content of molecular gas and very extended molecular emission – there are several interesting questions to address. What is the nature of this galaxy? Given that its stellar mass is already very high, that the co-moving space density of star-forming galaxies this mas-sive is extremely low (<∼10−5.5Mpc−3;Ilbert et al. 2013), and that the galaxy is also gas-rich, what processes might prevent it from further increasing its stellar mass substantially? Does its loca-tion in a protocluster at high redshift affect any of the properties of its cold gas or the nature of its star formation? Do galaxies in protoclusters form their stars as efficiently as field galaxies? Are their gas fractions significantly lower than those in nearby cluster galaxies? We now address these questions.
5.1. The nature of HAE229
A key aspect of understanding the nature of distant galaxies is determining their mode of star formation (Daddi et al. 2010b;
Genzel et al. 2010;Narayanan et al. 2015). Distant galaxies are hypothesized to have two modes of star formation, a “quiescent mode” and a “starburst mode”. The quiescent mode refers to galaxies having relatively long gas depletion timescales (tdep≡
MH2/SFR, where MH2 is the mass of molecular gas and SFR is
3 We note that if we used a Chabrier stellar initial mass function
(Chabrier 2003) instead of a Salpeter IMF, our estimated SFRIRwould
be a factor of 1.8 smaller.
4 The third source, rHAE-213, has no reliable FIR-measurements.
Fig. 5.Spectral energy distribution of HAE229 (black filled circles). We show the template SED (solid line) of a main-sequence galaxy at z = 2 (Magdis et al. 2012) which is based on models (Draine & Li 2007). In addition, template SEDs of observed SMGs are shown for comparison: ALESS SMG composite (dotted line – Swinbank et al. 2014), average SED of 73 spectroscopically identified SMGs (dashed line –Michałowski et al. 2010), and an average SED of SMGs (dashed-dotted line –Pope et al. 2008). The far-infrared SED is matched by the different SMG composites whereas the rest-frame optical SED shows that HAE229 is redder than the average of various types of dusty vigor-ously star-forming galaxies at high redshift.
the star-formation rate) of 0.5−2 Gyr (e.g., Leroy et al. 2008;
Bigiel et al. 2008;Daddi et al. 2010b;Tacconi et al. 2013). This mode has been hypothesized to be due to the long dynami-cal times of disk galaxies. Galaxies in “starburst” mode have short gas depletion times, <∼100 Myr (e.g., Greve et al. 2005;
Ivison et al. 2011), and complex morphologies and dynamics. This mode is hypothesized to be triggered by major mergers of two or more gas-rich disk galaxies.
In distant, z ∼ 2 protoclusters, cold molecular gas reser-voirs have only been detected in starbursts (Hodge et al. 2012,
2013a; Ivison et al. 2013; Riechers et al. 2010; Tadaki et al. 2014;Walter et al. 2012).Chapman et al.(2015) report the blind detection of star-forming molecular gas via the CO(3−2) tran-sition of the extremely red, main sequence galaxy DRG55 in the protocluster HS1700+64. The equivalent width of the Hα emission of this source is high suggesting that it has formed a substantial fraction of its stellar mass relatively re-cently (Chapman et al. 2015). Another four UV-selected main-sequence SFGs in HS1700+64 are detected in CO(3−2) (Tacconi et al. 2013). Detecting low excitation CO lines of nor-mal, star-forming galaxies in overdensities is rare. This is pre-dominately due to the lack of systematic, targeted low-J CO studies of galaxies in overdensities. Very recently Wang et al.
(2016) reported the detection of 11 galaxies in CO(1–0) in a cluster at z= 2.51. HAE229 has an exquisite multi-wavelength data set available which enables us to investigate this galaxy in detail (see Table2and Fig.5). From these data, there are exten-sive estimates of the properties of HAE229 such as luminosities, masses, and (specific) star-formation rates (Table3).
5.1.1. The molecular gas in HAE229
How gas-rich is HAE229 actually? This is difficult to esti-mate accurately due to the significant uncertainties in deter-mining the CO luminosity to molecular gas-mass conversion
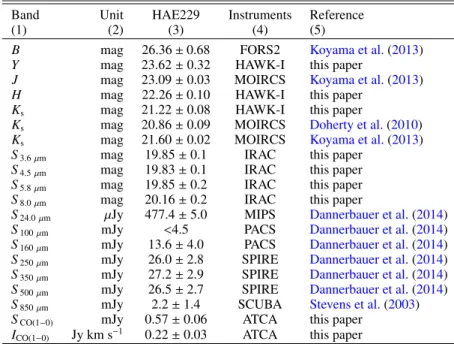
Table 2. Fluxes of HAE229.
Band Unit HAE229 Instruments Reference
(1) (2) (3) (4) (5)
B mag 26.36 ± 0.68 FORS2 Koyama et al.(2013)
Y mag 23.62 ± 0.32 HAWK-I this paper
J mag 23.09 ± 0.03 MOIRCS Koyama et al.(2013)
H mag 22.26 ± 0.10 HAWK-I this paper
Ks mag 21.22 ± 0.08 HAWK-I this paper
Ks mag 20.86 ± 0.09 MOIRCS Doherty et al.(2010)
Ks mag 21.60 ± 0.02 MOIRCS Koyama et al.(2013)
S3.6 µm mag 19.85 ± 0.1 IRAC this paper
S4.5 µm mag 19.83 ± 0.1 IRAC this paper
S5.8 µm mag 19.85 ± 0.2 IRAC this paper
S8.0 µm mag 20.16 ± 0.2 IRAC this paper
S24.0 µm µJy 477.4 ± 5.0 MIPS Dannerbauer et al.(2014)
S100 µm mJy <4.5 PACS Dannerbauer et al.(2014)
S160 µm mJy 13.6 ± 4.0 PACS Dannerbauer et al.(2014)
S250 µm mJy 26.0 ± 2.8 SPIRE Dannerbauer et al.(2014)
S350 µm mJy 27.2 ± 2.9 SPIRE Dannerbauer et al.(2014)
S500 µm mJy 26.5 ± 2.7 SPIRE Dannerbauer et al.(2014)
S850 µm mJy 2.2 ± 1.4 SCUBA Stevens et al.(2003)
SCO(1−0) mJy 0.57 ± 0.06 ATCA this paper
ICO(1−0) Jy km s−1 0.22 ± 0.03 ATCA this paper
Table 3. Properties of HAE229.
Property HAE229 Reference
zCO(1−0) 2.1478 ± 0.0002 this paper
zHα 2.1489 Kurk et al.(2004b)
zHα 2.149 Doherty et al.(2010)
FWHMof CO(1−0) 359 ± 34 km s−1 this paper
FWHMof Hα 290 ± 60 km s−1 Kurk et al.(2004b)
L0
CO(1−0) 5.0 ± 0.7 × 10
10K km s−1pc2 this paper
LIR 3.2 × 10¹²L this paper
SFE 66 L K km s−1pc2 this paper
SFRPAH 880 M yr−1 Ogle et al.(2012)
SFRIR 555 M yr−1 this paper
SFRHα 389 M yr−1 Koyama et al.(2013)
SFRSED 35 ± 6 M yr−1 Doherty et al.(2010)
M? 3.7 × 10¹¹M
Koyama et al.(2013)
M? 5.1+1.5−2.0× 10¹¹M Doherty et al.(2010)
Mdust 3.5 × 10⁸M this paper
Mgas 1.8 ± 0.2 × 10¹¹M this paper
12+ log(O/H) 8.8 this paper
αCO(1−0) 4.0 M pc−2(K km s−1)−1 this paper
sSFR 1.1 Gyr−1 this paper
Mgas/M? 0.35−0.49 this paper
fmol 0.27−0.33 this paper
tdep 0.36 Gyr this paper
tdyn 0.12 Gyr this paper
tSFR 0.67−0.92 Gyr this paper
factor. The conversion factor depends on the gas-phase metal-licity and complex gas physics (see for a review Bolatto et al. 2013). Ignoring the complexities of determining the appro-priate conversion factor, we focus on using its metallicity dependence to constrain the conversion factor for HAE229.
Kurk et al. (2004b) find a log [NII]/Hα ratio of −0.47, typi-cal of star-forming galaxies at these redshifts (there is no evi-dence for a strong Active Galactic Nuclei (AGN) contribution;
Ogle et al. 2012;Koyama et al. 2013). The [NII]/Hα ratio im-plies a metallicity, 12+ log(O/H) ≈ 8.6−8.8 (Kurk et al. 2004b;
Pettini & Pagel 2004; Denicoló et al. 2002; Mannucci et al. 2010;Maier et al. 2014). We apply the gas-to-dust ratio method, “δGDR”, for estimating the CO-to-H2 gas conversion factor,
αCO(Leroy et al. 2011;Magdis et al. 2011,2012). This method
relies on an estimate of the dust mass for which we find Mdust=
3.5 × 10⁹M
(using the method ofCasey 2012). Using the
equa-tion log δGDR= (10.54 ± 1.0) − (0.99 ± 0.12) × (12 + log(O/H)) (Magdis et al. 2012), we estimate the CO-to-H2conversion
fac-tor, obtaining, αCO= 4.7−6.9 M pc−2(K km s−1)−1. The range
of αCO we give here depends on the method (Denicoló et al.
2002; Pettini & Pagel 2004; Mannucci et al. 2010). Using a metallicity-dependent conversion factor suggests that HAE229 is similar to local and distant normal main-sequence disk galaxies.
Given all of the uncertainties in estimating the conversion factor, it is not entirely clear whether basing an estimate directly
Fig. 6.Left panel: ratio of the CO emission and stellar mass in units of K km s−1pc−2 M−1
versus redshift. The solid and dotted line shows the
median and 1σ dispersion of this ratio for main-sequence galaxies with a mass of 5 × 10¹¹ M
. The mass we have chosen for this comparison is
approximately the stellar mass of HAE229. Right panel: molecular gas fractions and ±1σ dispersion (solid and dotted lines respectively) for main sequence galaxies at z= 2.2. The lines shown in both panels are from models discussed inSargent et al.(2014) to explain the evolution of the main sequence of galaxies. The red star represents the estimated position of HAE229 in both panels.
on the dust mass and metallicity is completely appropriate or ro-bust. Another way of estimating the conversion factor is to use an independent estimate of the gas mass and simply scale the CO luminosity to give the same gas mass. For example, we can use the empirical calibration of the long wavelength dust con-tinuum emission to estimate the total gas mass (Scoville et al. 2016). Using the 850 µm flux density, we find a total gas mass, Mgas ∼ 3 × 10¹¹ M . This estimate includes an unconstrained
contribution from HI, so this provides only an upper limit to the conversion factor and implies Mmol/L0CO(1−0)<∼ 6.
All of our estimates favor a relatively high CO conver-sion factor. HAE229 has a high infrared luminosity, it is an SMG (although the detection at 850 µm is not highly signif-icant). Many authors favor a low value of the conversion fac-tor for luminous infrared sources (0.8 M (K km s−1 pc2)−1;
Solomon & Vanden Bout 2005). With these caveats in mind, we adopt a conversion factor of four (typically for high-z disk-like galaxies, see e.g.,Daddi et al. 2010a), implying a total cold molecular gas mass, Mmol= 2.0 ± 0.2 × 10¹¹M . Adopting a low
value generally appropriate for luminous galaxies like HAE229 would lead to conflicts with other estimates of gas masses given previously which do not rely on the conversion factor directly (e.g.,Casey 2012;Scoville et al. 2016).
Using the adopted conversion factor and CO luminosity, we estimate a molecular gas fraction, fmol= Mmol/(Mmol+ M?), of
∼30% for HAE229. In Fig.6, we show the expected redshift evo-lution of the ratio between CO luminosity and stellar mass based on the empirical scaling relations for a typical main-sequence galaxy (seeSargent et al. 2014). HAE229 lies well on the pre-dicted relation for main-sequence galaxies at z= 2.2. The same applies when comparing HAE229 to the expected average vari-ation of the gas fraction with stellar mass for galaxies at the red-shift of HAE229 (Fig.6).
5.1.2. Timescales: Do the disk dynamics limit star formation in HAE229?
A quantitative way to obtain insights into the “mode of star for-mation” in galaxies is to derive their specific star-formation rate
and “star-formation efficiency”. If HAE229, for its stellar mass and redshift, is a typical main-sequence galaxy, we would ex-pect its star-formation rate, SFRMS≈ 460 M yr−1(Tacconi et al.
2013). We derived a far-infrared based star-formation rate of SFRIR= 550 M yr−1(Sect.4) which falls within 20% of SFRMS
at its redshift, that is, well within the 1-sigma scatter of the re-lation between SFR and stellar mass (e.g.,Magdis et al. 2012). HAE229 is a distant, massive main-sequence galaxy.
Our estimate of the star-formation rate (Sect.4) and molec-ular gas mass implies a gas depletion time, tdep ≈ 360 Myr5.
The range of star-formation rates that have been estimated for HAE229 implies a systematic uncertainty in the gas de-pletion time of about a factor of two. Our estimate for HAE229 is similar to the depletion times derived for star-forming galaxies at z = 1−3 that are not undergoing a major merger (Daddi et al. 2007;Genzel et al. 2010;Rodighiero et al. 2011), but are up to an order-of-magnitude higher than the typical depletion times derived for SMGs (Greve et al. 2005;
Tacconi et al. 2008;Ivison et al. 2011;Riechers et al. 2011), al-though Swinbank et al. (2006) do consider some exceptions. This is another indication that HAE229 is a normal high-z star-forming galaxy.
The dynamical time (rotational), tdyn = 2πr/(v/sin i) =
610 Myr × r10 kpc/(v/sin i)100 km s−1, where r10 kpc is the radius
in units of 10 kpc, (v/sin i)100 km s−1 is the inclination corrected
velocity in units of 100 km s−1, and i, is the inclination. In or-der to constrain the inclination, we estimate the rotation speed needed for the disk to be centrifugally supported, i <∼ 30◦, and (v/ sin i) ≈ 500 km s−1. At 10 kpc, the dynamical time is ∼120 Myr. But the gas may be extended over a region up to twice this large and thus, in the case of HAE229, tdep/tdyn≈ 2−3.
Find-ing that the gas depletion timescale is a factor of a few greater than the dynamical time is interesting in light of the gas distribu-tion relative to that of the on-going star formadistribu-tion in HAE229. The molecular gas appears to spread over a larger area than the stellar continuum. Thus it is clear that we must consider the role
5 We note that, if we adopt a lower CO-to-molecular gas mass
conver-sion factor, say αCO= 1, the gas depletion time for HAE229 would be
the high angular momentum of the extended disk plays in regu-lating future star formation. While we do not have the resolution to investigate the detailed kinematics of the disk, the fact that the gas distribution is so extended and has significant angular mo-mentum makes us wonder if it could be that HAE229 will not be able to support its on-going star formation for a gas-depletion timescale, but will use up the gas in the central regions most quickly. In this case, what limits the time over which intense star formation takes place is not when the gas over the disk is ex-hausted, but how long it takes for the gas to dissipate its angular momentum and to move from the outer to the inner disk. Perhaps it is the high angular momentum of the gas and the rate at which the extended gas in galaxies dissipates angular momentum that ultimately regulates the duration of intense star formation (see
Lehnert et al. 2015).
In order to sustain the SFR of HAE229 beyond a dynamical time, ≈500 M yr−1of gas must be accreted into its central
re-gion where the on-going intense star formation is concentrated. While there is a large reservoir of gas in the outskirts to feed the regions of growth in the inner disk, it must dissipate a significant amount of angular momentum, about a factor of two or more within a dynamical time. It is not clear how it would accomplish this feat, as there are no signs of a bar or an intense interaction with a companion galaxy. Asymmetries in the mass distribution which would generate torques on the gas enabling the extended gas to dissipation energy and angular momentum are not readily apparent (e.g.,Gavazzi et al. 2015). Given these circumstances, since a detailed analysis of this is beyond the scope of the paper, we simply raise the point that using the gas depletion time as an indicator of the duration of the star formation or its regulation is at best naive and at worst misleading. Higher resolution ob-servations of the molecular gas might allow us to investigate this idea in more detail. Finally, we note that analysis bySpilker et al.
(2015) shows that for a sample of distant galaxies with detection in the low-J CO lines, the CO emitting effective radii are larger than the effective radii of the star formation. Thus our claim that dynamical effects may be important in limiting the gas supply of galaxies could be generally true for the population of distant star-forming galaxies.
5.2. Previous detections of cold molecular gas in z > 0.4 cluster galaxies
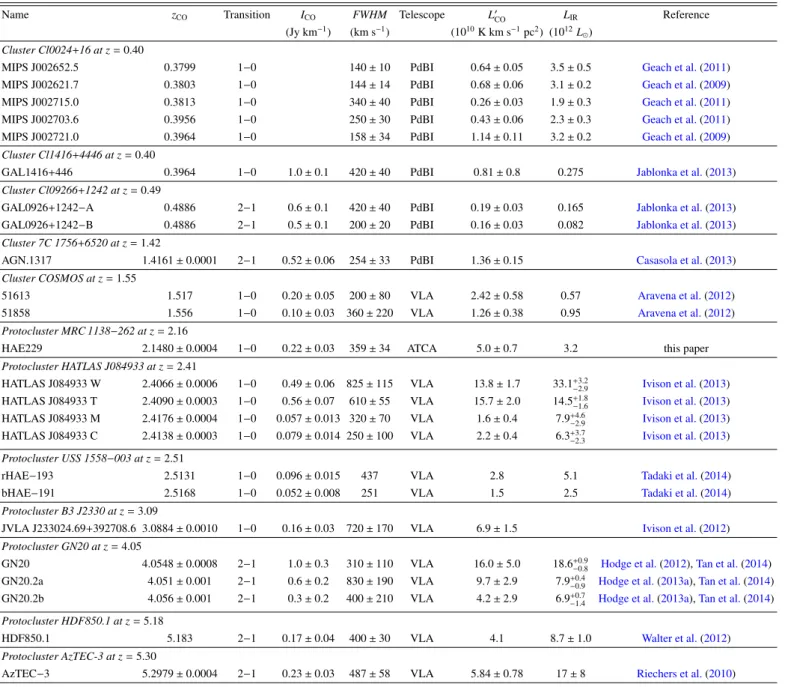
Motivated by the CO(1−0) detection of the protocluster mem-ber HAE229, it is interesting to investigate the dependency of the physical properties of the molecular gas in (proto)cluster galaxies beyond z ∼ 0.4, thus extending the previous study by
Jablonka et al.(2013) of molecular gas in clusters members to higher redshifts. Therefore, we searched the literature for pre-vious detections of cold molecular gas in (proto)cluster galax-ies at z > 0.4. We restrict our search exclusively to CO(1−0) or CO(2−1) detections as we want robust estimates of the total amount of molecular gas masses (cf.Casey 2016). Using high-order CO transitions, from CO(3−2) upwards, can lead to signifi-cant underestimates of the true gas mass (e.g.,Dannerbauer et al. 2009). High-order transitions trace the dense, high excitation gas closely associated with star-forming regions and feedback. The low-order transitions, CO(1−0) and CO(2−1)6, trace the lower density gas, which is a better estimate of a galaxy’s potential to form stars (e.g.,Ivison et al. 2011;Emonts et al. 2015a). In-cluding HAE229, we find 24 CO(1−0) and/or CO(2−1) bright
6 We assume a ratio of 1 between the CO(2–1) and CO(1−0)
luminosity.
galaxies in 12 different galaxy overdensities beyond z > 0.4: seven lie between 0.4 < z < 1.0, three between 1.0 < z < 2.0, seven between 2.0 < z < 3.0, one at z= 3.1, three at z = 4, and two beyond z= 5 (see TableA.1for details). Our (proto)cluster sample is dominated by high-z sources (cf.Jablonka et al. 2013). The environments probed are both clusters and protoclusters at different evolutionary stages. The number of detections of cold molecular gas is still low compared to field galaxies and none of these clusters has a large number of detections. The infrared lu-minosity of this sample ranges between LIR∼ 5−400 × 1011L .
Based on this compilation, we conclude that even high L0 CO
galaxies exist in high density fields (cf. Jablonka et al. 2013). Below z = 1 all of the cluster sources have a disk-like star-formation mode. Thus, we can extend the relation between LIR
and L0CO for cluster galaxies both in LIR and LCO0 compared to
Jablonka et al.(2013) who were restricted up to LIR < 1012 L
and L0 CO< 10
10K km s−1pc2. They concluded that the frequency
of high L0COgalaxies in clusters is lower than in the field imply-ing that the molecular gas content of massive galaxies depends on environment.
With our compilation of 24 detections beyond z > 0.4, we find that above this redshift, as we now discuss, the cluster en-vironment does not influence strongly the molecular gas content and other properties of galaxies in the early universe. We note that our sample at z > 0.4 is dominated by protoclusters mem-bers. Thus, there could be a bias in our compilation as high-z protocluster are, by definition, the early stages in the evolution of clusters (seeOverzier 2016, for more details on protoclusters).
5.2.1. CO(1–0) line width-luminosity relation
The baryonic Tully-Fisher (T-F) relation can be understood as a natural relationship between angular momentum and mass of centrifugally-supported disk galaxies. In the standard cosmolog-ical model, a Tully-Fisher relationship results naturally if the fraction of the angular momentum and mass of the baryons are both fixed fractions of the angular momentum and mass of the dark matter halos themselves (Mo et al. 1998). The classical Tully-Fisher relationship is measured using the rotation speed of the disk and the total stellar content or luminosity of the disk or total baryonic mass (e.g.,McGaugh & Schombert 2015). In a twist in the study of specific “T-F-like relations”,Bothwell et al.
(2013) found a relationship between CO luminosity, L0CO, and line width, FWHM, for SMGs (cf. Carilli & Walter 2013;
Sharon et al. 2016). Goto & Toft (2015) confirm this finding.
Bothwell et al. (2013) interpret this as a uniform ratio of the gas-to-stellar contribution to the dynamics of CO-bright regions. They model this trend as a relationship between the molecu-lar gas mass and the velocity necessary for centrifugal support of a rotating disk. These authors further suggest that the low scatter, lower than that expected for randomly inclined disks, is due to the fact that galaxies at high redshift are geometrically thicker than their low redshift counterparts and that the molecu-lar gas is a significant fraction of the total baryonic mass of the galaxies. Taking this relationship even further, despite its large scatter,Harris et al.(2012) andZavala et al.(2015) use this re-lation to de-magnify (cf.Aravena et al. 2016) Herschel-selected lensed high-z galaxies (Negrello et al. 2010;Vieira et al. 2013;
Messias et al. 2014).
Our discovery of a large rotating gas disk motivates us to investigate whether a Tully-Fisher relation exists for the CO emitting gas for a wider range of galaxies beyond just SMGs. Here we include high-z disk-like galaxies and search for
differences between field and cluster galaxies. A difference is to be expected because additional processes operate in environ-ments with higher galaxy and inter-galactic gas densities (e.g.,
Jablonka et al. 2013).
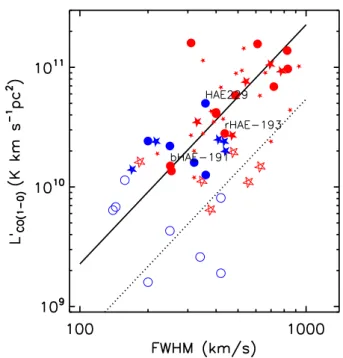
Our sample of (proto)cluster galaxies is a mix of disks and starbursts culled from the literature (see Table A.1). We find that most of the cluster sources beyond z = 0.4 follow the same L0
CO−FWHM relation as found for SMGs over the
same redshift range (Bothwell et al. 2013; Goto & Toft 2015), but some of the galaxies in our sample lie below this relation (Fig.7; see alsoCarilli & Walter 2013). Interestingly, the clus-ter galaxies below the relation are at low-z and overlap with the Herschel (ultra)-luminous infrared-galaxies ((U)LIRGs) field sample at intermediate redshifts (Magdis et al. 2014). In ad-dition, we show unlensed, high-z field galaxies detected in CO(1−0) (Ivison et al. 2011; Bothwell et al. 2013) and normal star-forming galaxies selected via three color imaging (B-, z-, and K-band imaging – BzK galaxies;Daddi et al. 2004) that are detected in CO(1−0) and/or CO(2−1) (Daddi et al. 2008,2010a;
Aravena et al. 2010, 2014). Overall, we find that both normal SFGs and dusty starbursts at high-z follow the same relation as SMGs (Bothwell et al. 2013), while low- and intermediate-redshift ULIRGs perhaps have a weak trend offset from the high-z trend.
It is interesting that the SMGs and the disk galaxies in the field and protocluster environments appear to follow the same approximate relation. The explanation inBothwell et al.(2013) of L0CO–FWHM trend for distant galaxies is based on the argu-ment that the galaxies in this relation are centrifugally-supported disks and the molecular gas constitutes a large fraction of the to-tal mass. However,Bothwell et al.(2013) made two assumptions that may not be appropriate for all the galaxies on this relation. They assumed a conversion factor of 1 M (K km s−1pc2)−1and
a radius of 7 kpc to make the relation match the data. If the disks have a radius of a factor of 1.9 times higher than starbursts and a higher αCOthen the two relations, the ones for high and low
redshift, would be the same. SMGs and normal SFGs may have the same parent population (e.g., Hayward et al. 2011, 2012;
Béthermin et al. 2015), a finding that can perhaps be explained by a variation in the gas fraction: the gas fraction decreases with the total galaxy mass at a given redshift and decreases with de-creasing redshift at a given total mass (e.g.,Sargent et al. 2014). Since the baryons dominate the potential within the stellar mass distribution of halos, for a galaxy at a given baryonic mass (meaning constant FWHM if the gas motions are virialized), the gas fraction will decrease for galaxies with higher stellar mass (e.g., Sargent et al. 2014). Thus, we may expect the zero-point of the L0CO–FWHM to decrease with decreasing redshift (if such a relation exists at all at lower redshifts).
The most interesting finding in this analysis, however, is not the significance of the trend, but that we do not find any di ffer-ence between cluster and field galaxies in the FWHM–L0
COplane
for high-redshift sources. The trend is independent of the envi-ronment for the galaxies in these samples. This implies that for both field and (proto)cluster galaxies their gas content (gas as a total fraction of their total baryonic content) and dynamics are, within a wide scatter, similar. At lower redshifts,Jablonka et al.
(2013) found that the field and cluster galaxies have different gas content for the equal stellar mass. This suggests that what ever processes dominate the regulation of the gas content of galax-ies in low-redshift clusters do not operate as efficiently at red-shifts >∼0.5−1.
However, intermediate-z sources do not follow this rela-tion. Why? ULIRGs, the powerful infrared emitters at low and
Fig. 7.Relation between FWHM of the CO(1−0) line and L0
COfor
clus-ter (circles) and field galaxies (stars). High-redshift sources, those with z> 1, are indicated by filled symbols while sources with z < 1 are indi-cated by hollow ones. The color-coding used in the figure is as follows: intermediate-z ULIRGs (red hollow starsMagdis et al. 2014), normal SFGs at z = 1.5 (blue filled stars Daddi et al. 2010a;Aravena et al. 2014), and SMGs (large and small red filled stars from Ivison et al. 2011;Bothwell et al. 2013, respectively). References for cluster sources can be found in Sect.5.2and TableA.1. The mode of star formation for each source is color-coded as blue for “disk-like” and red for “star-burst”. The solid line shows the relation fromBothwell et al.(2013). The dashed line assumes the typical radius for disk galaxies. Both high-zpopulation, dusty starbursts, and disk-like galaxies show a unique cor-relation between CO luminosity and line width with significant scatter (∼0.3 dex).
intermediate redshifts, are dominated by systems with strong random, non-virialized motions. Some SMGs, on the other hand, appear to have dynamics that are ordered, perhaps virialized (e.g., GN20;Hodge et al. 2012,2013a) whether or not they lie in clustered environments. This agrees with the fact that SMGs are not simply scaled-up versions of local and intermediate-redshift ULIRGs (e.g.,Swinbank et al. 2014).
5.2.2. Integrated Schmidt-Kennicutt relation
To further investigate whether or not being located in a galaxy overdensity has an impact on the gas content and star-formation rate of galaxies, we now study the relationship between star-formation rate and gas content – the integrated Schmidt-Kennicutt relation. The ratio of the SFR and Mmolcan be thought
of as a star-formation efficiency, that is, the conversion efficiency of gas into stars. We can cast this relationship directly between two observational quantities, one which is proportional to the SFR, the infrared luminosity, LIR, and the other, to the mass of
molecular gas, the CO luminosity, L0
CO(1−0). If the conversion
be-tween LIRand the SFR, and the conversion between L0CO(1−0)and
the gas mass does not depend on the characteristics of the galax-ies themselves, then this ratio, LIR/L0CO(1−0), will be proportional
to the “star-formation efficiency”. Any differences found would then be attributable to the differences in the conversion between CO luminosity and the gas mass, αCO(1−0), which would
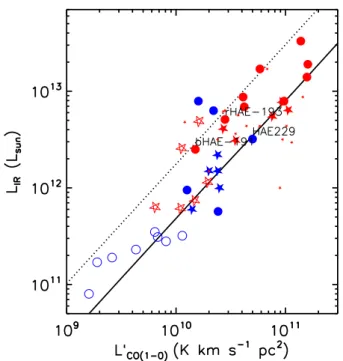
Fig. 8. Relationship between LIR and L0CO – the integrated
Schmidt-Kennicutt law – from our compilation of CO-bright galaxies lying in overdensities or protoclusters (circles, same encoding as in Fig.7; Table A.1). The three CO-bright HAEs are indicated individually. HAE229 is clearly separated from the two other HAEs with CO detec-tions (Tadaki et al. 2014), potentially indicating that red and blue HAEs have a wide range of CO luminosities. Small numbers of HAE with CO detections prohibit us from deciding if this is a real astrophysical effect. Solid and dashed lines are the best-fitting relations for normal star-forming and starburst galaxies (Sargent et al. 2014). At least within this small sample, no clear bi-modality in the star-formation efficiency is observed (cf.Daddi et al. 2010b;Genzel et al. 2010).
characteristics of the galaxies themselves. Alternatively, if there are not such dependencies in αCO(1−0), any differences may be
attributable to the rate at which gas is converted into stars, that is, the “star-formation efficiency”.
Several studies have found a bi-modality in the inte-grated Schmidt-Kennicutt relation (e.g., Daddi et al. 2010b;
Genzel et al. 2010). This bi-modality has been attributed to star-burst galaxies having a higher star-formation efficiency than normal galaxies. This is despite having conversion factors that would suggest that starburst galaxies are less gas-rich in pro-portion to their CO luminosities. In Fig. 8, we investigate the LIR/L0CO ratio for our compiled CO-bright cluster sample,
intermediate-z ULIRGs (Magdis et al. 2014), normal SFGs at z = 1.5 (Daddi et al. 2010a), and SMGs (Ivison et al. 2011;
Bothwell et al. 2013)7. We find that HAE229 lies on the relation of disk-like galaxies whereas the other CO(1−0) detected HAEs (Tadaki et al. 2014) lie on the starburst relation (Sargent et al. 2014). At infrared luminosities below LIR = 2 × 10¹² L ,
al-most all galaxies follow the disk-like star-formation relation. Above this luminosity both relations, “disk-like” and “starburst”, are populated. Interestingly, as previously pointed out, SMGs do not follow only the relation for ULIRGs and dusty star-bursts but also lie at the region expected for disk-like galaxies (e.g., Swinbank et al. 2011; Hodge et al. 2012), demonstrating
7 We note that in the absence of CO(1−0) observations,Bothwell et al.
(2013) converted measurements of transitions higher than or equal to CO(2–1) into the CO(1−0) transition.
that this source population is not homogeneous (Hayward et al. 2011,2012). Our analysis suggests that the simple dichotomy in the galaxy population based only on the star-formation ef-ficiency is perhaps more complex than previous interpretations (e.g.,Daddi et al. 2010b;Genzel et al. 2010). We do not find a difference of the LIR and L0COrelation between cluster and field
galaxies. We therefore conclude, with the present data quality, that lying in a denser environment at high redshifts does not sig-nificantly alter the star-formation efficiency or the molecular gas excitation conditions in galaxies.
5.2.3. Are the environmental drivers of galaxy evolution efficient in the early Universe?
We have found that for gas-rich galaxies with redshifts larger than about 0.4, there does not appear to be an environmental de-pendence for the gas content, the star-formation efficiency, or on excitation conditions of the diffuse molecular gas as probed by low-order CO line transitions. This finding could be a sign that typical physical processes in local clusters that are respon-sible for depleting the content and altering the physical condi-tions of the gas in galaxies, like harassment, tidal stripping, and ram-pressure stripping (Moore et al. 1996;Vollmer et al. 2001b;
Gnedin 2003a,b; Boselli & Gavazzi 2014) do not operate ef-ficiently at high redshift (Jablonka et al. 2013; Husband et al. 2016). At higher redshift, for a given cluster mass, the inter-nal galaxy-galaxy velocity dispersions of a protocluster will be higher than for local clusters. The galaxies surrounding the ra-dio galaxy have extremely high relative projected velocities, of the order of 1000 km s−1, suggesting that the protocluster is
al-ready massive (Kuiper et al. 2011). The processes that are likely to affect both the gas content and evolution of galaxies in clus-ters have very different dependences on the relative velocity of a galaxy as it moves through the population of cluster galax-ies and cluster potential (e.g.,Moore et al. 1996;Vollmer et al. 2001b; Gnedin 2003a,b). Both the harassment and tidal strip-ping rates are significantly lower if the galaxy, (1) has no close companions with small relative velocity; (2) has a high veloc-ity relative to the mass center of the cluster; or (3) is not moving through regions of the cluster with a high galaxy volume density. In the case of HAE229, it has a high projected velocity relative to the radio galaxy which, if we assume it represents the cen-ter of mass of the cluscen-ter, implies that strong tidal stripping is very unlikely. It is also at a relatively large projected separation, about 250 kpc. While small compared to the likely virial radius of a massive dark matter halo at z ∼ 2 (see Kuiper et al. 2011, and references therein), it means that HAE229 does not feel the influence of the total mass of the cluster. Also at high velocities, the timescale for harassment by other galaxies is very short and thus unlikely to be very effective in removing gas. These effects will be further reduced if protocluster galaxies have not yet viri-alized (Kuiper et al. 2011) and, at least in the case of HAE229, have yet to make their closest approach to the center of the pro-tocluster potential.
However, the high velocity of HAE229 relative to the radio galaxy (∼1200 km s−1;Emonts et al. 2013) should, in principle, lead to very efficient ram pressure stripping. Ram pressure strip-ping is proportional to average gas volume density, hρwiv
multi-plied by the square of relative velocity of the galaxy in the poten-tial, v2rel. The volume-averaged gas density is hρgasiv= φgas,vρgas,
where φgas,vis the gas volume-filling factor and ρgasis the
den-sity of the gas responsible for stripping the galaxy. The key to ram pressure operating effectively is for the gas within the clus-ter potential to have both a relatively high density and high filling
factor (e.g.Gnedin 2003b, models assume a high volume filling factor, φgas,v = 1 for hot halo gas and thus neglect this term).
The ram pressure must overcome the restoring force provided by the gravitation potential at the disk’s surface. The higher ve-locities of galaxies in high-redshift (proto)clusters compared to low-redshift clusters8, for a constant mass, suggest that the im-pact of ram pressure stripping should be enhanced, not dimin-ished, in distant clusters. Gas at high temperatures dominate the intra-cluster medium (ICM) and the mass budget of low-redshift clusters (e.g.,Laganá et al. 2013). The hot ICM gas has densi-ties of ∼10−3to 10−1cm−3, temperatures of ∼107to 108K, and a
near unity filling factor (e.g., Sanderson et al. 2009). The den-sities, unity filling factor, and high velocity dispersion of the galaxies is why ram pressure stripping is so effective in low-redshift clusters (e.g., Vollmer et al. 2001a,b; Fumagalli et al. 2014;Boselli et al. 2014,2016). The near unity filling factor of the hot gas means that, as the galaxy is moving through the ICM, it feels a steady wind of material with slowly varying density de-pending on where it is relative to the cluster center. Since we do not find a strong impact on the gas content like that seen in local cluster galaxies, it must be that the dominant gas phase in distant protoclusters either has a density which is much less but still has a filling factor of unity, or that it has a much lower volume filling factor than in local clusters.
The ram pressure due to the ICM is counterbalanced by the restorative force of the disk’s gravitational potential. The restora-tive force is proportion to the radial distribution of the combined stellar and gaseous surface mass density. In other words, galaxies with compact and roughly equal gaseous and stellar mass surface densities have maximal restoring forces and are resistant to ram pressure stripping. But galaxies at high redshift, and HAE229 in particular, have very extended gas distributions. The disk of HAE229 extends well beyond its stellar light. We would expect its outer gas disk to be easily stripped. For that matter, even tidal stripping should be effective in such extended disks. Why has HAE229 not been stripped? Again, this would be consistent with the mass content of the IGM of high-redshift clusters not having a high-volume filling factor gas of sufficient volume-weighted density. While we use the detailed properties of HAE229 to in-vestigate the impact of environmental processes on the gas prop-erties of galaxies, Figs. 7 and8 suggest that HAE229, at least within this context, is not unusual or special.
While it is beyond the scope of this paper to quantitatively constrain the characteristics of the ICM in high-redshift proto-clusters, there are a number of studies of how the ICM may develop. What we are suggesting here is that the mass distri-bution of the (proto)ICM at high redshift contains a signifi-cant fraction of low volume filling factor warm, ∼104 K, and cold, ∼10 K, gas. Accreting gas into massive halos alone does not explain the entropy profiles of the ICM of local clusters, even in the absence of cooling (e.g.,Voit et al. 2005). It is clear that feedback from active galactic nuclei and star formation in cluster galaxies is necessary to provide sufficient entropy and heating to globally balance the cooling (Best et al. 2006). How-ever, the energy and momentum injection from AGN, such as from the radio galaxy MRC 1138−262, is perhaps heating the
8 The cluster velocity dispersion, σ, scales as the virial velocity,
(GMv/rv)1/2, where Mv and rv are the virial mass and radius,
respec-tively. This relation scales as (∆(z)/2)1/6(GH(z) M
v)1/3, where the mean
density of the halo is∆(z) halo times the critical density, H(z) is the Hub-ble constant, and G is the gravitational constant.∆(z) increases slowly with increasing z, the Hubble constant H(z) increases rapidly with z, and thus so does the velocity of galaxies in halos of constant virial mass as a function of redshift.
gas, but also induces substantial cooling and dissipation (e.g.,
Emonts et al. 2014,2015b,2016;Voit et al. 2015;Meece et al. 2015; Gullberg et al. 2016). Specifically, the large scale envi-ronment of MRC 1138−262 has a substantial Lyα emitting halo (Pentericci et al. 1997) and a significant mass of cold molecular gas (Emonts et al. 2016). Despite it being likely to have rela-tively high densities, ∼0.01−1 cm−3and ∼100−1000 cm−3, the
volume filling factors of both these phases are undoubtedly mi-nuscule ( 0.1). Instead of being a continuous wind of low den-sity hot gas as in local clusters, these would be more like an intermittent shotgun blast of cold dense clouds. Under such cir-cumstances the concept of ram pressure is completely inappro-priate. The ISM of the galaxy does not feel a constant force of the fluid as is assumed in the relation between ram pressure and the gravitational restoring force (Gunn & Gott 1972). There of course could still be a diffuse high-volume filling factor hot gas, but its density must be substantially lower than that in local clus-ters (Carilli et al. 2002). More work theoretically and observa-tionally is needed to understand our results (Emonts et al. 2016), but the very extended CO disk of HAE229 is already yielding fascinating clues as to the structure of early intra-cluster media in protoclusters.
6. Conclusion
We have presented the most detailed CO(1−0) observations to date for a distant, zCO = 2.1478, normal star-forming galaxy.
We detect the cold molecular gas reservoir of the Hα emitter #229 in very deep observations with the ATCA. Interestingly, a significant fraction of the CO emission lies outside the rest-frame UV/optical emitting galaxy. The physical properties of HAE229 indicate that this source lies on the main sequence of galaxies and its relatively long gas depletion time and disk morphology suggest that it is the first CO(1−0)-bright HAE with a “quiescent mode” of star-formation.
In order to study the environmental dependency of the gas fraction at high redshifts, we compiled a sample of 24 high-z (proto)cluster members from the literature. We do not find any environmental dependence suggesting that usual physical pro-cesses seen in local clusters such as harassment, tidal stripping, and ram-pressure stripping do not operate efficiently at high red-shift in over-dense environments.
In addition, we extend the relation between L0
COand FWHM
of the CO line previously valid for starbursts (Bothwell et al. 2013) to gas-rich main-sequence galaxies beyond z = 1. Our analysis of the integrated Schmidt-Kennicutt law indicates that the proposed dichotomy between starbursts and disk galaxies is perhaps more complex than known heretofore.
Finally, we stress that the number of CO detections of (proto)cluster galaxies in the distant universe is still very low compared to field galaxies. In order to understand the influence of the environment on the molecular gas reservoirs and star-formation efficiency, systematic surveys of (proto)cluster galax-ies beyond z= 1 in low-order CO lines must be conducted.
Acknowledgements. The Australia Telescope Compact Array is funded by the Commonwealth of Australia for operation as a National Facility managed by CSIRO. The authors wish to express their sincerest thanks to the staff of the CSIRO for their assistance in conducting these observations and to the pro-gram committee for their generous allocation of time and continuing support for our research. The National Radio Astronomy Observatory is a facility of the National Science Foundation operated under cooperative agreement by As-sociated Universities, Inc. We thank the anonymous referee for her or his comments that helped us to improve our arguments and presentation in this