HAL Id: hal-01588695
https://hal.inria.fr/hal-01588695
Submitted on 16 Sep 2017
HAL is a multi-disciplinary open access
archive for the deposit and dissemination of
sci-entific research documents, whether they are
pub-lished or not. The documents may come from
teaching and research institutions in France or
abroad, or from public or private research centers.
L’archive ouverte pluridisciplinaire HAL, est
destinée au dépôt et à la diffusion de documents
scientifiques de niveau recherche, publiés ou non,
émanant des établissements d’enseignement et de
recherche français ou étrangers, des laboratoires
publics ou privés.
Greyscale Image Vectorization from Geometric Digital
Contour Representations
Bertrand Kerautret, Phuc Ngo, Yukiko Kenmochi, Antoine Vacavant
To cite this version:
Bertrand Kerautret, Phuc Ngo, Yukiko Kenmochi, Antoine Vacavant. Greyscale Image
Vectoriza-tion from Geometric Digital Contour RepresentaVectoriza-tions. DGCI’17 - 20th InternaVectoriza-tional Conference on
Discrete Geometry for Computer Imagery, Sep 2017, Vienna, Austria. pp.2379 - 331,
�10.1007/978-3-319-66272-5_26�. �hal-01588695�
2 LIGM, UMR CNRS 8049, Université Paris-Est, 77454 Marne-la-Vallée, France 3
Institut Pascal, Université Clermont Auvergne, UMR6602 CNRS/UCA/SIGMA, F-63171 Aubière, France
Abstract. In the field of digital geometry, numerous advances have been
recently made to efficiently represent a simple polygonal shape; from dominant points of a curvature-based representation, a binary shape is efficiently represented even in presence of noise. In this article, we exploit recent results of such digital contour representations and propose an image vectorization algorithm allowing a geometric quality control. All the results presented in this paper can also be reproduced online.
1
Introduction
Image vectorization is a classic problem with potential impacts and applications in computer graphic domains. Taking a raw bitmap image as input, this pro-cess allows us to recover geometrical primitives such as straight segments, arcs of circles and Bézier curved parts. Such a transformation is exploited in design softwares such as Illustrator or Inkscape in particular when users need to import bitmap images. This domain is large and also concerns document analyses and a variety of graphical objects such as engineering drawings [?], symbols [?], line drawings [?], or circular arcs [?]. Related to these applications, different theo-retical advances are regularly proposed in the domains of pattern recognition and digital geometry. In particular, their focus on digital contour representa-tions concerns various methodologies: dominant point detection [?,?], relaxed straightness properties [?], multi-scale analysis [?], irregular isothetic grids and meaningful scales [?] or curvature-based approach [?].
These last advances are limited to digital shapes (i.e. represented within a crisp binary image). Indeed, even if a digital contour can be extracted from a non-binary image, their adaptation to other types of images such as greyscale and color images is not straightforward. There are other methods, which are designed to handle greyscale images; for example, Swaminarayan and Prasad proposed a method to vectorize an image by using its contours (from simple Canny or Sobel filters) and by performing Delaunay triangulation [?]. Despite its interest, the proposed approach does not take into account the geometrical characteristics of edge contours and other information obtained from low intensity variations. More oriented to segmentation methods, Lecot and Levy introduced an algorithm
based on Mumford and Shah’s minimization process to decompose an image into a set of vector primitives and gradients [?]. Inspired from this technique, which includes a triangulation process, other methods were proposed to represent a digital image by using a gradient mesh representation allowing to preserve the topological image structure [?]. We can also mention the method proposed by Demaret et al. [?], which is based on linear spline over adaptive Delaunay triangulation or the work of Xia et al. [?] exploiting a triangular mesh followed of Bézier curves patch based representation. From a more interactive process, the vectorization method of Price and Barrett [?] was designed for interactive image edition by exploiting graph cut segmentation and hierarchical object selections. In this article, we propose to investigate the solutions exploiting the geometric nature of image contours, and apply these advanced representations to handle greyscale images. In particular, we will mainly focus on recent digital-geometry based approaches of different natures: (i) the approach based on dominant point detection by exploiting the maximal straight segment primitives [?,?], (ii) the one from the digital level layers with the algorithms proposed by Provot et al. [?,?], (iii) the one using the Fréchet distance [?,?], and (iv) the curvature based polygonalization [?].
In the next section (Sect. ??), we first present a strategy to reconstruct the image by considering the greyscale image intensities. Different strategies are presented with pros and cons. Afterwards, in Sect. ??, we recall different polygo-nalization methods. Then, we present the main results and comparisons obtained with different polygonalization techniques (Sect. ??).
2
Vectorizing Images from Level Set Contours
The proposed method is composed of two main steps. The first one is to extract the level set contours of the image. This step is parameterized by the choice of the intensity step (δI), which defines the intensity variations from two consecutive intensity levels. From these contours, the geometric information can then be extracted and selected by polygonalization algorithms (as described in Sect. ??). The second step concerns the vectorial image reconstruction from these contours.
Step 1: Extracting level set contours and geometrical information
The aim of this step is to extract geometrical information from the image intensity levels. More precisely, we propose to extract all the level set contours by using different intensity thresholds defined from an intensity step δI. For this purpose, we apply a simple boundary extraction method defined from an image intensity predicate and from a connectivity definition. The method is based on the definition of the Khalimsky space and can work in N dimension [?]. This algorithm has the advantage to be implemented in the DGtal library [?] and can be tested online [?].
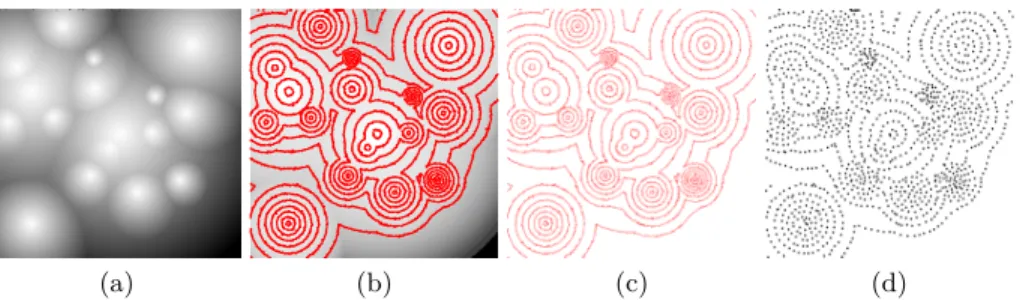
Figure ?? illustrates such a level set extraction (Fig. ?? (b,c)) with a basic contour sampling defined from a point selection taken at the frequency of 20 pixels (Fig. ?? (d)). Naturally, the more advanced contour polygonalization
al-(a) (b) (c) (d)
Fig. 1. Extraction of the level set contours (b,c) from the input image (a) and sampling
resulting contours (d)
gorithms, as described in section Sect. ??, will be exploited to provide better contours, with relevant geometrical properties.
Step 2: Vectorial Image Reconstruction
We explore several choices for the reconstruction of the resulting vectorial images: the application of a triangulation based process, a reconstruction from sequence of intensity intervals, and a component tree representation.
Representation from Delaunay triangulation: A first solution was inspired
from the method proposed by Swaminarayan and Prasad [?], which uses a De-launay triangulation defined on the edges detected in the image. However the strategy is different since the triangulation is performed after an extraction of the main geometric features like dominant points, curvature or Fréchet distance. The first direct integration of the triangulation was performed by using the Triangle software [?] and by reconstructing the image with the mean intensity represented in the triangle barycenter. Though, even if such strategy appears promising, the quality is degraded if we have a closer view to the digital structure, as illustrated for the DGCI logo in Fig. ??. To obtain a better quality of image reconstruction, the level set intensity has to be integrated into the reconstruction structure in order to make a better decision for the triangle intensity value.
Representation by filling single intensity intervals: The filling of the
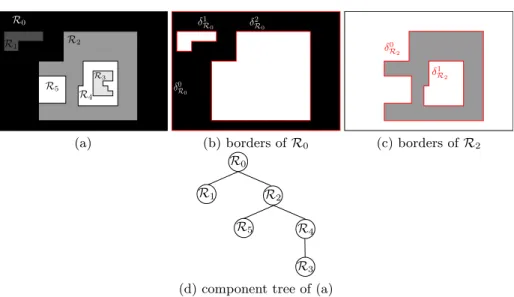
polygonal region boundaries of the input image could be a possibility to ob-tain a better image reconstruction. For instance, the image in Fig. ?? (a) can be reconstructed by filling inside the region R0defined from its borders (δR00, δ
1 R0,
and δ2R0) and in the same way for the other regions R1, R2, R3, R4 and R5.
However, such a strategy may depend on the quality of the polygonalization, which has no guarantee to generate the polygonal contours with correspondence between the polygon vertices (according to the border of the current region and the border of their adjacent region). For instance, the vertices of the polygonal representations of δ2
R0 and δ
0
R2 do not necesarily share the same vertices. Such
limitations are illustrated in the Fig. ?? (a-e) where numerous defects are present with null-color areas which are not filled by any color.
(a) (b) (c)
(d) (e) (f)
Fig. 2. Illustration of the Delaunay based reconstruction from sampled level set
con-tours: resulting mesh representation (a-c) and final vectorial rendering (d-f)
Component tree based representation: To overcome the limitations of the
previous reconstruction, we propose to exploit a mathematical morphology based representation defined on the component tree [?,?]. This method allows to repre-sent an image by considering the successive intensity levels and by maintaining the tree representing inclusions of connected components. As an illustration, Fig. ?? (d) shows such a representation with the root R0 associated to the first
level; it contains all the pixels of the image (with values higher or equal to 0). The edge between the nodes R4and R2indicates that the region R4is included
in the region R2.
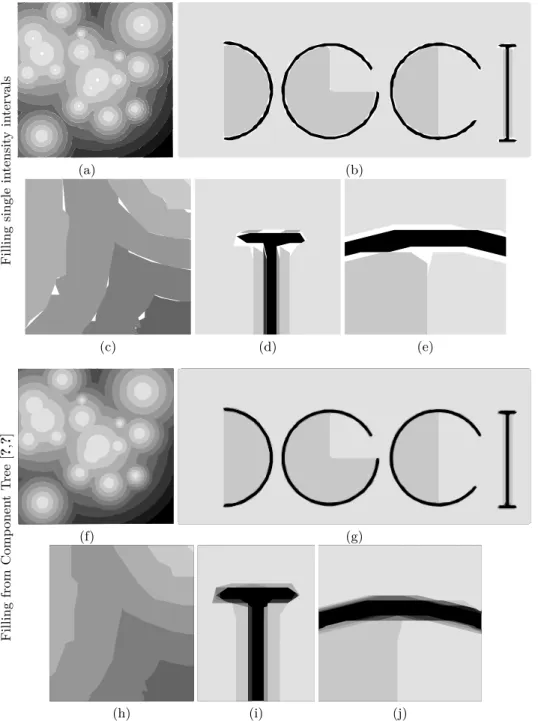
With such a representation, each region is -by definition- included in its an-chors and as a consequence a reconstruction starting from the root region can be executed without any non-filled areas (even with poor-quality polygonaliza-tion algorithms). As shown in Fig. ?? (f-j), the reconstrucpolygonaliza-tion results have no empty-color region.
Algorithm ?? describes the global process of the proposed method where we can use the different polygonalization methods that are detailed in the next section.
3
Overview of Polygonalization Methods
In the proposed vectorization method, the polygonalization step can play an important role in the resulting image quality. Before showing some results, we overview several methods with different principles.
Filling single in tensit y in terv als (a) (b) (c) (d) (e) Filling from Comp onen t T ree [? ,? ] (f) (g) (h) (i) (j)
Fig. 3. Comparisons of the quality of the two reconstructions types: single intensity
(a) (b) borders of R0 (c) borders of R2
(d) component tree of (a)
Fig. 4. Image border extraction from a simple intensity predicate (images (a-c)) and
illustration of its component tree representation
Algorithm 1 Algorithm to vectorize a bitmap image based on component tree
representation and polygonalization algorithm.
Input
Image2D im . The input bitmap image.
Int iStep . Intensity step.
polygonalizationAlgo(cnt) . Polygonalization algorithm, which takes as input a contour and return a list of polygon vertices.
Output
VectorialImage vectIm . Resulting vectorial image
Begin
for i = 0; i < 255 − iStep; i = i + iStep do
listCnt = ExtractAllCnt(0, iStep) . Extract all contours of connected
regions with pixel predicate: I(p) >= i
for all contour cnt in listCnt do
polygonalizationAlgo(cnt) addToImageVector(vectIm, cnt)
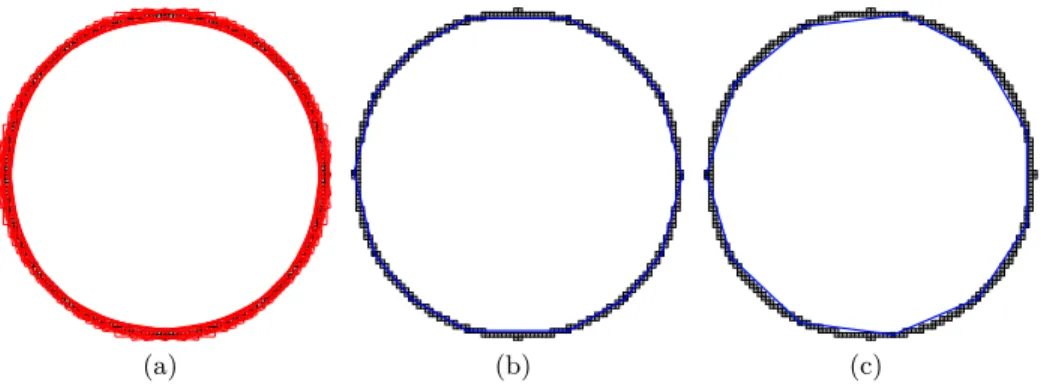
structure is widely used for studying geometrical characteristics of a discrete curve. More precisely, the width ν tangential cover of a contour is composed of a sequence of all maximal blurred segments of width ν [?] along the contour. Using this structure, a method proposed in [?,?] detects the dominant points of a contour. The key idea of the method is that the candidates to be dominant points are located in common zones of successive maximal blurred segments. By a simple measure of angle, the dominant point in each common zone is determined as the point having the smallest angle with respect to the left and right endpoints of the left and right maximal blurred segments constituting the common zone. Then, the polygon representing the contour is constructed from the detected dominant points (see Fig. ??(b)). In the next section the acronym DPP will refer to this method.
(a) (b) (c)
Fig. 5. (a) Width 2 tangential cover of a curve. (b) Dominant points detected on the
curve in (a) and the associated polygonal representation. (c) Polygonalization result based on Fréchet distance
3.2 DLL based polygonalization [?,?]
A method of curve decomposition using the notion of digital level layers (DLL) has been proposed in [?,?]. Roughly speaking, DLL is an analytical primitive which is modeled by a double inequality −ω ≤ f (x) ≤ ω. Thanks to this analytic model of DLL, the method allows a large possible classes of primitives such as lines, circles and conics.
Based on a DLL recognition algorithm, the method consists in decomposing a given curve into the consecutive DLL and, by this way, an analytical represen-tation of the curve is obtained. Fig. ?? illustrates the DLL decomposition using
line, circle and conic primitives. As the shape contains many line segments and arcs, the decompositions based on circle and conic primitives uses less primitives than the one with line primitives.
Source Line primitives (127 primitives)
Circle primitives (86 primitives) Conic primitives (80 primitives)
Fig. 6. Decomposing results of DLL based method using different primitives
3.3 Fréchet based polygon representation
Using the exact Fréchet distance, the algorithm proposed in [?,?] computes the polygonal simplification of a curve. More precisely, given a polygonal curve P , the algorithm simplifies P by finding the shortcuts in P such that the Fréchet distance between the shortcut and the associated original part of the curve is less than a given error e. As a consequence, this method guarantees a minimum number of vertices in the simplified curve according to the Fréchet distance and a maximal allowed error e (see Fig. ??(c)).
3.4 Visual curvature based polygon representation
The method was introduced by Liu, Latecki and Liu [?]. It is based on the mea-sure of the number of extreme points presenting on a height function defined from several directions. In particular, the convex-hull points are directly visible as extreme points in the function and a scale parameter allows to retain only the extreme points being surrounded by large enough concave or convex parts. Thus, the non significant parts can be filtered from the scale parameter. The main advantage of this estimator is the feature detection that gives an interest-ing multi-scale contour representation even if the curvature estimation is only qualitative. Figure ?? illustrates some examples.
Source Scale 2 Scale 8 Scale 16 Scale 30
Fig. 7. Illustration of the visual curvature obtained at different scales
4
Results and Comparisons
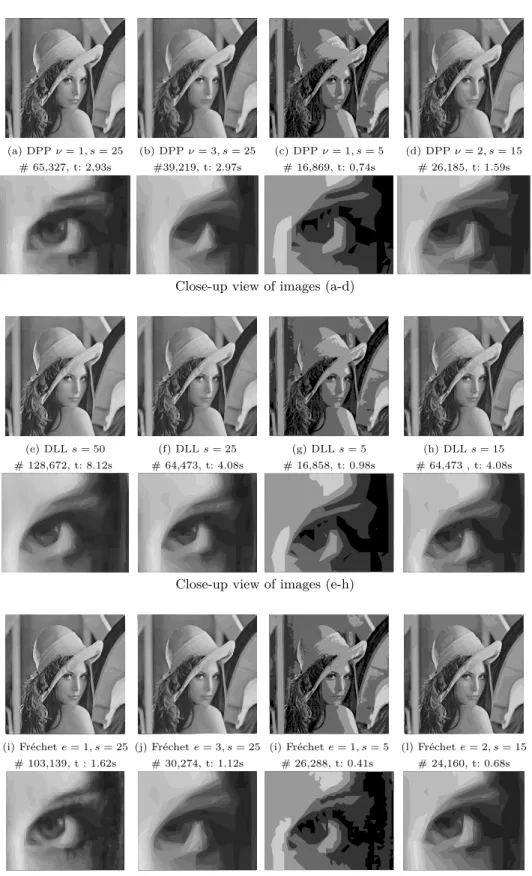
In this section, we present some results obtained with the proposed method using the previous polygonalization algorithms. Figure ?? shows the results with their execution times (t) in link to the number of polygon points (#). The comparisons were obtained by applying some variations on the scale parameter (when exists:
ν for DPP, e for Fréchet) and on the intensity interval size s (s = 255/iStep,
with iStep of Algorithm 1). From the presented results, we can observe that the Fréchet polygonalization methods provides a faster reconstruction but contains more irregular contours. By comparing DLL and DPP, the DLL looks, at low scale, slightly smoother than the others (Fig. ?? (a) and (f)). The execution time mainly depends of the choice of the input parameter s and the choice of the method (see time measure given in Fig. ??). Due to page limitation the results obtained with the visual-curvature based polygonalization method are not presented but they can be obtained from an Online demonstration available at:
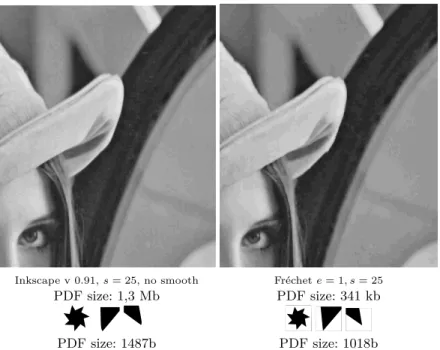
http://ipol-geometry.loria.fr/~kerautre/ipol_demo/DGIV_IPOLDemo/ To conclude this section we also performed comparisons with Inkscape, a free drawing software [?] (Fig. ??). We can observe that our representation provides fine results, with a lighter PDF file size.
5
Conclusion and Perspectives
Exploiting recent advances from the representation of digital contours, we have proposed a new framework to construct a vectorial representation from an in-put bitmap image. The proposed algorithm is simple, can integrate many other polygonalization algorithms and can be reproduced online. Moreover, we pro-pose a vectorial representation of the image with a competitive efficiency, w.r.t.
(a) DPP ν = 1, s = 25 (b) DPP ν = 3, s = 25 (c) DPP ν = 1, s = 5 (d) DPP ν = 2, s = 15 # 65,327, t: 2,93s #39,219, t: 2.97s # 16,869, t: 0,74s # 26,185, t: 1.59s
Close-up view of images (a-d)
(e) DLL s = 50 (f) DLL s = 25 (g) DLL s = 5 (h) DLL s = 15 # 128,672, t: 8.12s # 64,473, t: 4.08s # 16,858, t: 0.98s # 64,473 , t: 4.08s
Close-up view of images (e-h)
(i) Fréchet e = 1, s = 25 (j) Fréchet e = 3, s = 25 (i) Fréchet e = 1, s = 5 (l) Fréchet e = 2, s = 15 # 103,139, t : 1.62s # 30,274, t: 1.12s # 26,288, t: 0.41s # 24,160, t: 0.68s
Close-up view of images (i-l)
Fig. 8. Experiments of the proposed level set based method on the Lena image with
three polygonalization algorithms: (a-d) dominant points (DPP), (e-h) digital level layers with line primitive (DLL) and (i-l) Fréchet distance based
Inkscape v 0.91, s = 25, no smooth Fréchet e = 1, s = 25
PDF size: 1,3 Mb PDF size: 341 kb
PDF size: 1487b PDF size: 1018b
Fig. 9. Comparisons of vectorization obtained with Inkscape and Fréchet (resp. DLL)
based vectorization (first row, resp. second row).
Inkscape [?]. This work opens new perspectives with for instance the integration
of the meaningful scale detection to filter only the significant intensity levels [?]. Also, we would like to evaluate the robustness of our approach with different polygonalization algorithms, by testing images corrupted by noise.