HAL Id: hal-00296388
https://hal.archives-ouvertes.fr/hal-00296388
Submitted on 4 Dec 2007
HAL is a multi-disciplinary open access
archive for the deposit and dissemination of
sci-entific research documents, whether they are
pub-lished or not. The documents may come from
teaching and research institutions in France or
abroad, or from public or private research centers.
L’archive ouverte pluridisciplinaire HAL, est
destinée au dépôt et à la diffusion de documents
scientifiques de niveau recherche, publiés ou non,
émanant des établissements d’enseignement et de
recherche français ou étrangers, des laboratoires
publics ou privés.
Spectral absorption properties of atmospheric aerosols
R. W. Bergstrom, P. Pilewskie, P. B. Russell, J. Redemann, T. C. Bond, P. K.
Quinn, B. Sierau
To cite this version:
R. W. Bergstrom, P. Pilewskie, P. B. Russell, J. Redemann, T. C. Bond, et al.. Spectral absorption
properties of atmospheric aerosols. Atmospheric Chemistry and Physics, European Geosciences Union,
2007, 7 (23), pp.5937-5943. �hal-00296388�
www.atmos-chem-phys.net/7/5937/2007/ © Author(s) 2007. This work is licensed under a Creative Commons License.
Chemistry
and Physics
Spectral absorption properties of atmospheric aerosols
R. W. Bergstrom1, P. Pilewskie2, P. B. Russell3, J. Redemann4, T. C. Bond5, P. K. Quinn6, and B. Sierau7
1Bay Area Environmental Research Institute, Sonoma, CA, USA
2Laboratory for Atmospheric and Space Physics, Department of Atmospheric and Oceanic Sciences, University of Colorado, Boulder, CO, USA
3NASA Ames Research Center. Moffett Field, CA, USA 4Bay Area Environmental Research Institute, Ventura, CA, USA 5University of Illinois, Champaign-Urbana, IL, USA
6Pacific Marine Environmental Laboratory, National Oceanic and Atmospheric Administration, Seattle, Washington, USA 7Institute for Atmospheric and Climate Science, ETH Zurich, Zurich, Switzerland
Received: 19 June 2007 – Published in Atmos. Chem. Phys. Discuss.: 24 July 2007 Revised: 16 October 2007 – Accepted: 30 October 2007 – Published: 4 December 2007
Abstract. We have determined the solar spectral
absorp-tion optical depth of atmospheric aerosols for specific case studies during several field programs (three cases have been reported previously; two are new results). We combined airborne measurements of the solar net radiant flux density and the aerosol optical depth with a detailed radiative trans-fer model for all but one of the cases. The field programs (SAFARI 2000, ACE Asia, PRIDE, TARFOX, INTEX-A) contained aerosols representing the major absorbing aerosol types: pollution, biomass burning, desert dust and mixtures. In all cases the spectral absorption optical depth decreases with wavelength and can be approximated with a power-law wavelength dependence (Absorption Angstrom Exponent or AAE). We compare our results with other recent spectral ab-sorption measurements and attempt to briefly summarize the state of knowledge of aerosol absorption spectra in the at-mosphere. We discuss the limitations in using the AAE for calculating the solar absorption. We also discuss the result-ing spectral sresult-ingle scatterresult-ing albedo for these cases.
1 Introduction
One of the largest uncertainties in the radiative forcing of cli-mate is due to aerosols. A substantial fraction of that uncer-tainty has been associated with the scattering and absorption of solar radiation by anthropogenic aerosols in cloud-free conditions. In recent years, a number of studies and field programs have been conducted that have aided in reducing
Correspondence to: R. W. Bergstrom
(bergstrom@baeri.org)
the uncertainty of the direct aerosol radiative forcing (IPCC, 2006). However there is a continuing interest in measuring the aerosol effects on solar radiation, clouds and climate, and future field programs are in the planning stage (such as the IPY project POLARCAT).
Certain atmospheric aerosols absorb solar radiation, specifically carbonaceous particles and mineral dust. This absorption affects the atmosphere by reducing the radiation reaching the surface and increasing the temperature aloft. The effects of absorbing aerosols are routinely modeled and accurate aerosol radiative properties are needed. In fact, as Bond and Sun (2005) state concerning the predicted effects of black carbon: while climate “models disagree with regard to simulated temperature changes, differing values of TOA [top of atmosphere] forcing per mass (normalized forcing) can largely be explained by assumptions in particle transport and optical properties.”
Absorptive properties have been used to infer black car-bon mass (Hansen et al., 1984), to identify aerosol sources (Clarke et al., 2007), to differentiate between black carbon and dust (Collaud Coen et al., 2004; Fialho et al., 2005; Mel-oni et al., 2006) and to identify absorbing aerosols by satellite (Torres et al., 2005). Each of these efforts relies on accurate information about aerosol absorptive properties.
This paper attempts to briefly summarize the state of knowledge on aerosol absorption spectra in the atmosphere. It presents the aerosol absorption measured in five different field campaigns and discusses the results in light of other measurements. We show that the absorption coefficient de-creases monotonically with wavelength in all cases and can be approximated by a power-law expression (i.e. an Absorp-tion Angstrom Exponent or AAE). However, the slope of the
5938 R. W. Bergstrom et al.: Spectral absorption properties of atmospheric aerosols BBBB BBBBBBB BBBBBB BBBBBBBBB BB BBBBBBBBBB B BBBBBBBBB BB BBBBBBBB BBBB BB BB J J JJ J JJJ J JJJJJJJJJJJJ JJJ J JJ JJ J H HHH HHH HHHHHH HHHHHHH HHHH HHHHHH HH H HH F F F F F F F F F ÑÑÑÑÑ ÑÑÑÑÑÑÑÑÑÑÑ 0.001 0.01 0.1 1 200 1000 2000
B SAFARI 2000South Africa
biomass burning
J PRIDE 2000
Saharan Dust
H ACE Asia 2001Asian Dust
and Pollution
F TARFOX 1996
North Atlantic
Ñ ICARTT 2004
North Atlantic Slope of Power law fit (AAE)
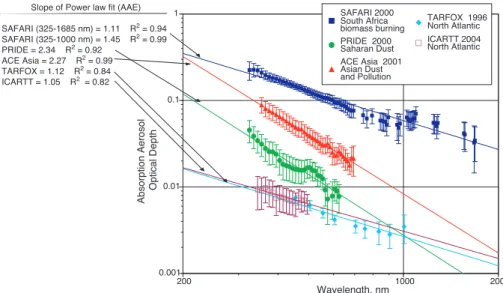
SAFARI (325-1685 nm) = 1.11 R2 = 0.94 SAFARI (325-1000 nm) = 1.45 R2 = 0.99 PRIDE = 2.34 R2 = 0.92 ACE Asia = 2.27 R2 = 0.99 TARFOX = 1.12 R2 = 0.84 ICARTT = 1.05 R2 = 0.82 H H H H H Absorption Aerosol Optical Depth Wavelength, nm
Fig. 1. The absorption aerosol optical depth versus wavelength for selected cases for five different field programs. The curve fit straight line represents the best-fit Angstrom Absorption Exponent for the wavelength region.
absorption (or the value of the AAE) depends on the aerosol material.
2 Measurement methods
The five different field campaigns are listed in Table 1. We used aircraft measurements of solar net radiant flux density and aerosol optical depth to determine the spectral absorp-tion coefficient for atmospheric aerosols in the last four of the experiments. The Solar Spectral Flux Radiometer (SSFR; Pilewskie et al., 2003) was used to simultaneously measure upwelling and downwelling spectral irradiance between 350 and 1670 nm with resolution between 8–12 nm. The NASA Ames Airborne Tracking Sunphotometer (AATS-14; Russell et al., 1999) measured the direct solar beam transmission at 14 wavelengths between 354 and 2139 nm in narrow chan-nels yielding the aerosol optical depth.
We estimated the absorption optical depth by matching the data with predictions from a detailed solar radiative transfer model (Bergstrom et al., 2003). We matched either the mea-sured absorption in the aerosol layer or the change in down-ward flux with optical depth (Redemann et al., 2006). The TARFOX field campaign did not include spectral solar flux measurements. Instead, filter samples were taken aboard an aircraft and analyzed for absorption in the UK Met Office laboratory (Bergstrom et al., 2002).
3 Absorption optical depth
The spectral absorption optical depths from the five field campaigns are shown in Fig. 1. The absorption optical depth follows a relatively smooth decrease with wavelength for all
cases and can be approximated with a power-law wavelength dependence (Absorption Angstrom Exponent or AAE). By convention the AAE is the negative of the slope of the ab-sorption on a log-log plot. Use of a linear fit to the slope of an optical coefficient on a log-log plot is not new by any means. The original Angstrom reference is from 1929 and the Angstrom exponent has been routinely used in describing aerosol extinction and scattering coefficients (for example, see Reid et al. (1999) for the use of the Angstrom exponent to estimate the variability of the optical properties of smoke particles in Brazil).
The utility of the Angstrom exponent for aerosol scattering is that the value of the exponent depends primarily on the size of the particles ranging from 4 for very small particles (Rayleigh scattering) to 0 for very large particles (such as cloud drops). Thus the Angstrom exponent for atmospheric aerosol scattering varies between the two limits depending on the size of the particles.
The analogous small particle limit for absorption (a Rayleigh-like absorption) can be shown to have a λ−1 depen-dence for spherical particles if the refractive indices are con-stant (Bergstrom, 1973; Bohren and Hufman, 1983). Black carbon (or light absorbing carbon, LAC) appears to have a relatively constant index of refraction and the particles are mostly small fractal agglomerates and thus should have an AAE of 1 (Bergstrom et al., 2002).
In Fig. 1 for the two urban aerosol cases (TARFOX and ICARTT) the AAE is close to 1. For the cases with dust aerosols (ACE Asia and PRIDE) the AAE is larger than 2. For the biomass burning case (SAFARI) the AAE is 1 for the entire wavelength region but 1.45 for the region of 300 nm to 1000 nm. Since the TARFOX absorption optical depth was not measured – only the absorption coefficient, a normalized
Table 1. Field programs.
Name Date Location Type of Aerosol Measurement Method Reference
TARFOX July 1999 East Coast US Urban Pollution Filter transmission Bergstrom et al., 2002 SAFARI 2000 August 2000 Southern Africa Biomass burning SSFR/AATS; FD Bergstrom et al., 2003 ACE Asia August 2001 Sea of Japan Dust; Urban mixed SSFR/AATS; FD Bergstrom et al., 2005 PRIDE March 2002 Puerto Rico Saharan dust SSFR/AATS; FD Reid et al., 2003 ICARTT July 2004 East Coast US Urban Pollution SSFR/AATS; GM Redemann et al., 2006
Sierau et al., 2006 FD = Flux Divergence; GM = Gradient Method
absorption coefficient was plotted at roughly the same mag-nitude as the ICARTT results.
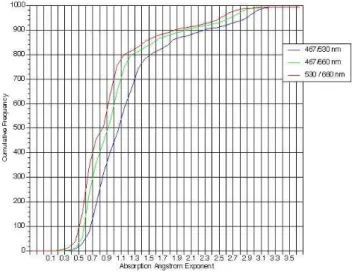
Atmospheric aerosol properties in general have a great deal of variability, so Fig. 1 represents only averages or in-dividual cases. Since these are data taken from an airplane far from the sources, the data represent aged particles. This variability is illustrated in Fig. 2 taken during the recent GoMACCS (Gulf of Mexico Atmospheric Composition and Climate Study, August–September, 2006) field campaign. The figure shows the cumulative frequency of occurrence of the aerosol AAE for three different wavelength regions for mainly offshore wind conditions during the entire cruise. The data were taken by a three-wavelength PSAP (Particle Soot Absorption Photometer, a filter-based measurement) aboard the NOAA RV Ronald H. Brown at one-second intervals but averaged over a one-minute time interval.
Figure 2 shows the range of variability during these peri-ods; it also demonstrates that the AAE is a function of wave-length. During these periods the AAE was larger at shorter wavelengths, as expected for organic carbon as discussed be-low. There appear to be two different source types in Fig. 2. 80% of the data has an AAE around 1 consistent with urban pollution (diesel exhaust) and 20% has an AAE from 1.5 to 3 consistent with organic carbonaceous particles. The fact that some of the data have an AAE less than 1 is interesting. This could be a result of measurement uncertainties or that the imaginary part of the index of refraction increases slightly with wavelength for some of the particles. There is no phys-ical reason why the index of refraction for LAC should be constant with wavelength and, in fact, the index of refraction does increase in the infrared (see the data sources cited in Bond and Bergstrom, 2006).
4 Absorption by individual components
The wavelength dependence of absorption depends upon the spectra of component aerosols and also their size, shape or mixing state. Here, we discuss spectra of different absorb-ing aerosol species and how they contribute to aerosol mea-sured in field campaigns. The current climate models need to attribute the absorption properties to individual aerosol
Figure 2
Fig. 2. The aerosol Absorption Angstrom Coefficient for offshore flow conditions during the GoMACCS field campaign derived from PSAP measurements onboard the NOAA RV Ronald H. Brown.
species; however, the measured values from field programs constrain the models predictions.
4.1 Carbonaceous aerosols
Carbonaceous particles that absorb solar radiation can be di-vided into highly absorbing carbon particles (termed either black carbon – BC or light absorbing carbon – LAC, Bond and Bergstrom (2006)) and weakly absorbing organic car-bon particles (so-called brown carcar-bon). As mentioned above, LAC particles typically have an AAE of 1.
Andreae and Gelenscer (2006) discussed the importance of distinguishing between black carbon and brown carbon. They noted that the less absorbing carbonaceous particles tend to have a larger AAE than LAC (e.g., Bond, 2001; Kirchstetter et al., 2004; Schnaiter et al., 2003). Kirchstetter et al. (2004) present a table of measurements of the spec-tral absorption by carbonaceous atmospheric aerosols. The AAE values range from 1 to 3 for ranges mostly between 300 nm to 1000 nm. In Table 2 we have listed several recent
5940 R. W. Bergstrom et al.: Spectral absorption properties of atmospheric aerosols measurements of organic carbonaceous aerosols made since
the Kirchstetter et al. (2004) tabulation.
In Fig. 1 both the TARFOX and ICARTT absorption was measured off the North Atlantic coast of the United States for offshore flow conditions dominated by urban pollution (presumably containing diesel emissions). Diesel particle emissions are routinely measured as having an AAE about 1 (Schnaiter et al., 2003).
Additional shipboard and aircraft data with filter-based measurements. corroborate the value of AAE equal to 1 for ICARTT. Measurements from the NOAA ship Ronald H. Brown for the same day as the case study (21 July 2004) (Sierau et al., 2006) give an AAE of 1.0, in good agreement with the results in Fig. 1. Virkkula et al. (2005) measured the AAE in the New England Air Quality Study experiment in 2002 (in the same location but two years earlier than the ICARTT experiment) as 1.18. Clarke et al. (2007) found that for the INTEX A field program (the NASA component of ICARTT), aerosol with an urban pollution origin had an AAE around 1, and aerosol from biomass burning plume had an AAE of around 2.1.
The variability in the AAE shown in Fig. 2 is due in part to mixtures of emissions from various sources but also variabil-ity from an individual source. Roden et al. (2006) measured the AAE of emissions of carbonaceous aerosol from cook-ing stoves, capturcook-ing emission events in real time. Many events show AAE of 1.0 and a single scattering albedo of 0.2 (indicative of LAC). Another cluster of events extends to higher single scattering albedo values and higher AAE values (0.8 single scattering albedo and an AAE of 5) indicative of brown carbon. Thus the cooking stove source contains both types of carbonaceous aerosols.
Kirchstetter et al. (2004) presented measurements of the absorption of solar radiation by aerosols collected on fil-ters. They found that absorption due to motor vehicle ex-haust had an AAE of about 1while biomass burning plumes had an AAE of approximately 2 (similar to the results of Clarke, 2007). Schnaiter et al. (2005) deduced AAE of 1.3 for Diesel soot and 2.2 for spark generated soot and Schnaiter et al. (2006) measured AAE’s of 2.2 to 3.5 for increasing or-ganic carbon content in combustion soots.
To explain why the AAE is a function of wavelength it is helpful to use the gap theory of absorption. The band-gap theory was originally proposed by Tauc (1966) and was applied to the absorption of semiconducting amorphous car-bon by Robertson and O’Reilly (1987). (The band-gap is the energy necessary to cause an electronic transition for a par-ticular material.) Bond (2001), Kirchstetter et al. (2004) and Schnaiter et al. (2003) have used the theory to explain the ab-sorption by organic carbon particles. This theory provides an analytical expression for the AAE and shows that in general the AAE is not a constant with respect to wavelength (except for black carbon).
Sun et al. (2007) show that the AAE for a particular mate-rial is equal to (E+Eg)/(E−Eg) where E is the energy of the
photon (E=hc/λ) and Egis the band-gap. For LAC (black
carbon), Egis zero and AAE is one, in agreement with some
of the observed data. Sun et al. (2007) suggest two types of materials to represent absorption by organic carbon parti-cles: a humic-like material and a combustion-like material. The absorption coefficients for the material proposed by Sun et al. (2007) have a larger AAE than LAC particles but can be approximated with an AAE of 6 for the humic substances and an AAE of 4.3 for the combustion substances. Mixtures of these materials and LAC will have AAE greater than 1 but less than 4–6, which could explain some observations. These coefficients also explain why the sources that Roden et al. (2006) measured can have such a wide range of AAE since the fluctuation between LAC and other organic material is highly variable in solid-fuel emissions.
4.2 Dust aerosols – PRIDE
There is a large amount of information on the absorption properties of mineral dust that we will not summarize here. Sokolik and Toon (1999) and Lafon et al. (2005) showed the wavelength dependence of the absorption for various materi-als that make up desert dust (primarily hematite and certain clays). While many types of mineral dust have a very compli-cated wavelength structure at infrared wavelengths, absorp-tion at visible wavelengths is often smooth and decreases at greater wavelengths.
Collaud Coen et al. (2004) measured the scattering and ab-sorption wavelength dependence during Saharan dust events at the Jungefraujoch, showing that the AAE of the Saharan dust particles increased from above 1 to a range between 1 and 2. Fialho et al. (2005) also used the magnitude of the AAE to differentiate between Saharan dust and LAC parti-cles. They estimated the dust particles had an AAE of 2.9 similar to our results for the PRIDE case in Fig. 1.
4.3 Mixed urban pollution and desert dust aerosols – ACE Asia
As discussed in Bergstrom et al. (2004), the ACE Asia pro-gram sampled aerosol that had both urban pollution and desert dust components. The AAE of 2.2 from the data in Fig. 1 is consistent with elevated AAE due to either dust or carbonaceous material. However, it is impossible to extract from the AAE alone the relative amounts of each component.
5 Single scattering albedo
The spectral single scattering albedo, or the ratio of scatter-ing to extinction (absorption plus scatterscatter-ing), is commonly presented in the literature since it can determine the sign of the aerosol radiative effects. However, very often the aerosol that contributes the absorption is not the same as the aerosol that dominates the scattering. For example, pure LAC particles typically have a single scattering albedo of 0.2.
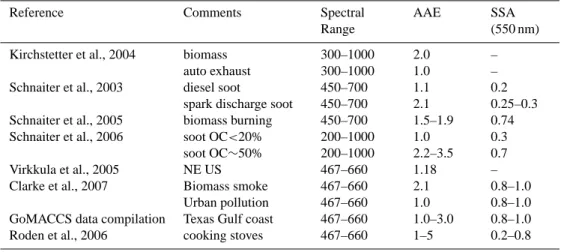
Table 2. Measurements of AAE for carbonaceous particles made since Kirchstetter et al. (2004).
Reference Comments Spectral
Range
AAE SSA
(550 nm) Kirchstetter et al., 2004 biomass
auto exhaust 300–1000 300–1000 2.0 1.0 – – Schnaiter et al., 2003 diesel soot
spark discharge soot
450–700 450–700 1.1 2.1 0.2 0.25–0.3 Schnaiter et al., 2005 biomass burning 450–700 1.5–1.9 0.74 Schnaiter et al., 2006 soot OC<20%
soot OC∼50% 200–1000 200–1000 1.0 2.2–3.5 0.3 0.7 Virkkula et al., 2005 NE US 467–660 1.18 –
Clarke et al., 2007 Biomass smoke Urban pollution 467–660 467–660 2.1 1.0 0.8–1.0 0.8–1.0 GoMACCS data compilation Texas Gulf coast 467–660 1.0–3.0 0.8–1.0 Roden et al., 2006 cooking stoves 467–660 1–5 0.2–0.8
Absorption in urban pollution is thought to be dominated by LAC, but because the scattering is due to sulfates or organic aerosol, the total aerosol may have a single scattering albedo at 550 nm of between 0.8 to 0.95 depending on the LAC con-tent. Also, the wavelength dependence of the scattering is a strong function of the size of the particles so the single scat-tering albedo’s wavelength dependence is a function of both the composition and size of the aerosols.
The spectral single scattering albedo variation with wave-length is different for dusts (it tends to increase) than for ur-ban pollution (it tends to decrease) (Bergstrom et al., 2002; Dubovik et al., 2002). Collaud Coen et al. (2004) and Meloni et al. (2006) found that they could differentiate between car-bonaceous aerosols and Saharan dust because the dust had a single scattering albedo that increased with wavelength while for urban pollution and biomass burning aerosol the single scattering albedo decreased with wavelength.
The single scattering albedo spectra for the above cases are shown in Fig. 3. For large particles (like dust) the tering is fairly constant with wavelength so the single scat-tering albedo matches the decrease in absorption with wave-length. For smaller particles (like urban pollution) the scat-tering often decreases faster than absorption of the carbona-ceous particles so that the single scattering albedo decreases with wavelength.
6 Conclusions
For the case studies from 5 field programs shown in Fig. 1 the decrease of the aerosol absorption with wavelength can be fit with a power-law expression (AAE) yielding AAE that range from 1.0 to 2.3. In general the AAE values for car-bonaceous particles are greater than 1 (near one for urban pollution; nearer two for biomass smoke). For dusts the AAE values are large (around 3) and perhaps only approximately
Fig. 3. The single scattering albedo for the cases presented in Fig. 1.
fit by a power law. The AAE may be a useful approximation for climate models but is probably less applicable for cal-culations of the radiance in specific wavelength regions like the UV where the AAE may be different than in the visible. Use of the AAE to represent wavelength dependence can ac-count for spectral differences due to chemical composition to a greater extent than has been previously accomplished. However, there is no reason why the AAE should be constant with wavelength, and it should be used with care, particu-larly when relating measurements of visible and ultraviolet absorption.
Although the AAE can be very high (4–6) for individ-ual organic carbonaceous compounds, in the atmosphere these compounds are usually mixed with strongly absorbing
5942 R. W. Bergstrom et al.: Spectral absorption properties of atmospheric aerosols particles (LAC). Therefore the average AAE usually lies
be-tween 1 (for LAC) and 4–6.
As the UV spectral region is important for photochemical reactions and the TOMS/OMI type of remote sensing, it is important to account for the difference between the UV and visible absorption. For aerosol with an AAE of 3 the absorp-tion coefficient at a wavelength of 275 nm will be 8 times the value at 550 nm. There clearly is a need to measure the spec-tral variation of aerosol absorption in future field programs. Acknowledgements. The authors gratefully acknowledges support
provided by NASA’s Earth Observing System Interdisciplinary Science (EOS-IDS) Program and by NASA’s Radiation Sciences Program.
Edited by: T. Kirchstetter
References
Andreae, A. and Gelecser, A.: Black carbon or brown carbon? The nature of light-absorbing carbonaceous aerosols, Atmos. Chem. Phys., 6, 3131–3148, 2006,
http://www.atmos-chem-phys.net/6/3131/2006/.
Bates, T. S., Anderson, T. L., Baynard, T., et al.: Aerosol direct radiative effects over the northwest Atlantic, northwest Pacific, and North Indian Oceans: estimates based on in-situ chemical and optical measurements and chemical transport modeling, At-mos. Chem. Phys., 6, 1657–1732, 2006,
http://www.atmos-chem-phys.net/6/1657/2006/.
Bergstrom, R. W., Pilewskie, P., Pommier, J., Rabbette, M., Rus-sell, P. B., Schmid, B., Redemann, J., Higurashi, A., Naka-jima, T., and Quinn, P. K.: Spectral absorption of solar radiation by aerosols during ACE-Asia, J. Geophys. Res., 109, D19S15, doi:10.1029/2003JD004467, 2004.
Bergstrom, R. W., Pilewskie, P., Schmid, B., and Russell, P. B.: Comparison of Measured and Predicted Aerosol Radiative Ef-fects during SAFARI 2000, J. Geophys. Res., 108, D138474, doi:1029/2002JD002435, 2003.
Bergstrom, R. W., Russell, P. B., and Hignett, P. B.: The Wave-length Dependence of Black Carbon Particles: Predictions and Results from the TARFOX experiment and Implications for the Aerosol Single Scattering Albedo, J. Atmos. Sci., 59, 567–577, 2002.
Bergstrom, R. W.: Extinction and Absorption Coefficients of the Atmospheric Aerosol as a Function of Particle Size, Contr. At-mos. Phys., 46, 223–234, 1973.
Bohren, C. F. and Huffman, D. R.: Absorption and scattering of light by small particles, John Wiley and Sons, New York, 530 pp., 1983.
Bond, T. C. and Bergstrom, R. W.: Light absorption by carbona-ceous particles: An investigative review, Aerosol Sci. Technol., 40, 27–67, 2006.
Bond, T. C., Habib, G., and Bergstrom, R. W.: Limitations in the Enhancement of Visible Light Absorption due to Mixing State, J. Geophys. Res., 111, D20211, doi:10.1029/2006JD007315, 2006. Bond, T. C. and Sun, H.: Can Reducing Black Carbon Emissions Counteract Global Warming?, Environ. Sci. Technol., 39, 5921– 5926, 2005.
Bond, T. C.: Spectral Dependence of Visible Light Absorption by Carbonaceous Particles Emitted from Coal Combustion, Geo-phys. Res. Lett., 28(21), 4075–4078, 2001.
Clarke, A., McNaughton, C., Kapustin, V., Shinozuka, Y., Howell, S., Dibb, J., Zhou, J., Anderson, B., Brekhovskikh, V., Turner, H., and Pinkerton, M.: Biomass Burning and Pollution Aerosol over North America: Organic Components and their influence on Spectral Optical Properties and Humidification Response, J. Geophys. Res., 112, D12S18, doi:10.1029/2006JD007777, 2007.
Collaud Coen, M., Weingartner, E., Schaub, D., Hueglin, C., Corri-gan, C., Henning, S., Schikowski, M., and Baltensperger, U.: Sa-haran dust events at the Jungfraujoch: Detection by wavelength dependence of the single scattering albedo and first climatology analysis, Atmos. Chem. Phys., 4, 2465–2480, 2004,
http://www.atmos-chem-phys.net/4/2465/2004/.
Dubovik, O., Holben, B. N., Eck, T. F., Smirnov, A., Kaufman, Y. J., King, M. D., Tanre, D., and Slutsker, I.: Climatology of atmo-spheric aerosol absorption and optical properties in key locations, J. Atmos. Sci., 59, 590–608, 2002.
Fialho, P., Hansen, A. D. A., and Honrath, R. E.: Absorption coef-ficients by aerosols in remote areas: A new approach to decou-ple dust and black carbon absorption coefficients using seven-wavelength Aethalometer data, J. Aerosol Sci., 36(2), 267–282, 2005.
Hansen, A. D. A., Rosen, H., and Novakov, T.: The aethalometer – an instrument for the real-time measurement of optical absorp-tion by aerosol particles, Sci. Total Env., 36, 191–196, 1984. Climate Change 2007: The Physical Science Basis, Contribution of
Working Group 1 to the Fourth Assessment Report of the IPCC, ISBN 978 0521 88009-1 Hardback, 978 0521 70596-7 Paper-back, Cambridge University Press, 2007.
Kirchstetter, T. W. , Novakov, T., and Hobbs, P.: Evidence that the spectral dependence of light absorption by aerosols is af-fected by organic carbon, J. Geophys. Res., 109, D21208, doi:10.1029/2004JD004999, 2004.
Lafon, S., Sokolik, I. N., Rajot, J. L., Caquineau, S., and Gaudichet, A.: Characterization of iron oxides in mineral dust aerosols: Im-plications for light absorption, J. Geophys. Res., 111, D21207, doi:10.1029/2005JD007016, 2006.
Meloni, D., di Sarra, A., Pace, G., and Monteleone, F.: Aerosol optical properties at Lampedusa (Central Mediterranean). 2. De-termination of single scattering albedo at two wavelengths for different aerosol types, Atmos. Chem. Phys., 6, 715–727, 2006, http://www.atmos-chem-phys.net/6/715/2006/.
Pilewskie, P., Pommier, J., Bergstrom, R. W., et al.: Solar spectral radiative forcing during the Southern African Re-gional Science Initiative, J. Geophys. Res., 108(D13), 8486, doi:10.1029/2002JD002411, 2003.
Redemann, J., Pilewskie, P., Russell, P. B., et al.: Air-borne measurements of spectral direct aerosol radiative forc-ing in INTEX/ITCT, J. Geophys. Res., 111, D14210, doi:10.1029/2005JD006812, 2006.
Reid, J. S., Kinney, J. E., Westphal, D. L., et al.: Analy-sis of measurements of Saharan dust by airborne and ground-based remote sensing methods during the Puerto Rico Dust Experiment (PRIDE), J. Geophys. Res., 108(D19) 8586, doi:10.1029/2002JD002493, 2003.
Reid, J. S., Eck, T. F., Christopher, S. A., Hobbs, P. V., and
ben, B.: Use of the Angstrom exponent to estimate the variabil-ity of optical and physical properties of ageing smoke particle in Brazil, J. Geophys. Res., 104(D22), 27 473–27 490, 1999. Robertson, J. and O’Reilly, E. P.: Electronic and atomic structure of
amorphous carbon, Phys. Rev. B, 35(6), 2946–2957, 1987. Roden, C. A., Bond, T. C., Conway, S., Benhamin, A., and Pinel,
O.: Emission factors and real-time optical properties of particles emitted from traditional wood burning cookstoves, Environ. Sci. Technol., 40, 6750–6757, 2006.
Russell, P. B., Livingston, J. M., Hignett, P., Kinne, S., Wong, J., and Hobbs, P. V.: Aerosol induced radiative flux changes off the United States Mid-Atlantic coast: Comparison of values calcu-lated from sunphotometer and in situ data with those measured by airborne pyranometer, J. Geophys. Res., 104, 2289–2307, 1999.
Schnaiter, M., Horvath, H., Mohler, O., Naumann, K. H., Saathoff, H., and Schock, O. W.: UV-VIS-NIR spectral optical properties of soot and soot-containing aerosols, J. Aerosol Sci., 34, 1421– 1444, 2003.
Schnaiter, M., Schmid, O., Petzold, A., Fritzsche, L., Klein, K. F., Andreae, M. O., Helas, G., Thielmann, A., Gimmler, M., Mohler, O. M., Linke, C., and Schurath, U.: Measurement of wavelength resolved light absorption by aerosols utilizing a UV-VIS extinc-tion cell, Aerosol Sci. Technol., 39, 249–260, 2005.
Schnaiter, M., M. Gimmler , I. Llamas, C. Linke, C. J”ager, and H. Mutschke: Strong spectral dependence of light absorption by organic carbon particles formed by propane combustion, Atmos. Chem. Phys., 6, 2981–2990, 2006,
http://www.atmos-chem-phys.net/6/2981/2006/.
Sierau, B., Covert, D. S., Coffman, D. J., Quinn, P. K., and Bates, T. S.: Aerosol optical properties during the 2004 New Eng-land Air Quality Study–Intercontinental Transport and Chem-ical Transformation: Gulf of Maine surface measurements – Regional and case studies, J. Geophys. Res., 111, D23S37, doi:10.1029/2006JD007568, 2006.
Sokolik, I. and Toon, O. B.: Incorporation of mineralogical compo-sition into models of the radiative properties of mineral aerosol from UV to IR wavelengths, J. Geophys. Res., 104, 9423–9444, 4501–4512, 1999.
Sun, H., Biedermann, L., and Bond, T. C.: The color of brown carbon: A model for ultraviolet and visible light absorption by organic carbon aerosol, Geophys. Res. Lett., 34, L17813, doi:10.1029/2007GL029797, 2007.
Tauc, J., Grigorovici, R., and Vancu, A.: Optical properties and electronic structure of amorphous germanium, Phys. Stat. Sol., 15, 627–637, 1966.
Torres, O., Bhartia, P. K., Sinyuk, A., Welton, E. J., and Hol-ben, B.: Total Ozone Mapping Spectrometer measurements of aerosol absorption from space: Comparison to SAFARI 2000 ground-based observations, J. Geophys. Res., 110, D10S18, doi:10.1029/2004JD004611, 2005.
Virkkula, A., Ahlquist, N. C., Covert, D. S., Arnott, W. P., Sheridan, P. J., Quinn, P. K., and Coffman, D. J.: Modification, calibration and a field test of an instrument for measuring light absorption by particles, Aerosol Sci. Technol., 39(1), 68–83, 2005.