HAL Id: inserm-00951450
https://www.hal.inserm.fr/inserm-00951450
Submitted on 24 Feb 2014
HAL is a multi-disciplinary open access archive for the deposit and dissemination of sci-entific research documents, whether they are
pub-L’archive ouverte pluridisciplinaire HAL, est destinée au dépôt et à la diffusion de documents scientifiques de niveau recherche, publiés ou non,
Combining Ca2+ and membrane potential imaging in
single neurons.
Marco Canepari, Kaspar Vogt, Michel de Waard, Dejan Zecevic
To cite this version:
Marco Canepari, Kaspar Vogt, Michel de Waard, Dejan Zecevic. Combining Ca2+ and membrane potential imaging in single neurons.. Cold Spring Harbor protocols, Cold Spring Harbor, NY : Cold Spring Harbor Laboratory Press, 2013, 2013 (12), pp.1161-4. �10.1101/pdb.prot073114�. �inserm-00951450�
PROTOCOL 1 Title page
Combining Ca
2+and Membrane Potential Imaging from
Single Neurons
SHORT TITLE: Ca2+ and Voltage Imaging
Marco Canepari
1,2, Kaspar Vogt
3, Michel De Waard
1,2, Dejan Zecevic
4 1Inserm, U836, Team 3, BP 170, Grenoble Cedex 09, F-38042, France
2
Université Joseph Fourier, Grenoble Institut des Neurosciences, France
3
Division of Pharmacology and Neurobiology, Biozentrum – University of Basel, Switzerland
4
Department of C/M Physiology, Yale University School of Medicine, New Haven, CT, USA
Address correspondence to: [email protected]
ABSTRACT
The ability to simultaneously monitor Ca2+ signals and membrane potential at multiple locations on the same neuron facilitates further progress in our understanding of neuronal function. In particular, this method allows correlating electrical and chemical signals from multiple sites including those not accessible to microelectrodes. Here we describe a protocol to achieve these measurements. We describe the apparatus and the methods to load cells with two indicators. A troubleshooting section is included at the end as well as the discussion of capabilities and limitations of the technique.
MATERIALS
Reagents
• Artificial cerebral-spinal fluid (ACSF). <R>
• Internal solution for patch clamp. <R>
• A Fura dye purchased from Invitrogen – Molecular Probes (Carlsbad, CA). Available dyes at different dissociation constants are: Fura-2, Bis-Fura-2, Fura-4F, Fura-5F, Fura-6F, Fura-FF and Mag-Fura-2. <R>
• JPW1114 (Invitrogen – Molecular Probes). <R>
Equipment
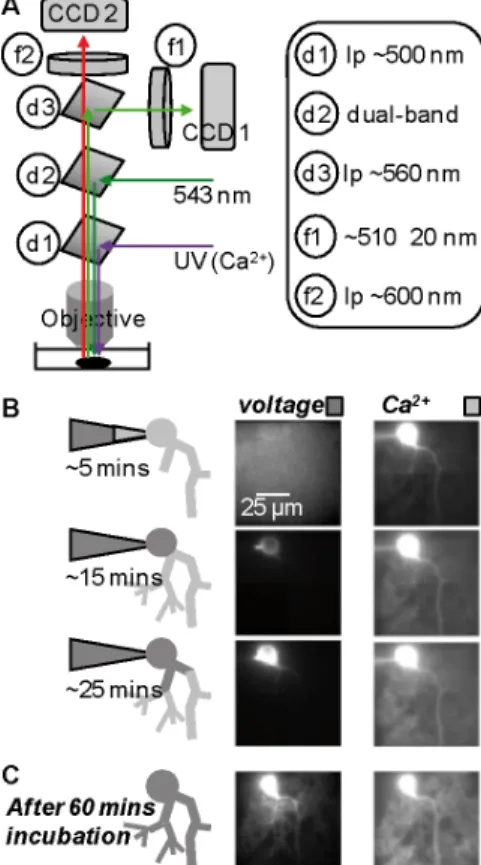
An upright microscope configuration for simultaneous membrane potential and Ca2+ imaging from brain slices is described in Vogt et al. (2011) and illustrated in Fig. 1A. All components for dual illumination and dual imaging are commercially available from Cairn Research Ltd (Faversham, UK). Briefly, the epifluorescence port of an upright microscope is used for Ca2+ fluorescence excitation at 385 nm. We recommend using 385 nm LED illumination, for instance the OptoLED from Cairn with the band-pass filter FF387/6 from Semrock, Rochester, NY. UV light is reflected to the preparation using a ~500 nm long-pass dichroic mirror (for instance FF506-Di from Semrock). To excite the voltage sensitive dye, the light from a 543 nm laser (for instance model MLL543 from CNI, Changchun, China) is used. To obtain whole-field illumination, laser beam is expanded to be focussed onto the back-aperture of the objective using a separate epi-fluorescence condenser attached to the front port of the microscope (Cairn). Reflection of 543 nm light and transmission of both voltage-sensitive dye and Ca2+ indicator fluorescence is provided by a dual band dichroic mirror (the FF493_574-Di from Semrock). The two fluorescence signals are separated by a ~560 nm long-pass dichroic mirror (the 565DCXR, Chroma, Bellows Falls, VT). Voltage-sensitive dye fluorescence is filtered by a ~600 nm long-pass filter (the RG610 from Schott, Mainz, Germany) and Ca2+ indicator fluorescence is filtered by a ~510 ± 20 nm band-pass filter (by FF510/42 from Semrock). To acquire fluorescence signals at high-speed, we recommend Dual NeuroCCD-SMQ camera (RedshirtImaging LLC, Decatur, GA).
METHOD
1. The staining protocol for a cerebellar Purkinje neuron is illustrated in Fig. 1B. Staining is accomplished by free diffusion of the dyes from the patch-electrode into the soma by establishing a whole-cell recording. Glass pipettes are first filled from the tip with the solution containing only the Ca2+ indicator by applying negative pressure for a period ranging from 10 seconds to 1
the solution containing both the Ca2+ indicator and the voltage-sensitive dye. The aim of this procedure is to prevent the leakage of the voltage-sensitive dye into the extracellular medium before the electrode is attached to the neuron. The amount of dye-free solution in the tip must be optimized empirically to minimize the loading time. Measure and standardize the pressure applied to the patch pipette during manipulation of the electrode in the slice. This pressure is necessary to maintain the tip of the electrode clean. Use a positive pressure of ~4-8 mbar while the pipette is far from the cell and increase the pressure to ~30-60 mbar for a few seconds before the pipette is attached to the cell membrane. Ca2+ indicator fluorescence over the entire dendritic field should be detectable after 5-10 minutes after establishing the whole-cell mode. Voltage sensitive dye fluorescence in the soma should be detectable after 5-15 minutes of dye diffusion from the electrode and should reach maximum value after 30-45 minutes. The patch electrode must be detached from the cell by forming an outside-out patch after 30-45 minutes (Fig. 1B). Cell overload with the voltage-sensitive dye has pharmacological effects (see troubleshooting). Variants of this loading procedure are described in Canepari et al. 2007; Milojkovic 2007; Canepari et al. 2008; Canepari and Vogt 2008; Canepari et al. 2010.
2. During and after the staining procedure, the resting light intensity from the soma should be monitored using very low light intensity. Overexposure of the cell to high-intensity light produces photo damage (see troubleshooting).
3. After staining termination, incubate the slice for 1-2 hours or until the voltage sensitive dye is equilibrated in all parts of the neuron. Incubation is necessary to allow the diffusion of the voltage sensitive dye into distal processes (see Fig. 1B). Perform staining and incubation at room temperature to preserve the functional integrity of the preparation.
4. Imaging experiments can be done without re-patching the neuron. However, during incubation, a progressive loss of the Ca2+ indicator is usually observed. To maintain the Ca2+ indicator concentration re-patch the neuron using the internal solution containing only the Ca2+ indicator. This step also allows obtaining simultaneous recording of somatic membrane potential and the possibility to inject current in the soma.
TROUBLESHOOTING
Problem 1 (step 1): Leakage of the voltage-sensitive dye while approaching the cell before staining Solution: Increase front-filled solution or adjust the pressure while approaching the cell.
Problem 2 (step 1): Loading time is too slow.
Problem 3 (steps 1, 2 and 4): Pharmacological effects of the voltage-sensitive dyes due to dye
overloading. [Pharmacological effects and photodynamic damage are two different things]
Solution: Record somatic action potentials and check any change from the initial kinetics. Terminate the experiment when an effect is observed.
DISCUSSION
With present sensitivity and commercially available equipment it is possible to record membrane potential transients at very high temporal resolution (up to 20 kHz). It is also possible to measure signals with good signal-to-noise ratio in single trials. Spatial resolution is limited to ~1 µm because increasing spatial resolution reduces light intensity and the signal-to-noise ratio. While confocal imaging or two-photon imaging can improve spatial resolution, it is currently impossible to resolve voltage and Ca2+ signals from multiple sites in single trials with these techniques.
Figure 1. Microscope configuration and protocol of cell staining. (A) UV light beam from the epifluorescence port is reflected
to the objective via a ~500 nm dichroic mirror (d1). 543 nm beam from above is reflected to the objective via a dual-band dichroic mirror (d2). Ca2+ indicator and voltage sensitive dye fluorescence are separated by a ~560 nm dichroic mirror (d3), filtered at ~510 ± 20 nm (f1) and >610 nm (f2) respectively, and acquired by two CCD cameras. (B) A Purkinje neuron loading with the voltage sensitive dye JPW1114 (“voltage”, left column) and 1 mM of the Ca2+ indicator FuraFF (Ca2+, right column). Light gray indicates the internal solution in the tip of the patch electrode containing only the Ca2+ indicator; dark gray indicates the back-filled internal solution also containing the voltage sensitive dye. Images taken at 5, 15 and 25
minutes after whole-cell. (C) Loading interrupted after 30 minutes forming an outside-out. Fluorescence of the two dyes after 60 minutes incubation.
RECIPES
• Suggested ACSF (mM): 125 NaCl, 26 NaHCO3, 20 glucose, 3 KCl, 1 NaH2PO4, 2 CaCl2 and 1
MgCl2, bubbled with 95% O2 and 5% CO2.
• Suggested internal solution (mM): 125 KMeSO4, 5 KCl, 8 MgSO4, 5 Na2-ATP, 0.3 Tris-GTP, 12
Tris-Phosphocreatine, 20 HEPES, adjusted to pH 7.35 with KOH.
• Use of Fura dyes. Prepare a stock solution in intracellular solution at 10 mM concentration. Make single use aliquots and keep them at -20ºC. Before the experiment, dilute the dye in internal solution at the desired concentration.
• Use of JPW1114. Prepare a stock solution in H20 at a concentration of 20 mg/mL. Keep the stock
at 4ºC if used within a month or aliquot and keep it at -20ºC for longer utilizations. Before the experiment, dilute in internal solution containing the Ca2+ indicator at 0.1-0.5 mg/mL.
REFERENCES
Canepari M, Djurisic M, Zecevic D. 2007. Dendritic signals from rat hippocampal CA1 pyramidal neurons during coincident pre- and post-synaptic activity: a combined voltage- and calcium imaging study. J Physiol 580: 463-484.
Canepari M, Vogt KE. 2008. Dendritic Spike Saturation of Endogenous Calcium Buffer and Induction of Postsynaptic Cerebellar LTP. PLoS ONE 3: e4011.
Canepari M, Vogt K, Zecevic D. 2008. Combining voltage and calcium imaging from neuronal dendrites.
Cell Mol Neurobiol 58: 1079-1093.
Canepari M, Willadt S, Zecevic D, Vogt KE (2010) Imaging Inhibitory Synaptic Potentials Using Voltage Sensitive Dyes. Biophys J 98: 2032-2040.
Milojkovic BA, Zhou WL, Antic SD. 2007. Voltage and calcium transients in basal dendrites of the rat prefrontal cortex. J Physiol 585: 447-468.
Vogt KE, Gerharz S, Graham J, Canepari M (2011) High-resolution simultaneous voltage and Ca2+ imaging. J Physiol 589: 489-494.