HAL Id: hal-00295645
https://hal.archives-ouvertes.fr/hal-00295645
Submitted on 21 Mar 2005
HAL is a multi-disciplinary open access
archive for the deposit and dissemination of
sci-entific research documents, whether they are
pub-lished or not. The documents may come from
teaching and research institutions in France or
abroad, or from public or private research centers.
L’archive ouverte pluridisciplinaire HAL, est
destinée au dépôt et à la diffusion de documents
scientifiques de niveau recherche, publiés ou non,
émanant des établissements d’enseignement et de
recherche français ou étrangers, des laboratoires
publics ou privés.
Mesoscale modeling of combined aerosol and
photo-oxidant processes in the Eastern Mediterranean
M. Lazaridis, A. Spyridaki, S. Solberg, J. Smolík, V. Zdímal, K. Eleftheriadis,
V. Aleksanropoulou, O. Hov, P. G. Georgopoulos
To cite this version:
M. Lazaridis, A. Spyridaki, S. Solberg, J. Smolík, V. Zdímal, et al.. Mesoscale modeling of
com-bined aerosol and photo-oxidant processes in the Eastern Mediterranean. Atmospheric Chemistry and
Physics, European Geosciences Union, 2005, 5 (4), pp.927-940. �hal-00295645�
Atmos. Chem. Phys., 5, 927–940, 2005 www.atmos-chem-phys.org/acp/5/927/ SRef-ID: 1680-7324/acp/2005-5-927 European Geosciences Union
Atmospheric
Chemistry
and Physics
Mesoscale modeling of combined aerosol and photo-oxidant
processes in the Eastern Mediterranean
M. Lazaridis1, A. Spyridaki1, S. Solberg2, J. Smol´ık3, V. ˇZd´ımal3, K. Eleftheriadis4, V. Aleksanropoulou1, O. Hov5, and P. G. Georgopoulos6
1Technical University of Crete, Department of Environmental Engineering, 73100 Chania, Greece 2Norwegian Institute for Air Research (NILU), P.O. Box 100, NO-2007 Kjeller, Norway
3Institute of Chemical Process Fundamentals, ASCR, Prague, Czech Republic 4N.C.S.R. “Demokritos”, 15310 Agia Paraskevi, Athens, Greece
5Norwegian Meteorological Institute, P.O. Box 43, Blindern NO-0313 Oslo, Norway
6EOHSI, University of Medicine and Dentistry and Rutgers University, New Jersey, NJ, USA Received: 11 June 2004 – Published in Atmos. Chem. Phys. Discuss.: 21 September 2004 Revised: 29 December 2004 – Accepted: 4 March 2005 – Published: 21 March 2005
Abstract. Particulate matter and photo-oxidant processes
in the Eastern Mediterranean have been studied using the UAM-AERO mesoscale air quality model in conjunction with the NILU-CTM regional model. Meteorological data were obtained from the RAMS prognostic meteorological model. The modeling domain includes the eastern Mediter-ranean area between the Greek mainland and the island of Crete. The modeling system is applied to study the atmo-spheric processes in three periods, i.e. 13–16 July 2000, 26– 30 July 2000 and 7–14 January 2001. The spatial and tempo-ral distributions of both gaseous and particulate matter pol-lutants have been extensively studied together with the iden-tification of major emission sources in the area. The mod-eling results were compared with field data obtained in the same period. The objective of the current modeling work was mainly to apply the UAM-AERO mesoscale model in the eastern Mediterranean in order to assess the performed field campaigns and determine that the applied mesoscale model is fit for this purpose. Comparison of the modeling results with measured data was performed for a number of gaseous and aerosol species. The UAM-AERO model under-estimates the PM10measured concentrations during summer and winter campaigns. Discrepancies between modeled and measured data are attributed to unresolved particulate matter emissions. Particulate matter in the area is mainly composed by sulphate, sea salt and crustal materials, and with signif-icant amounts of nitrate, ammonium and organics. During winter the particulate matter and oxidant concentrations were lower than the summer values.
Correspondence to: M. Lazaridis
1 Introduction
Airborne particulate matter and photo-oxidants are important aspects of air pollution with very diverse effects ranging from human health to climate forcing. A major part of the aerosol mass is secondary particulate matter in the form of sulphate, nitrate, ammonium and organic aerosol particles formed by the oxidation of sulphur dioxide, nitrogen oxides and organic gaseous species. It is apparent that particulate matter is not a single pollutant and its mass includes a size dependent mix-ture of many pollutants.
In Southern Europe large changes have occurred over the past few decades linked to the increase in population, and land-use alterations, impacting on atmospheric composition, water availability and consequently on quality of life, includ-ing human health. For instance, most chemistry-transport models predict that the high ozone concentrations observed in summer over Europe have a maximum around the Mediter-ranean sea, and in particular in its Eastern part, very often exceeding the air quality standards. Often high concentra-tions of fine particles are observed together with high ozone concentrations (Lelieveld et al., 2002; Smol´ık et al., 2003). Here natural emissions of highly reactive unsaturated hydro-carbons (including isoprene) and continuing high emissions of anthropogenic gaseous and aerosol pollutants in Southern Europe contribute (Hoffman et al., 1997; Pandis et al., 1992; Kavouras et al., 1998; Sotiropoulou et al., 2004). Experimen-tal measurements and estimates (Pandis et al., 1992) also in-dicate that there are highly nonlinear aspects involved in the production of organic aerosols, e.g. in the aerosol yields from monoterpenes. In addition, pressures from anthropogenic ac-tivity on the Mediterranean area have complex consequences for the quality of life and the regional radiative forcing of climate.
928 M. Lazaridis et al.: Mesoscale modeling in the Eastern Mediterranean < 20.0 20.0 - 25.0 25.0 - 30.0 30.0 - 35.0 35.0 - 40.0 40.0 - 45.0 45.0 - 50.0 50.0 - 55.0 55.0 - 60.0 60.0 - 65.0 65.0 - 70.0 > 70.0 10.0 m/s 10 .0 m /s 45 50 55 60 25 30 35 2000 07 01 00 +300 (2000 07 13 12) 18 O3 Athens Foinokalia Crete Modeling domain Figure 1a < 0.10 0.10 - 0.20 0.20 - 0.40 0.40 - 0.70 0.70 - 1.00 1.00 - 1.50 1.50 - 2.00 2.00 - 3.00 3.00 - 4.00 4.00 - 5.00 5.00 - 7.00 7.00 - 10.00 > 10.00 10.0 m/s 10. 0 m/ s 45 50 55 60 25 30 35 2000 07 01 00 +300 (2000 07 13 12) 18 NOx Athens Foinokalia Modeling domain Crete Figure 1b 33 (a) < 20.0 20.0 - 25.0 25.0 - 30.0 30.0 - 35.0 35.0 - 40.0 40.0 - 45.0 45.0 - 50.0 50.0 - 55.0 55.0 - 60.0 60.0 - 65.0 65.0 - 70.0 > 70.0 10.0 m/s 10 .0 m /s 45 50 55 60 25 30 35 2000 07 01 00 +300 (2000 07 13 12) 18 O3 Athens Foinokalia Crete Modeling domain Figure 1a < 0.10 0.10 - 0.20 0.20 - 0.40 0.40 - 0.70 0.70 - 1.00 1.00 - 1.50 1.50 - 2.00 2.00 - 3.00 3.00 - 4.00 4.00 - 5.00 5.00 - 7.00 7.00 - 10.00> 10.00 10.0 m/s 10. 0 m/ s 45 50 55 60 25 30 35 2000 07 01 00 +300 (2000 07 13 12) 18 NOx Athens Foinokalia Modeling domain Crete Figure 1b 33 (b) Fig. 1. Simulation results of the (a) ozone and (b) nitrogen oxides surface mixing ratio for an extended grid using the CTM-NILU regional
model (unit in ppb) on 13 July 2000 (12:00 h, level 18, surface layer). Compare Fig. 4a.
From this follows that there is a need to study the physico-chemical processes which control the dynamics of aerosols and photo-oxidants in the Mediterranean area combining modeling and field studies. Information is still scarce to sup-port measurement and modelling studies in a consistent way across the regional, mesoscale and local spatial scales to re-veal the atmospheric composition and variability of particu-late matter (PM) (Ackermann et al., 1998; Lurmann et al., 1997; Seigneur, 2001; Russell and Dennis, 2000; Pilinis and Seinfeld, 1987).
Two extensive measurement campaigns were performed to examine the characteristics and dynamics of photochemi-cal pollutants and fine particles in the Eastern Mediterranean area between the Greek mainland and the island of Crete (Smol´ık et al., 2003). Sampling took place during 4 weeks in July 2000 and 1 week in January 2001 at the Finokalia station and onboard the research vessel “Aigeaion”. The Fi-nokalia station (35◦190N, 25◦400E) is a remote coastal site eastward of Herakleion (the largest city of the island) atop a hill (elevation 130 m) facing the sea within the sector from 270◦to 90◦(Mihalopoulos et al., 1997).
Mihalopoulos et al. (1997) describe the Finokalia site in detail and report concentrations of the major soluble ions collected over a one-year period. Ozone concentrations at Finokalia exhibit a well-defined seasonal cycle with a max-imum during the summer months and elevated levels (up to 80 ppbv) during daytime (summer) and over time periods of several days (summer) (Kouvarakis et al., 2000). Further-more, ozone levels in the Eastern Mediterranean seem to be dominated by long range transport (Kouvarakis et al., 2000). In addition, non sea salt sulphate (Nss-SO4)and the SO2 lev-els in Eastern Mediterranean were strongly influenced by re-gional transport (Sciare et al., 2003).
During the measurement campaigns an extensive set of instrumentation was employed to determine the physico-chemical characteristics of aerosol and gaseous pollutants. In particular, measurements focused on size-resolved
sam-pling for the aerosol mass on a daily basis with subse-quent analysis for ionic species, crustal and trace elements. In addition, total aerosol mass, equilibrium trace gases, as well as detailed size-distribution measurements in terms of aerosol number by optical and differential mobility methods for the fine aerosol fraction were undertaken. Other comple-mentary measurements included black carbon concentration by optical transmission methods, aerosol optical properties, and thermal analysis of selected samples. Relevant photo-oxidants and inorganic trace gases were monitored by proto-type and conventional instruments.
Photochemical modeling is a necessary component in the study of the dynamics of gaseous pollutants and particulate matter, providing a platform for the understanding of the variability and spatial-temporal patterns of these pollutants (Pilinis and Seinfeld, 1987; Binkowski and Shankar, 1995; Lurmann et al., 1997; Ackermann et al., 1998; Pai et al., 2000; Jacobson, 1997). A combined intensive modelling study and comparison with available experimental data for ozone/fine particles in the Mediterranean area should offer valuable information for characterizing their dynamics and association. The current modelling work covers short peri-ods in summer and winter and the findings of this work have to be seen in perspective and in relation with previous works in the region (Zerefos et al., 2002; Bardouki et al., 2003; Sciare et al., 2003; Kouvarakis et al., 2000).
The objective of the current modeling work is mainly to apply the UAM-AERO mesoscale model in the eastern Mediterranean in order to assess the performed field cam-paigns and determine that the applied mesoscale model is fit for this purpose.
A detailed modeling study has been performed using the UAM-AERO mesoscale air quality model (Lurmann et al., 1997). Meteorological input data were provided by the RAMS (Pielke et al., 1992) prognostic meteorological model whereas gaseous regional data on background concentration were obtained from the NILU-CTM model (Flatøy et al.,
M. Lazaridis et al.: Mesoscale modeling in the Eastern Mediterranean 929
2000) and on particulate matter from the EMEP model (Ap-Simon et al., 2001). The present study represents one of the first applications of a modified UAM-AERO model com-bined with the prognostic meteorological model (RAMS) for the southern Mediterranean and comparison between mod-eled and measured data for particulate matter. In addition, the current modeling application is one of the first ones to study combined aerosol and photo-oxidant processes together with extensive comparisons with field data.
Predicted concentrations patterns of aerosols and gaseous species in the eastern Mediterranean area show that long range transport and natural emission sources are important. The term “long range transport” in the discussion of the mod-elling results refers to transport from outside the modmod-elling UAM-AERO domain. As in previous studies (Lurmann et al., 1997), the model results depend mainly on the charac-teristics of the particulate matter emissions. Determination of the wind driven resuspension of aerosols is required to evaluate the crustal material contribution to the aerosol mass size distribution. Poor agreement mainly during the summer period for specific particulate matter chemical components reflects the uncertainty in the emission inventory data.
2 Material and methods
2.1 Description of the domain
The model domain (58×74 grid points), covers SE Greece (the inner black rectangular included in Fig. 1). Five vertical layers were used: two below and three above the diffusion break. The grid was defined in the UTM coordinate system. The UTM zone 34 was used for the definition of the grid above Greece, which means a central meridian of 21◦E. The
SW corner coordinates of the grid are the following (accord-ing to the WGS84 system) East(accord-ing: 692 089 and North(accord-ing: 3 868 229. This corresponds to the geographical coordinates: 34◦5600800latitude and 23◦0600200longitude.
The region of interest includes marine (the Aegean and Cretan Seas), island (Cyclades, Crete) and continental (At-tica and Peloponnesus) parts of southern Greece. A com-plicated topography (high mountains, deep sea and scattered small islands), combined with the long sunny and humid pe-riods, strong winds and one of the most polluted European cities (Athens) to the NW, inhabited by almost half of the country’s population, characterize the region.
In the southern part of the modeling domain is the is-land of Crete, mid-distance between Athens and the northern African coast. It is mainly mountainous, with all major cities located at the north coast. The total population rises up to 600 000, while at summer periods this number can increase significantly, due to high load of tourism, part of which is scattered all over the island, but the majority is mainly con-centrated along the northern coast.
The modelling results are compared with extensive mea-surements performed at Finokalia which is a remote coastal site, situated on the top of a hill (elevation 130 m), on the NE part of the island (Smol´ık et al., 2003). In addition, the mod-elling results were compared with measurements performed on board a research vessel during July 2000 and with some data from the city of Herakleion on Crete, 70 km to the west of Finokalia.
The emissions inputs, except for PM10 obtained from TNO (Berdowski et al., 1998), are from the EMEP database, from the CTM-NILU regional model (initial and back-ground concentrations) and from detailed emission inven-tories for biogenic species (isoprene and terpenes), resus-pended dust and sea salt (Aleksandropoulou and Lazaridis, 2004; Lazaridis et al., 2003). The concentrations for the 24 gaseous species considered in the NILU-CTM regional model were used for the simulations performed with the UAM-AERO model as the background and initial concentra-tions (Flatøy et al., 2000). However, the NILU-CTM model does not implement particulate matter emissions.
The spatial distribution of the emissions of CO, SOx, NOx, NMVOC, NH3and PM was improved on the basis of the allocation of emissions as given by EMEP/CORINAIR, 2002, landuse and population density data. Particular focus was on the estimation of natural emissions and especially NMVOC (isoprene, terpene) emitted by vegetation, sea salt particles and resuspended soil dust (Andreae, 1995; Aleksan-dropoulou and Lazaridis, 2004).
Emission estimates were compiled using the methodology given in “Atmospheric Emissions Inventory Guidebook”, CORINAIR (EMEP/CORINAIR, 2002). A bottom-up ap-proach based on land use and meteorology data is followed in the evaluation of biogenic and natural emissions (Simpson et al., 1995, 1999). Natural emissions were calculated with hourly temporal resolution, anthropogenic data as annual av-erages. The emissions were allocated on a 5×5 km2grid.
An example of the surface background concentrations of ozone and nitrogen dioxide calculated with the CTM-NILU model is presented in Fig. 1. High ozone and NOx concen-trations are calculated downwind of the Athens metropoli-tan area. The above initial concentrations, representing 3-D hourly values (in ppb) were used as background concentra-tions of the domain which is modeled with the UAM-AERO model.
2.2 The three-dimensional photochemical modeling and prognostic meteorological tools
The UAM-AERO mesoscale model is a gas/aerosol air qual-ity model that is based on the model UAM version IV (Lur-mann et al., 1997). Several modifications have been intro-duced in the UAM-AERO mesoscale model compared to the standard UAM-IV model, including new preprocessors for biogenic and natural emissions, new deposition routines and inorganic equilibrium chemistry module. In addition,
930 M. Lazaridis et al.: Mesoscale modeling in the Eastern Mediterranean
gas-to-particle conversion routines are included for treating secondary formed inorganic and organic aerosols. The emis-sion inventories are based on EMEP data (EMEP, 2003), whereas more detailed inputs for biogenic emission, resus-pended dust, sodium and chlorine were calculated using newly developed methodologies combined with the UAM-AERO model (Aleksandropoulou and Lazaridis, 2004). The model simulations were initiated 24 h before the beginning of each modeling period. This procedure was introduced to reduce the effect of not well defined initial conditions on the model results.
The UAM-AERO model allows the use of various alter-native chemical mechanisms. The one employed for this case study is the Carbon Bond-IV (CB-IV), where species are lumped according to the type of their C-C bonds. A large number of reactions, involving 47 species are taken into account. The CB-IV chemical scheme has a limitation of not considering the ambient temperature and the background aerosol concentration in the calculations of the secondary or-ganic aerosols. This has also an effect on the production of secondary gaseous pollutants as the ozone (Griffin et al., 1999).
The meteorological inputs were obtained using the RAMS (version 4.29) prognostic meteorological model (Pielke et al., 1992). RAMS combines a non-hydrostatic cloud model (Tripoli and Cotton, 1982) and a hydrostatic mesoscale model (Mahrer and Pielke, 1977). It was developed for simu-lating atmospheric phenomena with resolutions ranging from tens of kilometres to a few metres. There is no lower limit to the domain size or to the grid cell size. A general de-scription of the model and its capabilities is given in Pielke et al. (1992).
2.3 Application of the modeling system in the Eastern Mediterranean
The combined UAM-AERO and RAMS modelling frame-work has been applied to model the summer and winter cam-paigns of the EU project SUB-AERO held on the Finokalia station on Crete and aboard the research vessel “Aigeaion”, which cruised across the Eastern Mediterranean area be-tween the Greek mainland and Crete. Sampling took place during 4 weeks in July 2000 and at Finokalia for 1 week in January 2001.
The simulations were conducted for these two to investi-gate seasonal differences in the fate of the pollutants. Two sub-periods were examined for the summer period: 13–16 and 26–30 of July, the second one chosen to coincide with the marine part of the campaign.
The synoptic conditions over Central and Eastern Mediter-ranean in July 2000 were characterized by a high-pressure system over the Central and Eastern Mediterranean and north Africa. The passage of relatively shallow disturbances over south Europe towards the Balkans and the Black Sea strengthened the pressure gradient over NW Turkey and the
Dardanelles Gap. As a result, a westerly flow was evident on the 15th and 16th while on the following seven days the Etesians were established. During the summer period a char-acteristic flow pattern, the Etesians, appears over the Aegean Sea. This is a regional scale northerly flow with significant diurnal variation (Kallos et al., 1993). The Etesians are the result of the interaction of two major semi-stationary weather systems: the easterly extensions of the Azores anticyclone and the low pressure system over the Anatolian Plateau. This formation has as a result the development of a pressure gra-dient, which favors the transport of air masses from North to South. The Etesians are acting as a carrier for the transport of air pollutants from Eastern Europe towards the Eastern Mediterranean region.
Between 18–28 July 2000 the air flow over Finokalia was from the north and had earlier passed over the western coast of the Black Sea region and during the last three days of this period, where peak mass concentrations were observed, over the Aegean Sea. On the last two days, trajectories to Finokalia came from the southeast after having passed over north Africa and the Mediterranean Sea.
During the winter period the meteorological conditions were characterised by a low pressure system over the eastern part of the Mediterranean on 6 January 2001. There was a relatively strong northerly flow over the NE Mediterranean, which dissipated throughout the following 24-hours as the depression moved away towards the Middle East. To the west, a deep and extended Atlantic depression covered Cen-tral and Southern Europe. This system reached the CenCen-tral Mediterranean on 8 January and then moved north-eastward through the Balkans towards the Black Sea region. From 8 to 9 January a southerly synoptic flow was established over the area of interest. As the depression moved away towards the Black Sea region, a high-pressure system progressively developed over the Central Mediterranean. On 10 January a relatively strong north-westerly synoptic flow was apparent over the Central and NE part of the Mediterranean. This flow dissipated throughout the following 24-h. On 11 to 12 January, the synoptic flow over the area under consid-eration was relatively weak. The wind field over the land was modified by the landscape. Over the Aegean maritime area a weak northerly current was established while over the Central Mediterranean and the Ionian Sea the synoptic flow was westerly. On 13 January a new depression from the west reached the Central Mediterranean while a strong anti-cyclonic circulation dominated over Central and Eastern Eu-rope. These synoptic conditions favoured the development of a strong pressure gradient over the NE Mediterranean region. A strong southerly flow was evident over the Ionian Sea and the southern part of the Aegean while a strong easterly-north-easterly flow prevailed to the north.
The calculated spatial distribution of the concentration of ozone, nitrogen dioxide, sulphur dioxide, sodium, ammo-nium in the aerosol phase, carbon monoxide, resuspended dust and total PM10are presented in Fig. 2 for 30 July 2000.
M. Lazaridis et al.: Mesoscale modeling in the Eastern Mediterranean 931 Figure 2a Figure 2b 34 (a) Figure 2a Figure 2b 34 (b) Figure 2c Figure 2d 35 (c) Figure 2c Figure 2d 35 (d) Fig. 2. Surface spatial distribution of (a) O3(b) NO2(c) SO2(d) Na+(e) NH+4 (f) CO, (g) resuspended dust and (h) PM10 at 30 July
12:00 h.
There are higher concentrations of particulate matter, carbon monoxide, nitrogen dioxide and ozone downwind of Athens and the transport of pollutants from outside the modelling domain is also important. The regional transport is related to the prevailing meteorological conditions. The predicted pattern of O3shows a band of high concentrations extend-ing from the Athens metropolitan area to the middle of the Aegean Sea and lower concentrations in a narrow area in the western part of the domain and above Crete.
The concentration of aerosol and gaseous pollutants in the area depends on the prevailing meteorological conditions, and it takes only a few hours for the boundary conditions to have a significant impact on the concentrations at the centre
of the domain, as shown in Fig. 2 for O3, NO2, SO2, PM and CO. Also natural emissions such as sea salt and resuspended dust are correlated with the meteorological fields in the mod-elling domain (Fig. 2d, g). The spatial distribution of PM10 reflects where sea salt is produced and agrees well with the primary PM emission patterns. The spatial pattern of sodium is high over the Aegean sea (average value of 3.5 µg/m3 on-board the research vessel “Aigeaion” between 26–29 July 2000) and lower onshore (average value of 1.5 µg/m3during the summer measurement period), decreasing further with distance from the coastline. The spatial pattern agrees well with the primary PM emission patterns.
932 M. Lazaridis et al.: Mesoscale modeling in the Eastern Mediterranean Figure 2e Figure 2f 36 (e) Figure 2e Figure 2f 36 (f) Figure 2g Figure 2h 37 (g) Figure 2g Figure 2h 37 (h) Fig. 2. Continued.
A diurnal variation of the PM10concentration is shown in Fig. 3. Figure 3 depicts the dynamic change in the concen-tration of pollutants in the eastern Mediterranean due to me-teorological changes and emissions from local areas. In the morning of 14 July (Fig. 3b) strong northwest winds bring in particulate matter from Athens to the southern part of the Aegean Sea at the same time as the sea salt emissions are considerable. The same meteorological conditions prevail until 10:00 h. At this time the wind changes to the northerly direction; Fig. 3b. From 17:00 h there is a decrease in the wind velocity with more stagnant meteorological conditions while at 21:00 h the wind direction is from the west. It is ev-ident that the meteorological conditions to a large extent are
responsible for the dynamics of the pollutant concentrations in the area and the consequent human exposure. Elevated particulate matter concentrations are expected both when the air masses come from the west/north-west (western Europe and continental Greece) and from the south. The former would carry anthropogenic aerosols (with size distributions mainly in the fine sector), while the latter contributes to in-creases of coarse PM, transporting dust from North Africa and the Saharan Desert. The Black Sea region is expected to contribute to anthropogenic aerosols (combustion etc.) as well, while during easterlies contribution both to fine and coarse modes can be expected, depending on whether the air-parcel crosses urban areas or deserts.
M. Lazaridis et al.: Mesoscale modeling in the Eastern Mediterranean 933 Figure 3a Figure 3b 38 (a) Figure 3a Figure 3b 38 (b) Figure 3c Figure 3d 39 (c) Figure 3c Figure 3d 39 (d) Fig. 3. Surface spatial distribution of PM10at 14 July at (a) 02:00 h (b) 12:00 h (c) 17:00 h and (d) 21:00 h.
The regional transport for ozone and particulate matter can be also depicted in Fig. 4 where we present the surface con-centration for the period 13–16 July 2000 at 12:00 h. A north westerly flow during this period is shown in Fig. 4 where el-evated concentrations of ozone and particulate matter (e.g. Fig. 4c, d) infiltrating in the modelling domain. The same behaviour is also depicted for several chemical components such as carbon monoxide, nitrogen oxides, sulphur dioxide and volatile organic components.
Regional transport in the Mediterranean area of ozone and other pollutants is also occurring at higher altitudes and in the free troposphere as shown by others (Kouvarakis et al., 2000; Lelieveld et al., 2002). Here regional transport of ozone,
particulate matter and other gaseous pollutants contributes to the pollutant levels in the area studied. An average calcu-lated vertical profiles for ozone during January 2001 and July 2000 are shown in Fig. 5 for Finokalia, Herakleion and for an average profile over the sea. Ozone values range between 29 and 36 ppb for January 2001 whereas values between 34 and 38 have been calculated for July 2000. Surface ozone has a diurnal profile, determined by mixing height fluctua-tions. Downward flux of ozone from the free troposphere to the surface contributes to enhanced concentration levels. No observations of the vertical profiles of pollutants have been taken in the area and therefore the modelling results cannot be validated.
934 M. Lazaridis et al.: Mesoscale modeling in the Eastern Mediterranean Figure 4a Figure 4b 40 (a) Figure 4a Figure 4b 40 (b) Figure 4c Figure 4d 41 (c) Figure 4c Figure 4d 41 (d) Fig. 4. Surface spatial distribution of O3and PM10for 13 July 2000 at 12:00 h (a–b), 14 July 2000 (c–d), 15 July 2000 (e–f) and 16 July
2000 (g–h).
The importance of regional transport of PM10 into the area of interest was further examined using the UAM-AERO model and setting the particulate emissions in the modelling domain to zero. The average reduction in the PM10 concen-tration inside the modelling domain ranged from 60% to 45% for the summer and winter modelling periods, respectively. The results here reflect the prevailing meteorological con-ditions during the modelling period. Forest fire emissions and Saharan dust input were not accounted for, and since the modelling period corresponds to only a few days no cer-tain conclusions can be drawn for longer periods. However, the current results are supported by previous studies which
showed the importance of the long range transport of pollu-tants in the Mediterranean area (Sciare et al., 2003; Zerefos et al., 2002).
Comparison with the experimental field data from the Fi-nokalia station, Herakleion and onboard AIGEAION during the summer and winter periods is shown in Fig. 6 for O3. The variations of the modeled results both with the EMEP and the CTM-NILU models follow those of the measured data. Also, the diurnal variation of the predicted concentrations was in qualitative agreement with the measured data. Tables 3–5 show a quantitative comparison between modeled and mea-sured gaseous species components for the meamea-sured periods.
M. Lazaridis et al.: Mesoscale modeling in the Eastern Mediterranean 935 Figure 4e Figure 4f 42 (e) Figure 4e Figure 4f 42 (f) Figure 4g Figure 4h 43 (g) Figure 4g Figure 4h 43 (h) Fig. 4. Continued.
Average winter O3 vertical profiles at various environments
0 1000 2000 3000 4000 5000 25 27 29 31 33 35 37 O3 concentration (ppb) A lti tu d e (m )
Herakleion (NILU-CTM background) Finokalia (NILU-CTM background) Marine (NILU-CTM background)
Figure 5a
Average summer O3 vertical profiles at various
environments 0 1000 2000 3000 4000 5000 30 32 34 36 38 40 O3 concentration (ppb) A lti tud e (m )
Herakleion (NILU-CTM background) Finokalia (NILU-CTM background)
Marine (NILU-CTM background)
Figure 5b
44
(a)
Average winter O3 vertical profiles at various environments
0 1000 2000 3000 4000 5000 25 27 29 31 33 35 37 O3 concentration (ppb) A lti tu d e (m )
Herakleion (NILU-CTM background) Finokalia (NILU-CTM background) Marine (NILU-CTM background)
Figure 5a
Average summer O3 vertical profiles at various
environments 0 1000 2000 3000 4000 5000 30 32 34 36 38 40 O3 concentration (ppb) A lti tud e (m )
Herakleion (NILU-CTM background) Finokalia (NILU-CTM background)
Marine (NILU-CTM background)
Figure 5b
44
(b) Fig. 5. Average vertical profile of ozone during (a) January 2001 (b) July 2000 for three different environments using the UAM-AERO
model. The CTM-NILU model was used for obtaining the initial and background ozone concentration.
936 M. Lazaridis et al.: Mesoscale modeling in the Eastern Mediterranean
Measured vs predicted O3values at Finokalia,
13-16 July, 2000 0 20 40 60 80 100
11-Jul 12-Jul 13-Jul 14-Jul 15-Jul 16-Jul 17-Jul 18-Jul
Date C o nc e n tr a tio n ( p p b )
modelled (NILU-CTM) modelled (EMEP) measured
Figure 6a
Measured versus predicted O3values at Finokalia, 26-30 July, 2000 0 20 40 60 80 100
25-Jul 26-Jul 27-Jul 28-Jul 29-Jul 30-Jul 31-Jul 1-Aug
Date C o nc e n tr a ti o n (p pb )
modelled (NILU-CTM) modelled (EMEP) measured
Figure 6b
45
(a)
Measured vs predicted O3values at Finokalia,
13-16 July, 2000 0 20 40 60 80 100
11-Jul 12-Jul 13-Jul 14-Jul 15-Jul 16-Jul 17-Jul 18-Jul
Date C o nc e n tr a tio n ( p p b )
modelled (NILU-CTM) modelled (EMEP) measured
Figure 6a
Measured versus predicted O3values at Finokalia, 26-30 July, 2000 0 20 40 60 80 100
25-Jul 26-Jul 27-Jul 28-Jul 29-Jul 30-Jul 31-Jul 1-Aug
Date C o nc e n tr a ti o n (p pb )
modelled (NILU-CTM) modelled (EMEP) measured
Figure 6b
45
(b)
Measured versus predicted O3 values at Finokalia vs vessel, 26-30 July, 2000 0 20 40 60 80 100
25-Jul 26-Jul 27-Jul 28-Jul 29-Jul 30-Jul 31-Jul
Date C o n cen tr at io n ( p p b )
modelled (NILU-CTM) modelled (EMEP) measured
Figure 6c
Measured vs predicted O3 values at Finokalia, 7-14 January, 2001 0 20 40 60 80
6-Jan 7-Jan 8-Jan 9-Jan 10-Jan 11-Jan 12-Jan 13-Jan 14-Jan 15-Jan 16-Jan
Date C o n cen tr at io n ( p p b )
measured modelled (EMEP) modelled (NILU-CTM)
Figure 6d
46
(c)
Measured versus predicted O3 values at Finokalia vs vessel, 26-30 July, 2000 0 20 40 60 80 100
25-Jul 26-Jul 27-Jul 28-Jul 29-Jul 30-Jul 31-Jul
Date C o n cen tr at io n ( p p b )
modelled (NILU-CTM) modelled (EMEP) measured
Figure 6c
Measured vs predicted O3 values at Finokalia, 7-14 January, 2001 0 20 40 60 80
6-Jan 7-Jan 8-Jan 9-Jan 10-Jan 11-Jan 12-Jan 13-Jan 14-Jan 15-Jan 16-Jan
Date C o n cen tr at io n ( p p b )
measured modelled (EMEP) modelled (NILU-CTM)
Figure 6d
46
(d)
Measured vs predicted O3 values at Herakleion, 7-14 January, 2001 0 10 20 30 40 50 60
6-Jan 7-Jan 8-Jan 9-Jan 10-Jan 11-Jan 12-Jan 13-Jan 14-Jan 15-Jan 16-Jan
Date C o n cen tr at io n ( p p b )
modelled (NILU-CTM) modelled (EMEP) measured
Figure 6e
47
(e)
Fig. 6. Comparison between modeled (EMEP and NILU-CTM) and measured ozone mixing ratio for the period (a) 13–16 July 2000 at
Finokalia (b) 26–30 July 2000 at Finokalia (c) 26–30 July 2000 onboard the research vessel Aigeaion (d) 7–15 January 2001 at Finokalia (e) 7–15 January 2001 at Herakleion. Chemically speciated PM 0 5 10 15 20 25 30
13-16 July, Finokalia 26-30 July, Finokalia 26-29 July, Vessel 7-14 January, Finokalia
C o n cen tr at io n ( µ g /m 3)
Na+ Cl- SO4= Crustal OC EC H2O H+ NH4+
NO3-Figure 7a
48
Fig. 7. Chemical averaged resolved PM10mass between during the
measurement periods (a) 13–16 July 2000 at Finokalia (b) 26–30 July 2000 at Finokalia (c) 26–29 July onboard the research vessel Agaion (d) 7–14 January 2001 at Finokalia.
Figure 7 shows the average modelled average daily pro-file of the chemical composition of PM10for the period 13–
16, 26–30 July 2000 and 7–14 January 2001 at Finokalia and between 26–29 July onboard the research vessel Aigeon. Crustal material due to the resuspension from the soil surface dominates in the summer period. Elemental carbon is prob-ably underestimated, since there were mainy fires in Greece during this period, and these were not accounted for in the model. Other important species are ammonium, sulphur, ni-trates and sea-salt particles. From the PM10 composition data it is important to note the significant natural contribution (crustal oxides, sodium, chlorine) to the particulate matter mass during the summer period (close to 54%); and close to 31% in winter. It must be noted that the model period is short and certain conclusions can not be drawn for longer periods. The average PM10 concentration during the research vessel campaign is also shown in Fig. 7. Elevated concentration has been calculated compared to the Finokalia station mainly due to elevated crustal materials. The meteorological conditions favour the regional transport during the period of the boat measurements. The average PM10concentration during the winter campaign for Finokalia (January, 2001) shows that the
M. Lazaridis et al.: Mesoscale modeling in the Eastern Mediterranean 937
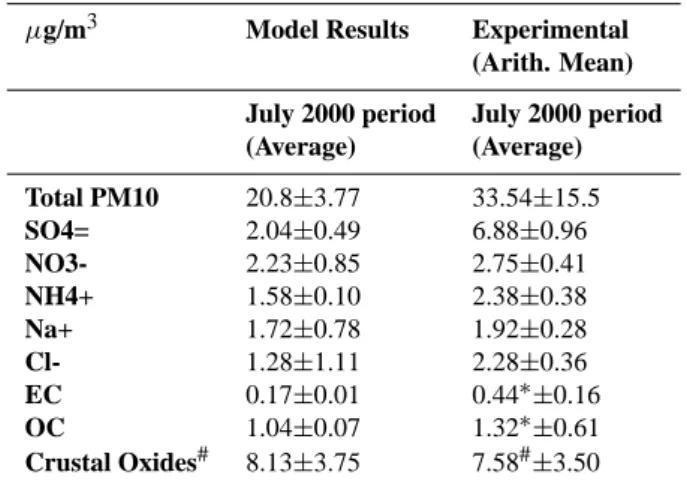
Table 1. Comparison between experimental field data and
mod-elling results (particulate matter chemical components) for the 13– 16 and 25–30 July 2000 periods at the Finokalia station.
µg/m3 Model Results Experimental (Arith. Mean) July 2000 period July 2000 period (Average) (Average) Total PM10 20.8±3.77 33.54±15.5 SO4= 2.04±0.49 6.88±0.96 NO3- 2.23±0.85 2.75±0.41 NH4+ 1.58±0.10 2.38±0.38 Na+ 1.72±0.78 1.92±0.28 Cl- 1.28±1.11 2.28±0.36 EC 0.17±0.01 0.44∗±0.16 OC 1.04±0.07 1.32∗±0.61 Crustal Oxides# 8.13±3.75 7.58#±3.50
Table 2. Comparison between experimental field data and
mod-elling results particulate matter chemical components) for 7–14 Jan-uary 2001 at the Finokalia station.
µg/m3 Model Results Experimental (Arith. Mean) 7–14 January 2001 7–13 January 2001 (Average) (Average) Total PM10 9.35±2.45 14.55±6.5 SO4= 2.18±0.64 2.36±0.38 NO3- 2.50±0.91 1.53±0.23 NH4+ 0.77±0.18 0.77±0.086 Na+ 1.11±0.46 1.20±0.18 Cl- 0.59±0.74 2.06±0.30 EC 0.20±0.05 0.15∗±0.04 OC 0.83±0.2 0.45∗±0.19 Crustal Oxides# 1.14±0.87 1.37#±0.60
∗TSP (Total Suspended Particles). The EC/OC measurements were
performed for TSP ambient levels.
#1.16*(1.90*Al+2.15*Si+1.41*Ca+1.67*Ti+2.09*Fe)
dominating species are sulphate, nitrate, and crustal material. Other important compounds are Na+and Cl−, typical for a
coastal site.
In Tables 1–2 we present average predicted and observed chemical composition of particulate matter during the sum-mer and winter simulation periods for 24-h averages. Mod-eled and observed PM10 agree better in the winter period than in the summer. Ammonium sulphate and crustal ma-terial dominate PM10mass, whereas nitrate and sea salt also are important for the chemical mass closure. There is a dis-crepancy between the gravimetric measured PM10
concentra-Table 3. Comparison between experimental field data and
mod-elling results (gaseous species) for the 13–16 and 25–30 July 2000 periods at the Finokalia station.
Parameter Finokalia (Summer) Model Results
(ppbv) (ppbv) O3 60±12.02 50±4.25 NO2 2.25*** (10–20/7)±0.85 0.2±0.09 NO <0.05±0.08 0.03±0.026 SO2 0.84*±0.72 0.6±0.34 HNO3 0.45* (20–30/7)±0.41 0.1±0.16 0.15** (10–20/7)±0.17 HONO 0.13** (10–20/7)±0.13 0.05±0.001
*: from annular denuder measurements
*: prototype wet effluent diffusion denuder technique/chemi-luniscent detection
**: prototype chemiluminescence ozone and nitrogen dioxide de-tectors
Table 4. Comparison between experimental field data and
mod-elling results (gaseous species) for the period 26–29 July 2000 on-board the research vessel “Aigeaion”.
Parameter Aegean sea (summer) Model Results
(ppbv) (ppbv) O3 59.4***±13.25 52.6±6.9 NO2 7.1***±7.59 3.5±0.77 SO2 1.56* 2.1±1.08 HNO3 0.33*±0.76 0.47±1.1 HONO 0.12**±0.36 0.05±0.01
*: from annular denuder measurements
*: prototype wet effluent diffusion denuder technique/chemi-luniscent detection
**: prototype chemiluminescence ozone and nitrogen dioxide de-tectors
Table 5. Comparison between experimental field data and
mod-elling results (gaseous species) for 7–14 January 2001 at the Fi-nokalia station.
Parameter Finokalia (Winter) Model Results
(ppbv) (ppbv) O3 41.7±8.09 31.3±3.8 NO2 0.52***±0.52 0.7±0.11 NO <0.05 0.02±0.04 HNO3 0.04**±0.03 0.02±0.18 HONO 0.07**±0.05 0.03±0.004
*: from annular denuder measurements
*: prototype wet effluent diffusion denuder technique/chemi-luniscent detection
**: prototype chemiluminescence ozone and nitrogen dioxide de-tectors
938 M. Lazaridis et al.: Mesoscale modeling in the Eastern Mediterranean
Experimental vs. measured SO4=, at Finokalia, July 2000
0 1 2 3 4 5
13-Jul 14-Jul 15-Jul 16-Jul
Date Co n cen ta ti o n measured modelled Figure 8
Experimental vs. measured Na+ mass (PM
10), at Finokalia, January 2001 0 1 2 3 4
7-Jan 8-Jan 9-Jan 10-Jan 11-Jan 12-Jan 13-Jan
Date C o n cen tr at io n (µ g /m 3) measured modelled Figure 9 49
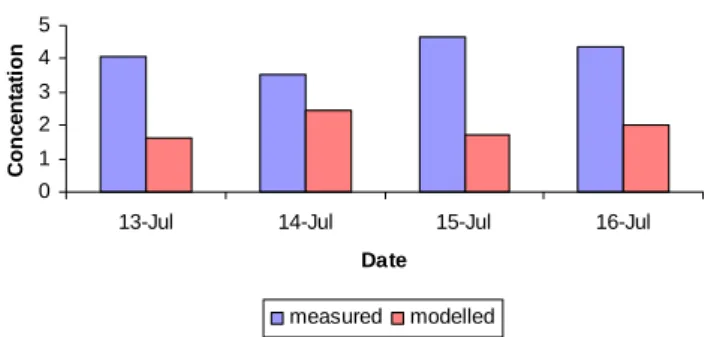
Fig. 8. Comparison between modelling and observed SO4mass
concentration between 13–16 July 2000 at the Finokalia station.
tions and the measured chemical resolved composition. This is due to organic mass, water and experimental errors. The concentration of particulate organic matter (POM) was de-termined by multiplying the OC concentration by 1.7, which is the average ratio of the mass of carbon-containing species to carbon mass assumed to be distributed between the fine and coarse modes with a ratio of 7/3 (Quinn et al., 2000). This may be an uncertainty factor in the calculation of the organic mass present in the PM10concentration. For exam-ple Turpin et al. (2000) suggests a multiplication with 2.5 since the aerosol sampled was mainly of rural or background origin plus aged aerosol from distant anthropogenic sources, plus that elevated concentrations were observed due to for-est fires (wood smoke). Furthermore, there is a discrepancy between modelled and measured particulate matter. Several factors such as forest fires and Saharan dust episodes which were observed during the summer period may be factors for this discrepancy (Smol´ık et al., 2003).
Tables 3–5 show the field concentration of trace gases, in-cluding those in equilibrium with aerosol species and their comparison with the modeling results for Finokalia during the summer period and on the research vessel “Aigeaion” and at Finokalia during the winter period. The modeling data fol-low the same general behaviour as the field observations.
The comparison between calculated and measured daily average PM10 levels for both the summer and winter peri-ods show that there is a considerable underestimation of the PM10mass during summer and better agreement in the win-ter. On 27 and 28 July Saharan dust episodes were iden-tified to contribute significantly to the ambient PM10 con-centration. This is a reason for the significant discrepan-cies between modeled and measured data. The Saharan dust episodes were identified based on satellite data, meteorolog-ical back trajectories and experimental field measurements which identified elevated concentrations of crustal materials. Average total PM10 from the modeling studies is 9.3 µg/m3 for the winter simulation and 20.8 µg/m3 for the summer period. The corresponding value for the measured data is 14.6 µg/m3 for the winter period and 33.5 µg/m3 for the
Experimental vs. measured SO4=, at Finokalia, July 2000
0 1 2 3 4 5
13-Jul 14-Jul 15-Jul 16-Jul
Date Co n cen ta ti o n measured modelled Figure 8
Experimental vs. measured Na+ mass (PM10), at Finokalia,
January 2001 0 1 2 3 4
7-Jan 8-Jan 9-Jan 10-Jan 11-Jan 12-Jan 13-Jan
Date C o n cen tr at io n (µ g /m 3) measured modelled Figure 9 49
Fig. 9. Comparison between modelling and observed Na+mass concentration between 7–13 January 2001 at the Finokalia station.
summer period. The difference in the concentration levels may also be attributed to an underestimation of several chem-ical fractions of the PM mass. There is an underestimation of chlorine and sodium (sea salt) particulate matter emissions, and an underestimation of the sulphate mass and crustal ma-terials from Saharan dust episodes. In addition, forest fires in July 2000 contributed to PM mass but were not included in the modelling study. Furthermore, an important fraction of the measured particulate matter has not been chemically characterized, so that the comparison between model results and measured data is uncertain. The NO−3, NH+4, OC and EC concentrations are in good agreement with the measured data as shown in Tables 1–2. It has to be stressed that the meteorological conditions influence considerably the ambi-ent particulate matter concambi-entration and chemical composi-tion since for example NW winds at the Finokalia stacomposi-tion lead to enhanced sea salt concentrations. Furthermore, it has to be stressed that the modelled results are based on aver-age values on a 5×5 km2grid whereas the measured data at the research station of Finokalia or the onboard the research vessel Aigeaion and this may introduce a source of error in performing the comparison between modelled and measured data.
Figure 8 presents a comparison between measured and predicted SO=4 levels, for Finokalia in July 2000. There is poor agreement between modelled and measured data (modeled data: 2.04±0.49 µg/m3; 6.88±0.96 µg/m3). The sources for SO=4 are mainly anthropogenic from the Greek mainland and from long range transport. The SO=4 particles are mainly emitted from industrial sources. The existence of the State Electricity Organization power plant at Herakleion, as well as air-masses that originate from Athens can strongly influence the levels observed on Crete.
Figure 9 shows the comparison between modeled and measured concentrations for Na+. Sea salt particles are strongly affected by the wind and make an important con-tribution at Finokalia. The modeling data are in general in good agreement with the measured data (modeled data:
M. Lazaridis et al.: Mesoscale modeling in the Eastern Mediterranean 939
1.11±0.46 µg/m3; measured data: 1.20±0.18 µg/m3)except on 9 January where the average measured Na+concentration
is around 3.1 µg/m3whereas the modeled value is 1.0 µg/m3. Although the simulation periods are too short to allow sea-sonal variability of the pollutants to be established, differ-ences between the summer and winter periods are clear both in terms of quantities and diurnal variation patterns. Pollu-tants determined largely by the solar radiation level are more stable during daytime. At the same time the values measured in winter are a lot lower than in summer for ozone, isoprene, PAN, OH and other photooxidants, while the precursors lev-els are elevated (NO, NO2, etc.). Especially, particulate mat-ter concentrations are lower during the winmat-ter mainly due to reduced dust resuspension from the soil and low photochem-ical activity.
3 Conclusions
The combined UAM-AERO/RAMS modeling system is an efficient platform for the simulation of the trans-port/dynamics of particulate matter and photo-oxidant pre-cursors and fits the purpose to use it for simulating the per-formed field campaigns.
The UAM-AERO model was applied to simulate PM and photo-oxidants in the eastern Mediterranean area.
Using the combined UAM-AERO and CTM-NILU it is seen how important photo-oxidant and fine aerosols dynam-ics is in the Mediterranean area, and how regional trans-port contribute significantly to the observed pollution lev-els. When comparing with measurements, the modelling re-sults underestimate the PM10 measured concentrations dur-ing summer. For the winter experimental campaign the com-parison between the model results and the experimental data is slightly better but under-prediction for the total PM10 lev-els is also observed.
Discrepancies between modelled and measured data for the particulate matter are probably mainly due to unresolved particulate matter emissions such as Saharan dust and forest fire emissions during the summer period. The measured val-ues show that resuspension from soil is an important factor in determining the aerosol size distribution during the sum-mer period. A need for chemical quantification of particu-late matter emission inventories in Europe is demonstrated, together with a need for determination of the effect of Saha-ran dust, wild forest fires, and resuspended dust emissions in Southern Europe.
From the modelling results and the comparison with the measured data it can be concluded that the Eastern Mediter-ranean is characterized by a heavy aerosol load during sum-mer composed of anthropogenic (SO=4, NO−3)and biogenic (NH+4)material, Saharan dust and sea-emitted/natural (Na+, Cl−) aerosols. Transport contributes significantly to the high levels observed at remote sites. The most common species are related to the existence of sulfate, nitrate,
am-monium ions, sea salt and Saharan dust, with the formation of (NH4)2SO4among the most important secondary aerosol, as also observed from measurements and supported by the modelling results (Kouvarakis et al., 2002).
Acknowledgements. This work was supported by the European
Commission under grant ENVK2-1999-00052. We would like to thank Z. Veˇceˇra and P. Mikuˇska (Czech Academy of Science, Czech Republic) and also N. Mihalopoulos (University of Crete, Greece) for providing the ozone data. We would like also to thank S. Pandis (Carnegie Mellon University) for his helpful comments and suggestions.
Edited by: R. A. MacKenzie
References
Ackermann, I. J., Hass, H., Memmesheimer, M., Ebel, A., Binkowski, F. S., and Shankar, U.: Modal aerosol dynamics model for Europe: Development and first applications, Atmos. Environ., 32, 2981–2999, 1998.
Aleksandropoulou, V. and Lazaridis, M.: Study of gaseous and par-ticulate matter emissions in Greece, Water, Air, Soil Pollut., 153, 15–34, 2004.
Andreae, M. O.: In Future Climates of the World: A Modelling per-spective (Climatic effects of changing atmospheric aerosol lev-els), A. Henderson-Sellers, Macquarie University, Climatic Im-pacts Centre, Australia, 1995.
ApSimon, H. M., Gonzalez del Campo, M. T., and Adams, H. S.: Modelling long-range transport of primary particulate material over Europe, Atmos. Environ., 35, 343–352, 2001.
Bardouki, H., Liakakou, H., Economou, C., Sciare, J., Smol´ık, J., ˇ
Zd´ımal, V., Eleftheriadis, K., Lazaridis, M., and Mihalopoulos, N.: Chemical composition of size resolved atmospheric aerosols in the eastern Mediterranean during summer and winter, Atmos. Environ., 37, 195–208, 2003.
Benkovitz, C. M., Scholtz, M. T., Pacyna, J., Tarrason, L., Dignon, J., Voldner, E. C., Spiro, P. A., Logan, J. A., and Graedel, T. E.: Global gridded inventories of anthropogenic emissions of sul-fur and nitrogen, J. Geophys. Res.-A, 101(D22), 29 239–29 253, 1996.
Berdowski, J. J. M., Mulder, W., Veldt, C., Vesschedijk, A. J. H., and Zandved, P. Y. J.: Particulate matter emissions (PM10 -PM2.5-PM0.1)in Europe in 1990 and 1993, Technical Report,
Netherlands organization fro Applied Scientific Research, TNO-MEP-R 96/472, Apeldoorn, the Netherland, 1997.
Binkowski, F. S. and Shankar, U.: The regional particulate model 1. Model description and preliminary results, J. Geophys. Res., 100, 26 191–26 209, 1995.
EMEP/CORINAIR: Atmospheric Emission Inventory Guidebook, 3rd Edition, Prepared by the EMEP Task force on Emission In-ventories, EEA Technical Report No. 30, 2002.
EMEP-WMO: Workshop on Strategies for Monitoring of Regional Air Pollution in relation to the need within EMEP, GAW and other international bodies, EMEP/CCC-Report 10/97, 1997. Flatøy, F., Hov, Ø., and Schlager, H.: Chemical forecasts used for
measurement flight planning during the POLINAT 2., Geophys. Res. Lett., 27, 951–954, 2000.
940 M. Lazaridis et al.: Mesoscale modeling in the Eastern Mediterranean
Griffin, R. J., Cocker III, D. R., Flagan, R. C., and Seinfeld, J. H.: Organic Aerosol formation from oxidation of biogenic hydrocar-bons, J. Geophys. Res., 104, 3555–3567, 1999.
Guenther, B., Zimmerman, P. R., Harley, P. C., Monson, R. K., and Fall, R.: Isoprene and monoterpene rate variability: Model evalu-ations and sensitivity analysis, J. Geophys. Res., 98(10), 12 609– 12 617, 1993.
Jacobson, M. Z.: Development and application of a new air pollu-tion modeling system – II: Aerosol module structure and design, Atmos. Environ., 31A, 131–144, 1997.
Kallos, G., Kotroni, V., Lagouvardos, K., and Papadopoulos, A.: On the transport of air pollutants from Europe to North Africa, Geophys. Res. Lett., 25(5), 619–622, 1999.
Kallos, G., Kassomenos, P., and Pielke, R. A.: Synoptic and mesoscale weather conditions during air pollution episodes in Athens, Greece, Boundary-Layer Meteorol., 62, 163–184, 1993. Kouvarakis, G., Tsigaridis, K., Kanakidou, M., and Mihalopoulos, N.: Temporal variations of surface regional background ozone over Crete Island in the southeast Mediterranean, J. Geophys. Res., 105, 4399–4407, 2000.
Lazaridis, M., Spyridaki, A., Solberg, S., Kallos, P. G., Svendby, T., Flatoy, F., Drossinos, I., Housiadas, C., Smol´ık, J., Colbeck, I., Varinou, M., Gofa, F., Eleftheriadis, K., Zdimal, V., and Geor-gopoulos, P. G.: Modeling of combined aerosol and photooxi-dant processes in the Mediterranean area, Water, Air, Soil Pollut. – Focus, 4, 4-5, 3–21, 2004.
Lelieveld, J., Berresheim, H., Borrmann, S., Crutzen, P. J., Den-tener, F. J., Fischer, H., Feichter, J., Flatau, P. J., Heland, J., Holzinger, R., Korrmann, R., Lawrence, M. G., Levin, Z., Markowicz, K. M., Mihalopoulos, N., Minikin, A., Ramanathan, V., de Reus, M., Roelofs, G. J., Scheeren, H. A., Sciare, J., Schlager, H., Schultz, M., Siegmund, P., Steil, B., Stephanou, E. G., Stier, P., Traub, M., Warneke, C., Williams, J., and Ziereis, H.: Global air pollution crossroads over the Mediterranean, Sci-ence, 298, 794–799, 2002.
Lurmann, F. W., Wexler, A. S., Pandis, S. N., Mussara, S., Kumar, N., and Seinfeld, J. H.: Modelling Urban and Regional Aerosols – II, Application to California’s South Coast Air Basin, Atmos. Environ., 31, 2695–2715, 1997.
Mihalopoulos, N., Stephanou, E., Kanakidou, M., Pilitsidis, S., and Bousquet, P.: Tropospheric aerosol ionic composition in the Eastern Mediterranean region, Tellus Ser. B-Chem. Phys. Mete-orol., 49, 314–326, 1997.
Monahan, E. C., Spiel, D. E., and Davidson, K. L.: A model of marine aerosol generation via whitecaps and wave disruption, in Oceanic whitecaps, edited by: Monahan, E. C. and Mac Niocail, G., 167–174, D. Reidel, Norwell, MA, 1986.
Pai, P., Vijayaraghavan, K., and Seigneur, C.: Particulate matter modeling in the Los Angeles basin using the SAQM-AERO, J. Air & Waste Management Association, 50, 32-42, 2000. Pandis, S. N., Harley, R. A., Cass, G. R., and Seinfeld, J. H.:
Sec-ondary organic aerosol formation and transport, Atmos. Envi-ron., 26A, 2269–2282, 1992.
Peters, L. K., Berkowitz, C. M., Carmichael, G. R., Easter, R. L., Fairweather, G., Ghan, S. J., Hales, J. M., Leung, L. R., Pennell, W. R., Potra, F. A., Saylor, R. D., and Tsang, T. T.: The cur-rent state and future direction of eulerian models in simulating tropospheric chemistry and transport of trace species: a review, Atmos. Environ., 29, 189–222, 1995.
Pielke, R. A., Cotton, W. R., Walko, R. L., Tremback, C. J., Lyons, W. A., Grasso, L. D., Nicholls, M. E., Moran, M. D., Wesley, D. A., Lee, T. J., and Copeland, J. H.: A comprehensive Meteoro-logical Modeling System – RAMS. Meteorol. Atmos. Phys., 49, 69–91, 1992.
Pilinis, C. and Seinfeld, J. H.: Continued development of a general equilibrium model for inorganic multicomponent atmospheric aerosols, Atmos. Environ., 21, 2453–2466, 1987.
Quinn, P. K., Bates, T. S., Coffman, D. J., Miller, T. L., Johnson, J. E., Covert, D. S., Putaud, J. P., Neususs, C., and Novakov, T.: Comparison of aerosol chemical and optical properties from the 1st and 2nd Aerosol Characterization Experiments, Tellus, 52B, 239–257, 2000.
Russell, A. and Dennis, R.: NARSTO critical review of photochem-ical models and modeling, Atmos. Environ., 34, 2283–2324, 2000.
Sciare, J., Bardouki, H., Moulin, C., and Mihalopoulos, N.: Aerosol sources and their contribution to the chemical composition of aerosols in the Esatern Mediterranean Sea during summertime, Atmos. Chem. Phys., 3, 291–302, 2003,
SRef-ID: 1680-7324/acp/2003-3-291.
Seigneur, C.: Current status of air quality models for particulate matter, J. Air & Waste Management Association, 51, 1508–1521, 2001.
Seinfeld, J. H. and Pandis, S. N.: Atmospheric chemistry and physics – From air pollution to Climate change, John Wiley and Sons Inc, New York, 1998.
Simpson, D., Guenther, A., Hewitt, C. N., and Steinbrecher, R.: Biogenic emissions in Europe, J. Geophys. Res., 100(D11), 22 875–22 890, 1995.
Simpson, D., Winiwarter, W., Borjesson, G., et al.: Inventorying emissions from nature in Europe, J. Geophys. Res.-A. 104(D7), 8113–8152, 1999.
Smith, M. H., Park, P. M., and Consterdine, I. E.: Marine aerosol concentration and estimated fluxes over seas, Q. J. R. Meteorol. Soc., 119 (512), 809–824, Part A, 1993.
Smol´ık, J., ˇZd´ımal, V., Schwartz, J., Lazaridis, M., Havranek, V., Eleftheriadis, K., Mihalopoulos, N., Bryant, C., and Colbeck, I.: Size resolved mass concentration and elemental composition of atmospheric aerosols over the Eastern Mediterranean area, At-mos. Chem. Phys., 3, 2207–2216, 2003,
SRef-ID: 1680-7324/acp/2003-3-2207.
Sotiropoulou, R. E. P., Tagaris, E., Pilinis, C., Andronopoulos, S., Sfetsos, A., and Bartzis, J. G.: The BOND project: Biogenic aerosols and air quality in Athens and Marseille greater areas, J. Geophys. Res., 109, D05205, 2004.
Thomas, G. E. and Stamnes, K.: Radiative Transfer in the Atmo-sphere and Ocean, Cambridge University Press, New York, 1999. Turpin, J. B., Saxena, P., and Andrews, E.: Measuring and sim-ulating particulate organics in the atmosphere: problems and prospects, Atmos. Environ., 34, 2983–3013, 2000.
Zerefos, C. S., Kourtidis, K., Melas, D., Balis, D., Zanis, P., Kat-saros, L., Mantis, H. T., Repapis, C., Isaksen, I., Sundet, J., Her-man, J., Bhartia, P. K., and Calpini, B.: Photochemical Activity and Solar Ultraviolet Radiation (PAUR) Modulation Factors: An overview of the project, J. Geophys. Res.-A, 107(D18), 8134– 8148, 2002.