HAL Id: hal-00297623
https://hal.archives-ouvertes.fr/hal-00297623
Submitted on 27 Jun 2007
HAL is a multi-disciplinary open access
archive for the deposit and dissemination of
sci-entific research documents, whether they are
pub-lished or not. The documents may come from
teaching and research institutions in France or
abroad, or from public or private research centers.
L’archive ouverte pluridisciplinaire HAL, est
destinée au dépôt et à la diffusion de documents
scientifiques de niveau recherche, publiés ou non,
émanant des établissements d’enseignement et de
recherche français ou étrangers, des laboratoires
publics ou privés.
meadow
D. M. D. Hendriks, J. van Huissteden, A. J. Dolman, M. K. van der Molen
To cite this version:
D. M. D. Hendriks, J. van Huissteden, A. J. Dolman, M. K. van der Molen. The full greenhouse gas
balance of an abandoned peat meadow. Biogeosciences, European Geosciences Union, 2007, 4 (3),
pp.411-424. �hal-00297623�
© Author(s) 2007. This work is licensed under a Creative Commons License.
The full greenhouse gas balance of an abandoned peat meadow
D. M. D. Hendriks, J. van Huissteden, A. J. Dolman, and M. K. van der Molen
Vrije Universiteit Amsterdam, Faculty of Earth and Life Sciences, Department of Hydrology and Geo-environmental Sciences, De Boelelaan 1085, 1081 HV Amsterdam, The Netherlands
Received: 20 December 2006 – Published in Biogeosciences Discuss.: 31 January 2007 Revised: 10 May 2007 – Accepted: 14 June 2007 – Published: 27 June 2007
Abstract. Globally, peat lands are considered to be a sink of
CO2, but a source when drained. Additionally, wet peat lands
are thought to emit considerable amounts of CH4and N2O.
Hitherto, reliable and integrated estimates of emissions and emission factors for this type of land cover have been lack-ing and the effects of wetland restoration on methane emis-sions have been poorly quantified. In this paper we estimate the full greenhouse gas (GHG) balance of a restored natural peat land by determining the fluxes of CO2, CH4 and N2O
through atmosphere and water, while accounting for the dif-ferent Global Warming Potentials (GWP’s).
The site is an abandoned agricultural peat meadow, which has been converted into a wetland nature reserve ten years ago, after which the water level was raised. GHG fluxes were measured continuously with an eddy covariance sys-tem (CO2) and flux chamber measurements (CH4and N2O).
Meteorological and hydrological measurements were col-lected as well. With growing seasons of respectively 192, 168 and 129 days, the annual net ecosystem exchange of CO2 (NEE) was −446+±83 g C m−2yr−1 for 2004,
−311±58 g C m−2yr−1for 2005 and −232±57 g m−2yr−1 for 2006. Ecosystem respiration (Reco) was estimated as
869±668 g C m−2yr−1for 2004, 866±666 g C m−2yr−1for 2005 and 924±711 g C m−2yr−1for 2006. CH4emissions
from the saturated land and water surfaces were high com-pared to the relatively dry land. Annual weighted CH4
emissions were 31.27±20.40 g C m−2yr−1 for 2005 and 32.27±21.08 g C m−2yr−1 for 2006. N2O fluxes were too
low to be of significance. The water balance of the area was dominated by precipitation and evapotranspiration and therefore fluxes of carbon and CH4through seepage,
infiltra-tion and drainage were relatively small (17.25 g C m−2yr−1). The carbon-balance consisted for the largest part of CO2
up-take, CO2respiration and CH4emission from water saturated
Correspondence to: D. M. D. Hendriks ([email protected])
land and water. CO2emission has decreased significantly as
result of the raised water table, while CH4fluxes have
in-creased. In GWP’s the area was a small net GHG sink given as CO2-equiv. of −86 g m−2yr−1(over a 100-year period).
1 Introduction
Human activities have caused an increase in atmospheric concentrations of GHG’s since the pre-industrial era by 30% for CO2, by 150% for CH4 and by 17% for N2O (IPCC,
2001). The European land surface is thought to be absorbing a significant amount of the current industrial CO2emissions
(Janssens et al., 2005) and to be releasing over 40% of the European CH4and N2O emissions (IPCC, 2001). However,
reliable estimates of emissions and emission factors are still lacking.
Unlike industrial emissions, emissions related to land use are controlled by a combination of biological, climatological and management factors and show large spatial and temporal variability. To be able to understand the effects of the rising GHG concentrations in the atmosphere as well as the vari-ability and vulnervari-ability of the natural carbon cycle, knowl-edge of the emission and uptake of carbon by terrestrial sur-faces is necessary.
Peat lands in Europe have formed a large sink of atmo-spheric CO2since the last glacial maximum. This is the
re-sult of their ability to accumulate organic matter at a higher rate than decomposition takes place, mainly as a result of high water tables and therefore anaerobic conditions. Due to these generally wet and anaerobic conditions peat lands are also significant emitters of the GHG CH4and sometimes
N2O (Dr¨osler et al., 2007). The GWP’s of CH4(∼23, over
100 years) and N2O (∼300, over 100 years) are significantly
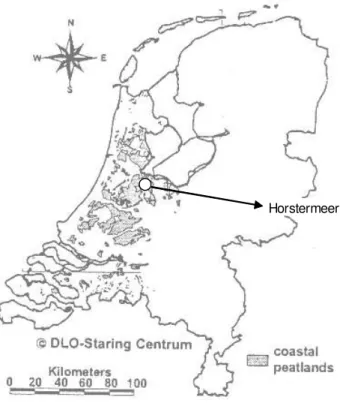
Horstermeer
Fig. 1. Current distribution of peat soils in the western part of the Netherlands (SC-DLO 1992) and location of Horstermeer research site.
Over the last 100 years many peat areas in Europe have been transformed into agricultural land with artificially low water tables. This resulted in an increase of peat oxidation and peat ecosystems have become a strong source of CO2
(Langeveld et al., 1997). Peat oxidation can be reduced and peat areas can be turned into sinks of CO2if water levels are
increased as suggested by a host of literature (e.g. Burgerhart, 2001; Van den Bos et al., 2003). In the western part of the Netherlands 10% of the land (1.6×10³km2) consists of peat soils (Fig. 1). Currently, most of these soils are managed and have artificially low water tables. Plans exist to convert these agricultural areas into wetland nature by raising the water tables and reducing agricultural use both through extensifi-cation and restoration, depending on the area. This change will probably turn the area from a CO2-source in a CO2-sink
and alter the emissions of CH4and N2O.
To compile a full GHG balance of a peat land and to under-stand the mechanisms and processes that affect this balance, comprehensive and long term measurements are needed. All components of that balance should be studied, including the lateral and vertical transport of dissolved carbon and methane out of the system. Currently, only few annual records of CO2, CH4 and N2O measurements in peat lands are
avail-able (Regina et al., 2004; Treat et al., 2007 and Alm et al., 1999). Besides, very few comprehensive integrated measure-ment campaigns have been carried out (Roulet et al., 2007; Soussana, 2007; Dr¨osler et al., 2007).
This paper describes the full spectrum of GHG’s in an abandoned peat meadow area in the western part of the Netherlands which has been transformed from an agricul-tural area into a wetland nature reserve by raising the water level. Our main goal was to quantify all sinks and sources of GHG’s in the area year round and to assess the full GHG balance. This implied, estimating not only the vertical losses and gains through atmosphere, but also vertical and lateral losses of dissolved gases through water and taking into ac-count the different GWP’s.
2 Site description
The Horstermeer site is located on former agricultural land in a drained natural lake in the central part of the Nether-lands (52.144◦ N, 5.043◦E, Fig. 1). The research site has been taken out of agricultural production more than 10 years ago, and has developed into semi-natural grassland. The two meter thick soil consists of peat, overlain with organic-rich lake deposits (Table 1) and is overlying eolian sands of Pleistocene age. After the site was taken out of agricultural production, the ditch water table has been raised to approx-imately 10 cm below the land surface. Large parts of the Horstermeer polder are subject to strong groundwater seep-age from surrounding lake areas and Pleistocene ice pushed ridges. At the measurement location seepage is largely re-duced and even infiltration occurs as a result of the high wa-ter table. The surface of the research area consists of 10% of ditches, of 20% of land that is saturated annual (mostly alongside the ditches) and of 70% of relatively dry land with a fluctuating water table (between 0 to 40 cm below the soil surface) and an aerated top-layer. Management consists only of regulation of the ditch water table; no cattle grazing or harvesting takes place, the only removal of vegetation con-sists of sporadic grazing by roe deer. Vegetation concon-sists of different types of grasses (dominant species Holcus lanatus, Phalaris arundinacea, Glyceria fluitans), horsetail (Equise-tum palustre, fluviatile) reeds (Phragmites australis, Typha latifolia) and high forbs (Urtica diocia, Cirsium arvense, palustre). Main characteristics of the site are given in Ta-ble 2.
3 Methods and instrumentation
All measurements are carried out over the period 1 January 2004 until 31 December 2006, unless mentioned differently.
3.1 Hydrological measurement techniques, data acquisi-tion and processing
Hydrological measurements included water table recordings of the pressure heads using pressure sensors installed in ac-cess tubes in the clayey peat top layer at two locations and
Table 1. Description of a soil profile at the measurement site.
Depth Color Material Decomposition Roots pH water pH Organic matter Permeability
(m) (kg m−3) (KCl) weight (%) (cm day−1)
0–20 7.5YR2/3 clayey peat strong many, 4.1 5.7 5 39.4 4.04
20–30 7.5YR2/2 clayey peat strong 2 5.8 5.1 45.1 0.16
30–48 5Y2/2 black gyttja partly 2 5.5 5.2 32.5
48–68 2.5Y3/1 greenish clayey gyttja slightly few 6 5.6 36.4
68–128 10YR2/3 peaty gyttja none 5.8 5.3 50.3
128–178 2YR1.7/1 reworked peat, clay 6.1 5.6 73.1
178–210 10YR2/3 compact peat
210–250 sand
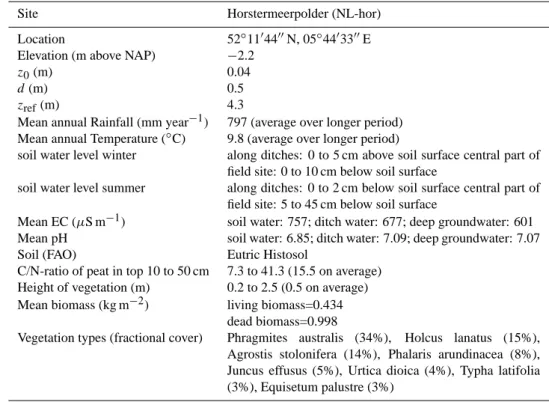
Table 2. Site description: elevation, roughness length (z0), zero plane displacement (d), reference height (zref), rainfall, temperature, water
level, electrical conductivity (EC), pH, soil type and C/N-ratio, biomass and dominant vegetation types. Data observed over 2005 and 2006.
Site Horstermeerpolder (NL-hor)
Location 52◦11′44′′N, 05◦44′33′′E
Elevation (m above NAP) −2.2
z0(m) 0.04
d (m) 0.5
zref(m) 4.3
Mean annual Rainfall (mm year−1) 797 (average over longer period)
Mean annual Temperature (◦C) 9.8 (average over longer period)
soil water level winter along ditches: 0 to 5 cm above soil surface central part of
field site: 0 to 10 cm below soil surface
soil water level summer along ditches: 0 to 2 cm below soil surface central part of
field site: 5 to 45 cm below soil surface
Mean EC (µS m−1) soil water: 757; ditch water: 677; deep groundwater: 601
Mean pH soil water: 6.85; ditch water: 7.09; deep groundwater: 7.07
Soil (FAO) Eutric Histosol
C/N-ratio of peat in top 10 to 50 cm 7.3 to 41.3 (15.5 on average)
Height of vegetation (m) 0.2 to 2.5 (0.5 on average)
Mean biomass (kg m−2) living biomass=0.434
dead biomass=0.998
Vegetation types (fractional cover) Phragmites australis (34%), Holcus lanatus (15%),
Agrostis stolonifera (14%), Phalaris arundinacea (8%), Juncus effusus (5%), Urtica dioica (4%), Typha latifolia (3%), Equisetum palustre (3%)
in the Pleistocene sand aquifer at one location. Also, the wa-ter level in the drainage ditch was measured with a pressure sensor in an access tube. Using the level of the ditch water relative to the height of the overflow weir, discharge could be calculated continuously (Van de Griend, 1989). Water levels were logged on an hourly basis and were all set to the same reference level before further analysis. Outliers and spikes were removed from the dataset. Finally gaps were filled with average values over the surrounding time period. No gaps larger than 24 hours were encountered.
Water samples were taken from the pore water in the clayey peat, the groundwater from the sand aquifer and from the ditch water to determine total carbon (TC) and dissolved CH4 in the three water types. TC was determined as the
sum of total organic carbon (TOC), total inorganic carbon (TIC). Samples were collected using glass filters, installed in the soil or ditch water at 0.2 m depth intervals, and con-nected to the surface using small diameter Teflon tubes. In the soil these filters were installed in a small diameter bore-hole, separated from each other by bentonite plugs. The soil filters were installed at three locations, the ditch filters at two
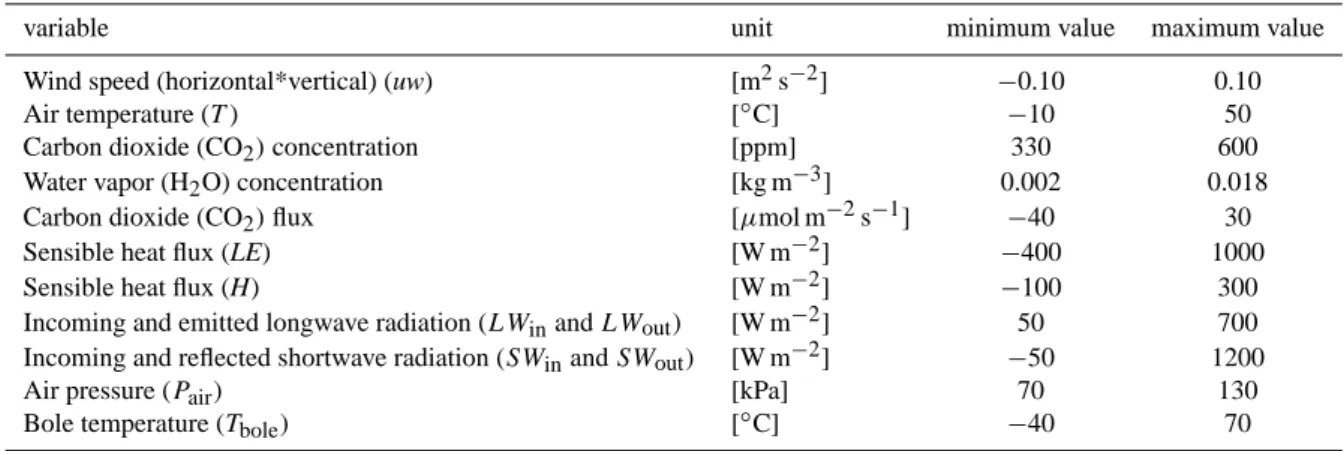
Table 3. Ranges of values used in the quality check of the meteorological data.
variable unit minimum value maximum value
Wind speed (horizontal*vertical) (uw) [m2s−2] −0.10 0.10
Air temperature (T ) [◦C] −10 50
Carbon dioxide (CO2) concentration [ppm] 330 600
Water vapor (H2O) concentration [kg m−3] 0.002 0.018
Carbon dioxide (CO2) flux [µmol m−2s−1] −40 30
Sensible heat flux (LE) [W m−2] −400 1000
Sensible heat flux (H) [W m−2] −100 300
Incoming and emitted longwave radiation (LWinand LWout) [W m−2] 50 700
Incoming and reflected shortwave radiation (SWinand SWout) [W m−2] −50 1200
Air pressure (Pair) [kPa] 70 130
Bole temperature (Tbole) [◦C] −40 70
locations. Samples were taken using a syringe for drawing up the water, after which the sampling tube was connected to a vacuum exetainer using a three-way stopcock. All sampling was performed anaerobic. TC in the water samples was an-alyzed with a Dohrmann DC-190 TC analyzer and dissolved CH4was analyzed by gas chromatography (Hewlett Packard
5890A, Avondale PA, USA) of the gas-filled headspace of the exetainers. The total CH4concentration in the sampled
volume was calculated using the gas-water solubility coeffi-cient.
3.2 Meteorological measurement techniques, data acquisi-tion and processing
Eddy covariance measurements of CO2 concentration,
wa-ter vapour, wind speed and air temperature were performed with a Licor 7500 open path infrared gas analyser (LI-COR Lincoln, NE, USA) and a Windmaster Pro 3 axis Ultrasonic Anemometer (GILL Instruments Limited, Hampshire, UK) directed into the main wind direction. Licor and Anemome-ter were installed at 4.3 m above the surface. Data were logged digitally on a handheld computer at a rate of 10 Hz (Van der Molen et al., 2006). The EUROFLUX methodol-ogy (Aubinet et al., 2000) was applied to the eddy covariance data to calculate the fluxes of momentum, sensible and latent heat and CO2on a thirty minute basis. The method of Nakai
et al. (2006) was used to apply the angle of attack dependent calibration (Gash and Dolman, 2003; Van der Molen et al., 2004).
Additional micrometeorological measurements were ex-ecuted at a tower close by the eddy covariance set up. Air pressure was measured (SensorTechnics pressure trans-ducers, model 144SC1216BARO) as well as wet and dry bulb temperatures (Fast response Chromel-Constantan ther-mocouple with an effective diameter of 0.2 mm, made at the Vrije Universiteit Amsterdam). Incoming and reflected shortwave radiation (Kipp and zonen, Delft, the
Nether-lands) and longwave radiation (Eppley Pyrgeometers, Epp-ley laboratory Inc., Model Precision Infrared Radiometers) were measured. As backup of these radiation balance mea-surements the net radiation was measured (Campbell Sci-entific, Q10). All radiometers were installed at a height of 2.5 m (except incoming long wave radiation at 1.6 m height). Wind direction was monitored with a wind vane (Campbell Scientific Ltd, W200P) on top of the tower (4.6 m height) and wind speed with cup anemometers (Vector Instruments model A100M/A100ML) at 3.0 and 2.0 m height. Soil tem-perature was measured at various depths (0.01, 0.02, 0.04, 0.06, 0.08, 0.10, 0.15, 0.25, 0.40 and 0.60 m) by thermistor probes (Campbell Scientific Ltd, model 107). The canopy skin temperature was measured using infrared thermometers (Everest, model 4000 BL). Precipitation was monitored with a tipping bucket rain gauge (Campbell Scientific Ltd, model ARG100), with a resolution of 0.2 mm, which was installed at 1.05 m above the ground. The instruments were sampled with a data logger (Campbell Scientific, model 23X) every 30 s (2 s for thermocouple) and the data stored as 30 min av-erages and standard deviations.
A quality check was performed during which all outliers and unrealistic values were removed from all eddy covari-ance data and meteorological data (Table 3). Next, gap fill-ing with u∗correction was performed through methods that
are similar to Falge et al. (2001), with consideration of both the co-variation of fluxes with meteorological variables and the temporal auto-correlation of the fluxes (Reichstein et al., 2005).
3.3 Soil flux measurement techniques, data acquisition and processing
Closed flux chamber measurements of CH4and N2O fluxes
were performed using a Photo Acoustic Field Gas-Monitor (type 1312, Innova AirTech Instruments, Ballerup, Den-mark) connected with tubes to closed, dark chambers
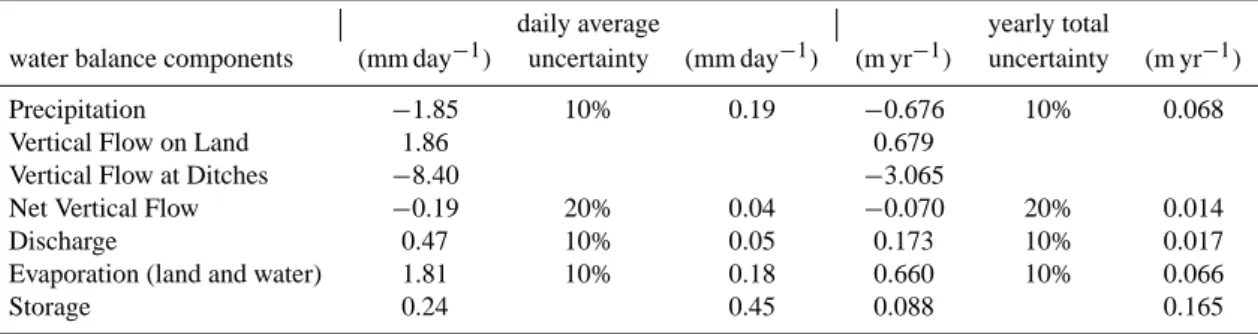
(non-Table 4. Water balance components total per year (right) and averaged per day (left).
daily average yearly total
water balance components (mm day−1) uncertainty (mm day−1) (m yr−1) uncertainty (m yr−1)
Precipitation −1.85 10% 0.19 −0.676 10% 0.068
Vertical Flow on Land 1.86 0.679
Vertical Flow at Ditches −8.40 −3.065
Net Vertical Flow −0.19 20% 0.04 −0.070 20% 0.014
Discharge 0.47 10% 0.05 0.173 10% 0.017
Evaporation (land and water) 1.81 10% 0.18 0.660 10% 0.066
Storage 0.24 0.45 0.088 0.165
transparent PVC, 45×45×12 or 30 cm). The Gas-Monitor detection limit and precision is dependent on the “least de-tected level” value of the optical filter used for a specific gas. Reliable measurements could be made from 1.0 ppm for CH4
and 300 ppb for N2O with a precision of 2 ppb and 0.6 ppb
respectively.
A fan was installed in the chambers to mix the air and in-crease the representativeness of the measurements. The soft-ware of the gas monitor compensates for cross-interference of CO2and water vapour. Additionally, to minimize any
pos-sible effect of the interference of those gases, the air was fil-tered before measurement with a Sodalime filter and a silica gel filter respectively (Van Huissteden et al., 2005). CO2and
water vapour concentrations remained constant during the flux measurement procedure when the filters were used. The Sodalime filter was replaced when the Gas-Monitor gas mon-itor indicated concentrations higher than 100 ppm CO2while
filtering the air for CO2. The silica gel (Riedel-de Haen,
Ger-many) contains moisture indicating pearls and was replaced at least after every ten measurements or when pearls indi-cated saturation. To prevent vegetation disturbance, cham-bers with a height of 30 cm were used. Vegetation was not removed preceding the flux measurements, to maintain the representativeness of the chamber measurements for a larger area. However, when measurements were performed over vegetation higher than 30 cm, it was cut to this size. Dur-ing each measurement soil temperature and local water table were determined.
On land, at eight fixed locations stainless steel frames with a water-filled gutter were used to seal the chamber from the ambient air during measurement. Six of the locations were positioned in the relatively dry part of the area evenly spread over the various vegetation types. At each of those six loca-tions, fluxes were measured 49 times between January 2004 and December 2006. The two other locations were in the part of the area with saturated soils and were measured 17 times each. On the ditch water surface, measurements were made at two locations. For this purpose a rectangular floater was used allowing the chamber to rest on the water. Between January 2006 and December 2006, fluxes were measured 17
times on the ditch at the east side and 14 times at the ditch at the west side of the research area. At all sites the flux measurements were performed approximately once every 4 weeks during winter and once every two weeks during sum-mer.
For each flux measurement five concentration measure-ments were performed at two-minute intervals. The series of concentration measurements made with the flux chamber technique were calculated into fluxes by determining linear regression lines from the concentration changes over time. Air pressure and temperature from the moment of measur-ing were taken into account in the calculations. Data were checked for outliers that may result from instrument error, chamber leakage or irregular ebullition events. Fluxes of N2O appeared to be negligible small with respect to the GHG
balance (between −0.1 and 0.1 mg m−2hr−1) and contained measurement errors of more than 70% on average. There-fore, the N2O flux measurements were not considered in
fur-ther analyses.
3.4 Vegetation and soil analyses
The vegetation was surveyed in 2005 and consisted of vegetation classification and air photo analysis. Biomass was determined in May and October 2005 by harvest-ing in 40×40 cm squares and seperatharvest-ing dead and livharvest-ing biomass. Soil analysis was performed on samples obtained by 0.12 dm3sample rings for undisturbed sampling. Perme-ability was determined with a permeameter using the falling head method. The C/N-ratios of these samples were deter-mined with a Flash 122, while the organic matter content was determined with thermogravimetry. Using an automatic oven (Leco TGA-601), samples were stepwise heated up to 1000◦C in an oxygen atmosphere, with heating plateaus at 105◦C and 500◦C.
- 2/3
- 2/3
L (Obhukov Length) = -11.399 z/umean = 4.3/2.48 = 1.74
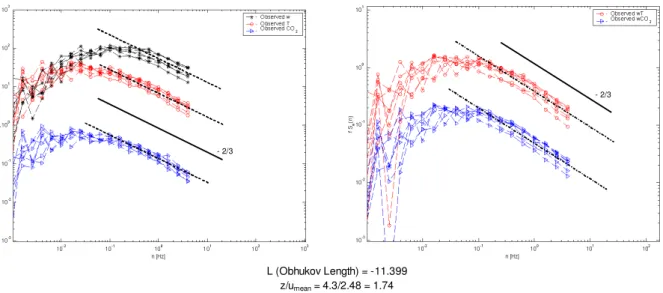
Fig. 2. Power-spectra of w, T and CO2-concentration (left) and co-spectra of w′T′and w′CO2′(right) for 10 Hz eddy covariance data of
seven half hours in spring 2005. Data are averaged per half hour.
-800 -600 -400 -200 0 200 400 600 100 102 104 106 108 110 112 114 time (julian days)
Rn e t , L E , H , G ( W m -2) -2 -1 0 1 2 3 4 5 C O2 f lu x ( g C m -2 h r -1) Rnet LE H G CO2 flux (NEE)
Fig. 3. Diurnal pattern of energy balance components net radiation,
latent heat, sensible heat and ground heat flux and CO2flux for
seven days in spring 2005.
4 Results
4.1 Water balance
Water entered the system either as precipitation or as seep-aging groundwater, mainly in the ditches. Losses consisted of evapotranspiration and runoff over a fixed weir as well as some infiltration of soil water to the Pleistocene sand aquifer underlying the clayey peat. Since the permeability of the peat layer was very low (0.023 m day−1), we assume that a signifi-cant part of the vertical flow in the soil water actually follows sub-horizontal flow paths. Using the precipitation data, wa-ter levels and evapotranspiration data (observed by the eddy covariance system) from 25 May 2005 to 25 May 2006, the storage of water per hectare in the soil of the Horstermeer
was calculated using the following water balance equation:
P − V F D − V F L − Q − ET = Storage (1)
where:
P = precipitation;
VFD = vertical flow in ditches;
VFL = vertical flow on land; Q = discharge; ET = evapotranspiration.
The annual precipitation was nearly equalled by the evap-otranspiration (Table 4), but was low compared to the av-erage annual rainfall of 775–800 mm in the area (source: KNMI, Royal Dutch Meteorological Institute). The runoff from the research site consisted only of discharge over the weir and was low. Seepage was the dominant vertical flow in the ditches, while on land infiltration of soil water pre-vails. Taking into account the relative surface area of land and ditches, the net vertical flow over the whole area was −0.070±0.014 m yr−1(seepage).
4.2 Performance of the eddy covariance set-up
Spectral analysis of the fluctuations of the vertical wind speed (w), air temperature (T ) and CO2in the atmosphere
associated with turbulent transport provide a useful tool for assessing the reliability of flux measurements (Stull, 1988; Kaimal and Finnigan, 1994). We determined power-spectra of the wind, temperature and CO2concentration as well as
co-spectra of temperature fluxes and CO2 fluxes (Fig. 2).
10 Hz eddy covariance data of seven 30 min periods in spring 2005 were used for this purpose. The power-spectra and co-spectra were binned and plotted as a function of frequency at log-log scale. Power-spectra for w, T and CO2have
y = 1.0876x - 21.216 R2 = 0.8573 -200 -100 0 100 200 300 400 500 600 700 800 -200 -100 0 100 200 300 400 500 600 700 800 Rnett (W/m2 ) L E + H + G ( W /m 1 : 1 line y = 0.996x - 19.784 R2 = 0.8186 -200 -100 0 100 200 300 400 500 600 700 800 -200 -100 0 100 200 300 400 500 600 700 Rnett (W/m2) L E + H + G ( W /m 1 : 1 line
Fig. 4. Energy balance closure for daytime periods over a three week period during the spring of 2005 with 1:1 line and linear relation. In the left plot a circle is drawn around the outlying mid-day data points. In the right plot mid-day measurements are removed.
is in agreement with the power law in the inertial sub-range (Eugster and Senn, 1995). Under ideal circumstances the shapes of the w′CO2′and w′T′co-spectra should be similar.
Here the co-spectra showed comparable shapes and have cor-responding slopes with a proportionality of −2/3. The power
spectrum of the CO2time series, the co-spectrum of vertical
wind and CO2as well as the co-spectrum of vertical wind
and air temperature indicated that the eddy covariance set-up recorded nearly all the fluctuations in CO2 associated with
turbulent transport (Goulden et al., 1996), and that the mea-surements were taken in a well established surface layer.
In the energy balance, the ground heat flux (G) in the clayey peat soil was relatively important compared to the la-tent and sensible heat fluxes (LE and H respectively) and amounted to over half of the energy in the net radiation (Rnet)
(Fig. 3). The closure of the energy balance was good (Fig. 4), but the values of the sum of LE, H and G were relatively high at sunny days around noon, resulting in a regression line with a slope of more than 1. These high values of the sum of LE, H and G at sunny hours around noon were mainly the result of extremely high apparent G. These high G val-ues were caused by erroneous measurements of the upper soil heat sensors due to overheating during periods with a lot of sunlight. When these data points with erroneous G val-ues were removed from the data set, the regression line had a slope of 0.996 and an R2 of 0.82. This implied that the quality of the data from the eddy covariance set-up was very good (Lloyd et al., 1997).
The uncertainty of NEE was based on the percentage of data gaps in the eddy covariance data after performing the quality check and u∗-correction. KNMI air temperature data
from De Bilt were used to support the gap filling method when necessary. The distance between the site and the KNMI observation is 20 km. Uncertainties resulting from the gap-filling procedure are directly proportional to the amount of gaps filled over the measurement period (Falge et al., 2001). We introduced the maximum error in NEE of 0.675 g C m−2 per percentage gap-filled per year. The total amount of data
gaps was 36.72% for 2004, 26.37% for 2005 and 29.70% for 2006, resulting in a maximum error of 25 g C m−2yr−1, 18 g C m−2yr−1 and 20 g C m−2yr−1respectively. Accord-ing to Van der Molen et al. (personal communication, 2007)1 the error introduced by the calculation routines was 13% of the total annual NEE.
4.3 Carbon dioxide fluxes
The net CO2 flux followed a daily pattern with periods
of net CO2 uptake during daytime and respiration during
night time (Fig. 3). In Fig. 5 the CO2 fluxes are shown
as daily fluxes in g C m−2day−1 as well as the cumulative CO2flux in g C m−2yr−1over the year. The growing
sea-son in 2004 (period where NEE is negative) lasted from 7 April to 14 October and had a NEE of −543 g C m−2. The NEE for 2004 was cumulated, resulting in an annual NEE of −446±83 g C m−2yr−1. The growing season in 2005 lasted from 25 March to 8 September and had a NEE - 327 g C m−2, while the annual NEE amounted −311±58 g C m−2yr−1. The growing season in 2006 lasted from 25 April to 2 September and had a NEE of −283 g C m−2, while the an-nual NEE amounted −232±58 g C m−2yr−1.
Net ecosystem exchange was determined directly from the eddy covariance CO2flux measurements and was considered
to be the sum of the gross ecosystem production (GEP) and Reco(the sum of heterotrophic and autotrophic respiration).
Recocould be expressed by its physical exponential relation
with soil temperature (Lloyd and Taylor, 1994; Van’t Hoff, 1898). For the Horstermeer site the exponential relation for Recowas determined empirically using nocturnal NEE values
(incoming shortwave radiation SWin<20 W m−2) assuming
photosynthesis was absent and the NEE consist only of Reco
(Fig. 6, Eq. 2).
1Van der Molen, M. K., Dolman, A. J., Marchesini, L. B., et al.:
The carbon balance of the Boreal Eurasia consolidated with eddy covariance observations, personal communiction, 2007.
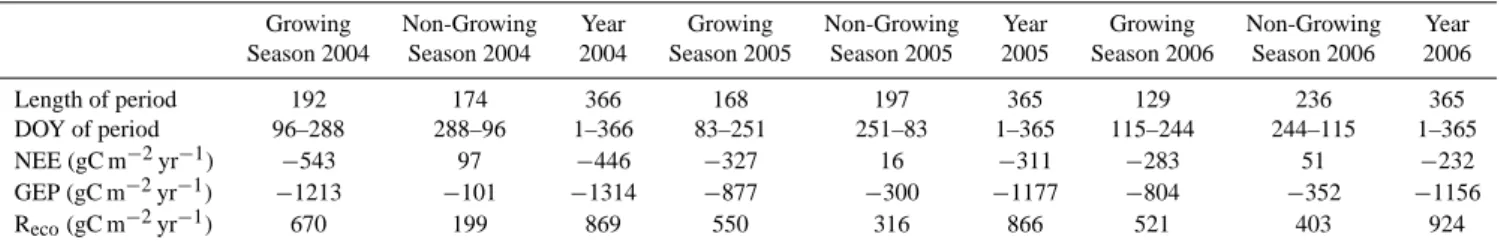
Table 5. NEE, GEP and Recofor growing seasons, non-growing seasons and whole years over 2004, 2005 and 2006.
Growing Non-Growing Year Growing Non-Growing Year Growing Non-Growing Year
Season 2004 Season 2004 2004 Season 2005 Season 2005 2005 Season 2006 Season 2006 2006
Length of period 192 174 366 168 197 365 129 236 365
DOY of period 96–288 288–96 1–366 83–251 251–83 1–365 115–244 244–115 1–365
NEE (gC m−2yr−1) −543 97 −446 −327 16 −311 −283 51 −232
GEP (gC m−2yr−1) −1213 −101 −1314 −877 −300 −1177 −804 −352 −1156
Reco(gC m−2yr−1) 670 199 869 550 316 866 521 403 924
Table 6. Regression analyses of relations between CH4fluxes, soil temperature and water level for relatively dry land, saturated land and
ditches. From left to right the correlation coefficients, amount of samples (n) goodness-of-fit of the correlation (R2), F -test with significance
(p-value) and variance error as well as the regression equation for CH4with soil temperature are shown.
correlation coefficients statistical parameters Regression equations ln(CH4)-Tsoil ln(CH4)-soil wll Tsoil-soil wll n R2 F -test p-value variance error
dry land 0.294 −0.132 −0.663 294 0.086 14.273 0.000 1.845 CH4=exp(−0.261+0.060*Tsoil) saturated land 0.493 −0.362 −0.671 34 0.243 3.210 0.103 0.292 CH4=exp(2.205+0.045*Tsoil) ditches 0.676 0.000 0.000 31 0.457 9.261 0.011 0.292 CH4=exp(0.767+0.079*Tsoil)
Reco=0.0077 × e(0.1415×T soil)
(error variance=0.77 and R2=0.5137) (2)
The results of the flux partitioning of NEE in Recoand GEP
are listed in Table 5 and plotted over the year (Fig. 5). Another attempt to partition the NEE fluxes of 2005 was made by using the model of Reichstein et al. (2005). This model uses air temperature to partition the data and resulted in a partitioning of −311 g C m−2yr−1 NEE in a GEP of −1135 g C m−2yr−1and Recoof 823 g C m−2yr−1. The
dif-ference between the results of the two methods for flux par-titioning was small. Since the first method (using noctur-nal NEE) uses soil temperature instead of air temperature we consider this as a more physically based method as soil tem-perature was more closely related to Reco.
4.4 Methane fluxes
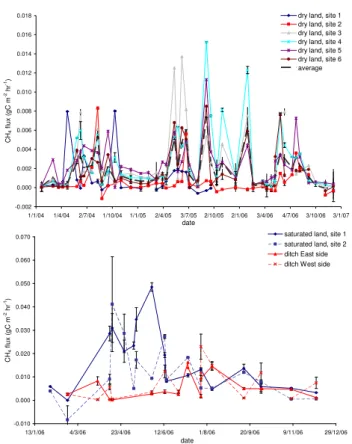
Significantly different fluxes were measured at the three land elements relatively dry land, saturated land and wa-ter surfaces and therefore they were considered sepa-rately in further analyses and data processing. Mea-sured CH4 fluxes observed at the relatively dry land
var-ied from −1.1 to 15.2 mg C m−2hr−1 with an average of 1.7±0.2 mg C m−2hr−1, while fluxes observed at saturated land varied from −8.4 to 48.5 mg C m−2hr−1with a average of 13.8±2.2 mg C m−2hr−1. CH4 fluxes from the ditches
varied from 0.4 to 18.4 mg C m−2hr−1 with an average of 6.8±0.9 mg C m−2hr−1(Fig. 7). The CH4fluxes of the
satu-rated land were significantly highest and fluxes from all
sur-face types showed a seasonal trend over the year with the highest fluxes in late spring, summer and early autumn.
In previous studies relations between soil temperature and CH4 flux and between soil water level and CH4 flux
were found (Aerts and Toet, 1997; Fiedler and Sommer, 2000; Smith et al., 2003). Statistical analysis of the data showed that in our case the temporal variation of the CH4
fluxes was significantly correlated with soil temperature, but barely correlated with water level (Table 6) while water level is significantly correlated with soil temperature. This phenomenon was encountered earlier by Wagner et al. (1999) in a marshland. We assume that the lack of correlation between CH4flux and soil water level is caused
by the soil characteristics at the Horstermeer research site. Peaty and clayey soils often contain anaerobic areas above the water level. In those zones in the soil methanogenesis occurs and CH4 fluxes at the surface can be higher than
expected. As a consequence of the low correlation with CH4fluxes, soil water levels were not taken into account in
the regression analyses of the CH4 fluxes. The following
exponential regression equations describe the CH4flux for
the three land elements:
Dry land:
CH4flux=e(−0.261+0.060×T soil)
(error variance=1.84 and R2=0.086) (3)
Saturated land:
CH4flux=e(2.205+0.045×T soil)
-20 -15 -10 -5 0 5 10 1
time (julian days)
C O2 f lu x e s ( g C m -2 d a y -1) -600 -500 -400 -300 -200 -100 0 100 c u m u la ti v e N E E ( g C m -2) Reco GPP NEE NEE cumulative 183 0 46 91 137 228 274 320 366 -20 -15 -10 -5 0 5 10 1
time (julian days)
C O2 f lu x e s ( g C m -2 d a y -1) -600 -500 -400 -300 -200 -100 0 100 c u m u la ti v e N E E ( g C m -2) Reco GEP NEE NEE cumulative 183 0 46 91 137 228 274 320 365 -20 -15 -10 -5 0 5 10 1
time (julian days)
C O2 f lu x e s ( g C m -2 d a y -1) -600 -500 -400 -300 -200 -100 0 100 c u m u la ti v e N E E ( g C m -2) Reco GEP NEE NEE cumulative 183 0 46 91 137 228 274 320 365 2004 2006 2005
Fig. 5. Daily NEE, GEP, Recoand cumulative NEE over the year for
2004 (upper graph), 2005 (middle graph) and 2006 (bottom graph).
Ditches:
CH4flux=e(0.767+0.079×T soil)
(error variance=0.29 and R2=0.457) (5)
Using these regression equations and continuous soil tem-perature data, the annual CH4 flux for the three land
ele-ments could be determined (Table 7 and Fig. 8). The CH4
fluxes of the dry land have a high variance error and were low compared to the fluxes from the ditches and the saturated
y = 0.0077e0.1415x with R2 = 0.5137 0.00 0.05 0.10 0.15 0.20 0.25 0 5 10 15 20 25
soil temperature at 2-5 cm depth (oC)
re s p ir a ti o n ( g C m -2 h a lf h r -1)
Fig. 6. Relation between soil temperature and respiration using
noc-turnal CO2fluxes with the exponential best fit line and its regression
equation. -0.002 0.000 0.002 0.004 0.006 0.008 0.010 0.012 0.014 0.016 0.018 1/1/04 1/4/04 2/7/04 1/10/04 1/1/05 2/4/05 3/7/05 2/10/05 2/1/06 3/4/06 4/7/06 3/10/06 3/1/07 date C H4 f lu x ( g C m -2 h r -1)
dry land, site 1 dry land, site 2 dry land, site 3 dry land, site 4 dry land, site 5 dry land, site 6 average -0.010 0.000 0.010 0.020 0.030 0.040 0.050 0.060 0.070 13/1/06 4/3/06 23/4/06 12/6/06 1/8/06 20/9/06 9/11/06 29/12/06 date C H4 f lu x ( g C m -2 h r -1)
saturated land, site 1 saturated land, site 2 ditch East side ditch West side
Fig. 7. Measured CH4fluxes at the Horstermeer site over the period
2004 to 2006 for the relatively dry land (above) and over 2006 for the saturated land and the ditches (below).
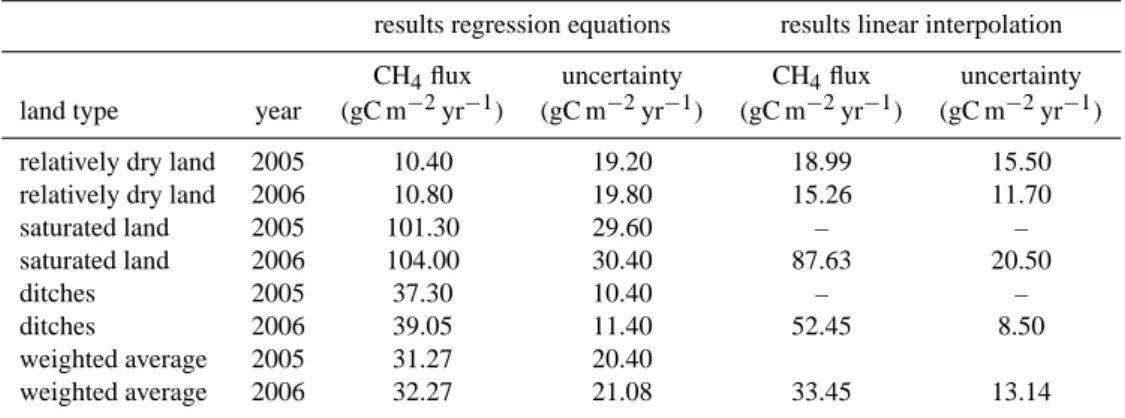
land. Since uncertainties of the regression equations were very large (Table 6), annual totals were also determined us-ing linear interpolation of the data points. Uncertainties were estimated by determination of the total variance between the annual totals of the different flux sites. The two methods did not differ significantly both in annual totals and uncertainties (Table 7).
Table 7. Annual totals of CH4emission from the relatively dry land, the saturated land and the ditches as well as the weighted average
determined by regression equations and by linear interpolation.
results regression equations results linear interpolation
CH4flux uncertainty CH4flux uncertainty
land type year (gC m−2yr−1) (gC m−2yr−1) (gC m−2yr−1) (gC m−2yr−1)
relatively dry land 2005 10.40 19.20 18.99 15.50
relatively dry land 2006 10.80 19.80 15.26 11.70
saturated land 2005 101.30 29.60 – – saturated land 2006 104.00 30.40 87.63 20.50 ditches 2005 37.30 10.40 – – ditches 2006 39.05 11.40 52.45 8.50 weighted average 2005 31.27 20.40 weighted average 2006 32.27 21.08 33.45 13.14 -0.1 0 0.1 0.2 0.3 0.4 0.5 0.6 0 50 100 150 200 250 300 350
time (julian days)
C H4 f lu x ( g C m -2 d a y -1) saturated land dry land ditches
Fig. 8. Modelled daily CH4fluxes for relatively dry land, saturated
land and ditches over 2005. Error-bars indicate the variance error from the regression analysis.
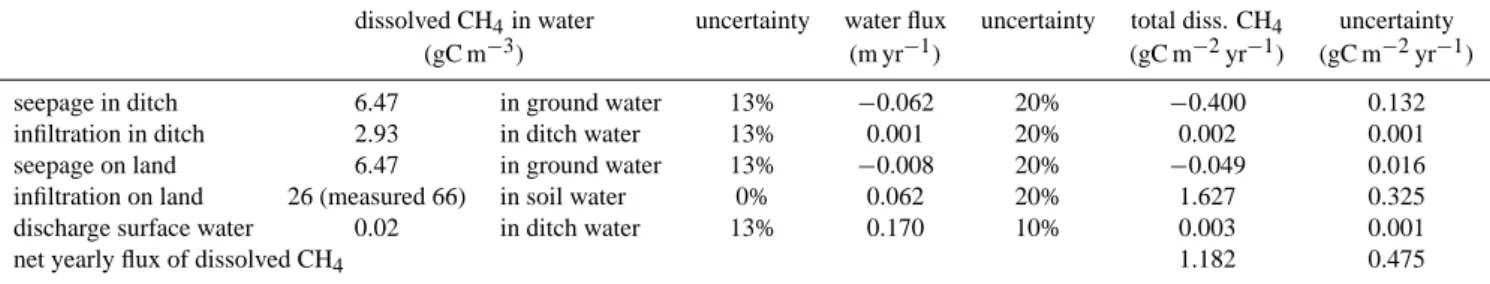
4.5 Fluxes of Total Carbon and dissolved CH4through
wa-ter
The analyses of soil water, ground water and ditch wa-ter for TC and dissolved CH4 show that highest
concentra-tions were found in the soil water, while the ground wa-ter and ditch wawa-ter contained relatively little TC and dis-solved CH4 (Tables 8 and 9). Theoretically, the maximum
concentration of dissolved CH4 in water under the
condi-tions of the soil in the Horstermeerpolder is 26 g C m−3 (10◦C; 2 m deep). Higher concentrations of CH
4 in the
soil water cause a gas pressure that is higher than the hy-drostatic pressure and therefore gas bubbles will form in the soil which move upward and will be emitted as gas flux at the soil surface (Obdam et al., 2001; Strack et al., 2006). In further calculations this maximum concentration of 26 g C m−3for soil water was used. The fluxes of TC and dissolved CH4 by water transport were calculated by
mul-tiplying the TC and dissolved CH4concentrations with the
corresponding water volumes from the water balance. Over the year a net amount of 16.069±4.754 g C m−2yr−1 was transported out of the research site as TC, while a net amount of 1.182±0.475 g C m−2yr−1was transported out of the re-search area as dissolved CH4. This transport mainly took
place by infiltration to the groundwater and discharge of sur-face water.
4.6 A full Greenhouse Gas balance
All incoming and outgoing carbon fluxes through air and wa-ter at the measurement site were available for 2005 and were determined per square meter peat meadow per year. As men-tioned before, the surface of the research area consists for 10% of ditches, for 20% of land that is saturated year-round and for 70% of land with a fluctuating water table and aerated top-layer. This ratio was taken into account while calculating the annual fluxes of CH4. Fluxes were considered in amounts
of carbon and also converted to their GWP.
The exchange of GHG’s through air has a direct effect on the GHG budget of the local atmosphere. The carbon fluxes with water as transport medium form sources and sinks as well, but when and where they will turn into gaseous state and affect the atmospheric GHG balance is unknown. Nev-ertheless the fluxes through water have an indirect effect on the carbon balance by transporting carbon from the system with the runoff and by transporting carbon into or out of the system via the underground, affecting the availability of car-bon in the system for exchange with atmosphere. In order to make this distinction between direct and indirect effects on the carbon balance, the direct net carbon flux with atmo-sphere was considered separately (Table 10), in addition to the total carbon balance where atmosphere and water were both taken into account.
From the total incoming carbon, −1177±905 g C m−2yr−1 (99.5% of all CO2-equiv.) entered the
Table 8. Results of the water analyses for Total Carbon (TC) in the water, water fluxes over the year and annual fluxes of TC transported by water.
TC in water uncertainty water flux uncertainty total TC uncertainty
(gC m−3) (m yr−1) (gC m−2yr−1) (gC m−2yr−1)
seepage in ditch 41.14 in ground water 6% −0.062 20% −2.546 0.662
infiltration in ditch 53.50 in ditch water 6% 0.001 20% 0.031 0.008
seepage on land 41.14 in ground water 6% −0.008 20% −0.314 0.082
infiltration on land 157.90 in soil water 6% 0.062 20% 9.786 2.544
discharge surface water 53.50 in ditch water 6% 0.170 10% 9.111 1.458
net yearly flux of TC in water 16.069 4.754
Table 9. Results of the water analyses for dissolved CH4in the water, water fluxes over the year and total fluxes of dissolved CH4transported
by water.
dissolved CH4in water uncertainty water flux uncertainty total diss. CH4 uncertainty
(gC m−3) (m yr−1) (gC m−2yr−1) (gC m−2yr−1)
seepage in ditch 6.47 in ground water 13% −0.062 20% −0.400 0.132
infiltration in ditch 2.93 in ditch water 13% 0.001 20% 0.002 0.001
seepage on land 6.47 in ground water 13% −0.008 20% −0.049 0.016
infiltration on land 26 (measured 66) in soil water 0% 0.062 20% 1.627 0.325
discharge surface water 0.02 in ditch water 13% 0.170 10% 0.003 0.001
net yearly flux of dissolved CH4 1.182 0.475
−3.31±0.80 g C m−2yr−1 (0.5% of all CO2-equivalents)
entered the system with groundwater seepage. From the total emitted carbon 866±666 g C m−2yr−1 (74.4% of all CO2-equiv.) left the system through Reco,
31.27±20.43 g C m−2yr−1 (23.2% of all CO2-equiv.)
through emission of CH4 gas, 11.45±2.90 g C m−2yr−1
(2.0% of all CO2-equivalents) through infiltration of soil- and
ditchwater to deeper aquifers and 9.11±1.40 g C m−2yr−1 (0.8% of all CO2-equiv.) through discharging ditch water.
When concerning only fluxes with the atmosphere the area was a considerable carbon sink of −280±78 g C m−2yr−1, while it was a smaller GHG sink given as CO2-equiv. of
−182 g m−2yr−1 (based on a 100-year time scale) due to the greater GWP of CH4. When fluxes through water
were added to the balance, the area was a carbon sink of −262±84 g C m−2yr−1, and only a small net GHG sink given as CO2-equiv. of −86 g m−2yr−1when considered as
GWP (Table 10).
5 Discussion and conclusions
These results show that, with considerable experimental ef-fort, it is possible to estimate a full GHG balance and its uncertainties for a specific area by measuring fluxes of CO2,
CH4and N2O simultaneously, while also paying attention to
fluxes of TC and dissolved methane trough water and taking into account the different GWP’s.
The eddy covariance system performed well, as shown by the power-spectra and co-spectra as well as by the closure of the energy balance, and we can put confidence in those results. NEE was satisfactory partitioned in Recoand GEP
using soil temperature and night time fluxes for 2004, 2005 and 2006 (Table 5 and Fig. 5). NEE of CO2at the
Horster-meer site was high compared to the average NEE of Euro-pean peat areas which ranges from −33 g C m−2yr−1 (up-take) for undisturbed peat lands to 188 g C m−2yr−1 (emis-sion) for drained peat lands (Janssens et al., 2005). The high CO2-uptake at the site is the result of a combination of the
temperate climate, the high water tables and the lack of man-agement. All plant material formed during the long growing seasons (approximately 200 days) can grow to its full size, resulting in a high GEP and remains in situ after dying. The large amounts of respiring plants resulted in high Recoduring
the summer period, while the anaerobic conditions caused by the high water table are unfavourable for oxidation of organic soils and dead plant material.
CH4emissions of the area are the net result of
methano-genesis in the anaerobic parts of the soil and CH4oxidation
in the aerated parts of the soil. A significant difference be-tween CH4 emissions from relatively dry soils, from
satu-rated soils and from water surfaces was observed (Table 7 and Fig. 7). Especially the CH4 fluxes from the ditch
wa-ter and from the saturated soil bordering the ditches were high. Here, anaerobic processes, including methanogenesis,
Table 10. Summary of all carbon fluxes in the research area over 2005. Fluxes are presented in g C, CO2-equivalents and percentage of
CO2-equivalents.
CO2and CH4fluxes GWP as CO2-equivalents
(g C m−2yr−1) uncertainty (g C m−2yr−1) (g m−2yr−1) (percentage)
1 GEP (CO2) −1177 905 −4316 99.5%
2 dissolved CH4in seepage −0.45 0.10 −14 0.3%
3 TC in seepage −2.86 0.70 −10 0.2%
TOTAL INCOMING CARBON −1180 906 −4340 100.0%
4 Reco(CO2) 866 666 3175 76.9%
5 CH4emission from land 7.28 13.43 223 5.4%
6 CH4emission from saturated land 20.26 5.91 621 15.0%
7 CH4emission from water 3.73 1.09 114 2.8%
Total emitted CH4 31.27 20.44 959 23.2%
8 dissolved CH4in infiltration 1.63 0.30 50 1.2%
9 TC in infiltration 9.82 2.60 36 0.9%
10 dissolved CH4in discharge 0.00 0.00 0 0.4%
11 TC in discharge 9.11 1.40 33 0.8%
Total TC and dissolved CH4in water 20.56 4.30 135 3.3%
TOTAL OUTGOING CARBON 918 691 4130 100.0%
NET CARBON FLUX with ATMOSPHERE −280 78 −182
NET CARBON FLUX with ATMOSPHERE and WATER −262 86 −86
NEE (CO2)=GPP(1)−Reco(2) −311 58 −1140
prevail over aerobe processes as result of the water satu-rated conditions. These observations suggest even higher CH4 emissions in the case of a further rise of the
wa-ter table. Total weighted fluxes result in a relatively high net CH4 emission (31.27±20.40 g C m−2yr−1for 2005 and
32.27±21.08 g C m−2yr−1for 2006), even compared to the high average fluxes of 11.4 g C m−2yr−1 from peat lands in Germany and the Netherlands mentioned by Dr¨osler et al. (2007). The Horstermeer site has relatively high soil wa-ter levels, and relatively eutrophic soil conditions. In similar conditions elsewhere also high CH4 fluxes have been
mea-sured (Fiedler and Sommer, 2000). Additionally, in this re-search the CH4 fluxes from water surfaces, which increase
the average flux from the area, were taken into account. In other research this is often neglected. The emission of CH4
in the Horstermeer polder accounted for 23.2% of the emitted CO2-equivalents from the peat meadow site. The uncertainty
of the up scaling of CH4based only on soil temperature and
water level was, however, high. Further research needs to be performed to improve the understanding of methane fluxes.
The history of the Horstermeer site – a recently re-wetted highly productive peat meadow, with nutrients from fertil-ization still present in the soil – may have influenced the present high CH4emission. Nutrient addition may enhance
CH4emission in peat soils (Aerts and Toet, 1997). The more
nutrient-poor peat meadow sites of Van den Pol-Van Dasse-laar et al. (1999, 1998a, b), with otherwise comparable soils and water table also exhibit lower fluxes than the Horster-meer site. Fiedler and Sommer (2000) report fluxes of similar magnitude as those from the Horstermeer site, from peaty
de-pressions with strong agricultural influence in southern Ger-many. At the site, the ditches and their margins produce the highest fluxes, contributing significantly to the GHG bud-get. The high methane fluxes from ditches also have been reported from other temperate wetland sites. In particular a nutrient-rich pond margin site produced high CH4 fluxes
of up to 77.5 g C m−2yr−1 (Van den Pol-Van Dasselaar et al., 1999; Sundh et al., 2000), being a similar hotspot as the ditch margins at the site. Our results therefore also hint to-wards management options to reduce CH4emissions during
wetland restoration.
From the undetectable N2O fluxes, we can draw two
con-clusions. First, such small fluxes could not be measured properly with the Innova 1312 Gas-Monitor. Second, the N2O fluxes make a negligible contribution to the GHG
bal-ance at the site. The formation of N2O is normally enhanced
by an increase in available mineral nitrogen. Since the site has not been fertilised for more then 10 years, the enhancing effect of fertilisation has probably been diminished and the N2O emission is reduced to insignificant proportions.
Water, as transport medium of TC and dissolved CH4,
played only a minor role in the balance of GHG’s in the area. Only 17.25 g C m−2yr−1of the total CO2-equivalents
were exchanged by transport of water. Although concen-trations of TC and dissolved CH4 in the soil water were
high, the impermeable soil prohibits the water to infiltrate quickly. The groundwater, on the other hand, contains rel-atively small amounts of TC and dissolved CH4.
Ditchwa-ter and soil waDitchwa-ter were therefore barely fed with TC and CH4through seepaging water. Discharge in this controlled
area was low compared to other, for example mountainous and uncontrolled areas, where the run off component forms a more important role of washing down of carbon from the system (Hope et al., 2004; Worrall et al., 2005; Ding et al., 2005).
Although the Horstermeer site apparently was a large sink for CO2 (−311 g C m−2yr−1) and was a considerable
car-bon sink of −262 g C m−2yr−1when CH4fluxes and
trans-port by water are considered, the area was only a small net GHG sink given as CO2-equiv. of −86 g m−2yr−1 when
considered as GWP. Similar results were found by Friborg et al. (2003) and by Whiting and Chanton (2001). These re-sults show that wetland restoration, for the purpose of restor-ing wetland habitats and biodiversity, may increase methane emission, but that restored wetlands can become a net sink of GHG’s. Additionally, our observations suggest higher CH4
emissions in the case of a further rise of the water table. Hith-erto, the effects of wetland restoration on methane emissions have been poorly quantified, but also other studies indicate an increase of methane emission (Tuittila et al., 2000; Van den Bos et al., 2003).
However, the effect of enhanced methane emission result-ing from wetland restoration should be compared with the previous emission of drainage and agricultural use of the soil, with generally lower CO2-uptake, and extra CO2 emission
from peat decomposition (Van den Bos et al., 2003). Un-fortunately we do not have quantitative data from the GHG emissions at the site before the water level was raised. At two similar but drained peat land sites nearby an annual NEE of 157 g C m−2yr−1(emission) and an annual NEE of −62.4 g C m−2yr1 (uptake) over 2005 was observed (Vee-nendaal et al., personal communication, 20072). We have also modelled the CO2 and CH4 emission at the site for a
20 cm lower water table than the present water table (approx-imately the water table position before re-wetting) using the PEATLAND model (Van Huissteden et al., 2006), after cal-ibrating the model for the site using our measurement data of the drier sites. This resulted in an increase of the CO2
emission from peat degradation of 330 g C m−2yr−1, which is 2.36 times the peat decomposition for the present situation. The CH4emission from the land surface was reduced by 60%
in the model results. The net GHG emission may have been 180% higher at a 20 cm lower water table, mainly by higher soil organic matter decomposition. In this result the effect of carbon export by harvest under agricultural land use in the past, and carbon uptake by vegetation in the present situa-tion is not included. This suggests that although the area is presently only a small GHG sink, it may have been a consid-erably larger net source before rewetting. It should be noted also that the effects of higher N2O emission at agricultural
2Veenendaal, E., Kolle, O. Leffelaar, P., et al.: Land use
depen-dent CO2exchange and Carbon balance in two grassland sites on
eutrophic drained peat soils, personal communication, 2007.
land use (Langeveld et al., 1997; Schils et al., 2006) were not considered here.
Acknowledgements. This research project is performed in the
framework of the European research programme Carbo Europe (contract number GOCE-CT2003-505572) and the Dutch Na-tional Research Programme Climate Changes Spatial Planning (http://www.klimaatvooruimte.nl).
Edited by: J. Kesselmeier
References
Aerts, R. and Toet, S.: Nutritional controls on carbon dioxide and methane emission from Carex-dominated peat soils, Soil Biol. Biochem., 29, 1683–1690, 1997.
Alm, J., Schulman, L., Walden, J.. et al.: Carbon balance of a boreal bog during a year with an exceptionally dry summer, Ecology, 80(1), 161–174, 1999.
Aubinet, M., Grelle, A. Ibrom, A., et al.: Estimates of the annual net carbon and water exchange of forests: The EUROFLUX method-ology, Adv. Ecol. Res., 30, 113–175, 2000.
Burgerhart, N.: Mogelijkheden voor koolstofopslag in
Neder-landse ecosystemen, Wageningen, Leerstoelgroep Natuurbeheer en Plantenecologie, Wageningen University, 2001.
Ding, W. X., Cai, Z. C., Tsuruta, H., et al.: Factors affecting
sea-sonal variation of CH4concentration in water in a freshwater
marsh vegetated with Carex lasiocarpa, Biol. Fert. Soils, 41(1), 1–8, 2005.
Dr¨osler, M., Freibauer, A., Christensen, T. R., et al.: Observations and status of peatland greenhouse gas emissions in Europe, in: Observing the continental scale greenhouse gas balance, Chapter 8., edited by: Dolman, A. J., Valentini, R., and Freibauer, A., to be published in Springer Ecological series, , 2007.
Eugster, W. and Senn, W.: A Cospectral Correction Model for
Mea-surement of Turbulent N2O Flux, Bound.-Lay. Meteorol., 74(4),
321–340, 1995.
Falge, E., Baldocchi, D., Olson, R., et al.: Gap filling strategies for long term energy flux data sets, Agr. Forest Meteorol., 107(1), 71–77, 2001.
Fiedler, S. and Sommer, M.: Methane emissions, groundwater lev-els and redox potentials of common wetland soils in a temperate-humid climate, Global Biogeochem. Cy., 14, 1081–1093, 2000. Friborg, T., Soegaard, H., Christensen, T. R., et al.: Siberian
wet-lands: Where a sink is a source, Geophys. Res. Lett. 30(21), 2129, doi:10.1029/2003GL017797, 2003.
Gash, J. H. C. and Dolman, A. J.: Sonic anemometer (co)sine re-sponse and flux measurement I. The potential for (co)sine error to affect sonic anemometer-based flux measurements, Agr. For-est Meteorol., 119(3–4), 195–207, 2003.
Goulden, M. L., Munger, J. W., Fan, S. M., et al.: Measurements of carbon sequestration by long-term eddy covariance: Methods and a critical evaluation of accuracy, Glob. Change Biol., 2(3), 169–182, 1996.
Hope, D., Palmer, S. M., Billett, M. F., et al.: Variations in
dis-solved CO2and CH4in a first-order stream and catchment: an
investigation of soil-stream linkages, Hydrol. Processes, 18(17), 3255–3275, 2004.
IPCC: IPCC Third Assessment Report, Climate Change 2001, Cambridge Univ. Press, Cambridge, UK, 2001.
Janssens, I. A., Freibauer, A., Schlamadinger, B., et al.: The carbon budget of terrestrial ecosystems at country-scale – a European case study, Biogeosciences, 2, 15–26 2005.
Kaimal, J. C. and Finnigan J. J.: Atmospheric boundary layer flows, their structure and management, New York, Oxford University Press, 1994.
Langeveld, C. A., Segers, R., Dirks, B. O. M., et al.: Emissions
of CO2, CH4and N2O from pasture on drained peat soils in the
Netherlands, Eur. J. Agron., 7(1–3), 35–42, 1997.
Lloyd, C. R., Bessemoulin, P., Cropley, F. D., et al.: A compari-son of surface fluxes at the HAPEX-Sahel fallow bush sites, J. Hydrol., 189(1–4), 400–425, 1997.
Lloyd, J. and Taylor, J. A.: On the Temperature-Dependence of Soil Respiration, Funct. Ecol., 8(3), 315–323, 1994.
Nakai, T., Van der Molen, M. K., Gash, J. H. C., et al.: Correction of sonic anemometer angle of attack errors, Agr. Forest Meteorol., 136(1–2), 19–30, 2006.
Obdam, A. and Cleveringa, P.: Gas in de ondiepe ondergrond, Stro-mingen 7, deel 2, 35–46, 2001.
Regina, K., Syvasalo, E., Hannukkala, A., et al.: Fluxes of N2O
from farmed peat soils in Finland, Eur. J. Soil Sci., 55(3), 591– 599, 2004.
Reichstein, M. Falge, E., Baldocchi, D., et al.: On the separation of net ecosystem exchange into assimilation and ecosystem respira-tion: review and improved algorithm, Glob. Change Biol., 11(9), 1424–1439, 2005.
Roulet, N. T., Lafleur, P. M., Richard, P. J. H., et al.: Contempo-rary carbon balance and late Holocene carbon accumulation in a northern peatland, Glob. Change Biol., 13(2), 397–411, 2007. Schils, R. L. M, Verhagen, A., Aarts, H. F. M., et al.: Effect of
im-proved nitrogen management on greenhouse gas emissions from intensive dairy systems in the Netherlands, Glob. Change Biol., 12, 382–391, 2006.
Soussana, J. F.: Towards a full accounting of the greenhouse gas balance of European grasslands, in: Observing the continental scale greenhouse gas balance, Chapter 9, edited by: Dolman, A. J., Valentini, R., and Freibauer, A., to be published in Sprinter Ecological series, 2007.
Smith, K. A., Ball, T., Conen, F., et al.: Exchange of greenhouse gases between soil and atmosphere: interactions of soil physical factors and biological processes, Eur. J. Soil Sci., 54-4, 779–791, 2003.
Strack, M., Waller, M. F., Waddington, J. M., et al.: Sedge
suc-cession and peatland CH4 dynamics: A potential feedback to
climate change, Ecosystems, 9(2), 278–287, 2006.
Stull, R. B.: An Introduction to boundary layer meteorology, Dor-drecht, Kluwer Academic Publishers, Atmospheric Sciences Li-brary, Chapter 8, 1988.
Sundh, I., Nilsson, M., Mikkel¨a, C., et al.: Fluxes of Methane and Carbon Dioxide on peat-mining Areas in Sweden, Ambio, 29, 499–503, 2000.
Treat, C. C., Bubier, J. L., Varner, R. K., et al. Timescale
depen-dence of environmental and plant-mediated controls on CH4flux
in a temperate fen, J. Geophys. Res.-Bio., 112(G1), G01014, doi:10.1029/2006JG000210, 2007.
Tuittila, E. S., Komulainen, V. M., Vasander, H., et al.: Methane dynamics of a restored cut-away peatland, Glob. Change Biol., 6, 569–581, 2000.
Van de Griend, A. A.: Inleiding tot de hydrodynamica en hy-draulica, Amsterdam, Instituut voor Aardwetenschappen Vrije Universiteit, Hoofdstuk 6, 1989.
Van den Bos, R., Van Huissteden, J., and Van de Plassche, O.: A
model-based assessment of CO2and CH4fluxes in coastal
peat-lands (Western Netherpeat-lands) for different climate and manage-ment scenarios, in: Human influences on carbon fluxes in coastal peatlands; process analysis, quantification and prediction, edited by: van den Bos, R. M., Thesis, Vrije Universiteit, p. 91–110, 2003.
Van den Pol-Van Dasselaar, A., van Beusichem, M. L., Oenema, O.,
et al.: CH4emissions from wet grasslands on peat soil in a nature
preserve, Biogeochemistry, 44(2), 205–220, 1999.
Van den Pol-van Dasselaar, A., van Beusichem, M. L., Oenema, O., et al.: Effects of soil moisture content and temperature on
CH4uptake by grasslands on sandy soils, Plant and Soil, 204(2),
213–222, 1998a.
Van den Pol-van Dasselaar, A., Corre, W. J., Prieme, A., et al.:
Spa-tial variability of CH4, N2O, and CO2emissions from drained
grasslands, Soil Sci. Soc. Am. J., 62(3), 810–817, 1998b. Van der Molen, M. K., Gash, J. H. C., Elbers, J. A., et al.: Sonic
anemometer (co)sine response and flux measurement – II. The effect of introducing an angle of attack dependent calibration, Agr. Forest Meteorol., 122(1–2), 95–109, 2004.
Van der Molen, M. K., Zeeman, M. J., Lebis, J., et al.: EClog: A handheld eddy covariance logging system, Comput. Electron. Agr., 51(1–2), 110–114, 2006.
Van Huissteden, J., Maximov, T. C., and Dolman, A. J.: High methane fluxes from an arctic floodplain (Indigirka lowlands, eastern Siberia), J. Geophys. Res., 110, G02002, doi:10.1029/2005JG000010, 1–8, 2005.
Van Huissteden, J., Van den Bos, M., Marticorena Alvarez, I.:
Mod-elling the effect of water-table management on CO2 and CH4
fluxes from peat soils, Neth. J. Geosci., 85, 3–18, 2006. Van’t Hoff, J. H.: Lectures on Theoretical and Physical Chemistry,
Part I. Chemical Dynamics (translated by Lehfeldt, R. A.), Ed-ward Arnold, London, pp. 224-229, 1898.
Wagner, D., Pfeiffer, E. M., and Bock, E.: Methane production in aerated marshland and model soils: effects of micro flora and soil texture, Soil Biol. Biochem., 31(7), 999–1006, 1999.
Whiting, G. J. and Chanton. J. P.: Greenhouse carbon balance of
wetlands: CH4emission versus carbon sequestration, Tellus Ser.
B, 53(5), 521–528, 2001.
Worrall, F., Burt, T., Adamson, J., et al.: Fluxes of dissolved CO2
and inorganic carbon from an upland peat catchment: impli-cations for soil respiration, Biogeochemistry, 73(3), 515–539, 2005.