HAL Id: hal-00297830
https://hal.archives-ouvertes.fr/hal-00297830
Submitted on 16 Dec 2005HAL is a multi-disciplinary open access
archive for the deposit and dissemination of sci-entific research documents, whether they are pub-lished or not. The documents may come from teaching and research institutions in France or abroad, or from public or private research centers.
L’archive ouverte pluridisciplinaire HAL, est destinée au dépôt et à la diffusion de documents scientifiques de niveau recherche, publiés ou non, émanant des établissements d’enseignement et de recherche français ou étrangers, des laboratoires publics ou privés.
Atmospheric concentrations of carbon dioxide and its
isotopic composition in southern Poland: comparison of
high-altitude mountain site and a near-by urban
environment
L. Chmura, K. Rozanski, J. M. Necki, M. Zimnoch, T. Kuc, A. Korus
To cite this version:
L. Chmura, K. Rozanski, J. M. Necki, M. Zimnoch, T. Kuc, et al.. Atmospheric concentrations of carbon dioxide and its isotopic composition in southern Poland: comparison of high-altitude mountain site and a near-by urban environment. Biogeosciences Discussions, European Geosciences Union, 2005, 2 (6), pp.1849-1865. �hal-00297830�
BGD
2, 1849–1865, 2005 Carbon dioxide in southern Poland L. Chmura et al. Title Page Abstract Introduction Conclusions References Tables Figures J I J I Back Close Full Screen / EscPrint Version Interactive Discussion EGU Biogeosciences Discussions, 2, 1849–1865, 2005 www.biogeosciences.net/bgd/2/1849/ SRef-ID: 1810-6285/bgd/2005-2-1849 European Geosciences Union
Biogeosciences Discussions
Biogeosciences Discussions is the access reviewed discussion forum of Biogeosciences
Atmospheric concentrations of carbon
dioxide and its isotopic composition in
southern Poland: comparison of
high-altitude mountain site and a near-by
urban environment
L. Chmura, K. Rozanski, J. M. Necki, M. Zimnoch, T. Kuc, and A. Korus
AGH University of Science and Technology, Krakow, Poland
Received: 30 September 2005 – Accepted: 28 October 2005 – Published: 16 December 2005 Correspondence to: J. M. Necki ([email protected])
BGD
2, 1849–1865, 2005 Carbon dioxide in southern Poland L. Chmura et al. Title Page Abstract Introduction Conclusions References Tables Figures J I J I Back Close Full Screen / EscPrint Version Interactive Discussion
EGU
Abstract
The results of regular observations of atmospheric CO2 mixing ratios and its carbon isotope composition (δ13C,∆14C), carried out at two continental sites located in central Europe are presented and discussed. The sites (Kasprowy Wierch, 49◦140N, 19◦590E, 1989 m a.s.l.; Krakow, 50◦040N, 19◦550E, 220 m a.s.l.), are located in two contrast-5
ing environments: (i) high-altitude mountaneous area, relatively free of anthropogenic influences, and (ii) typical urban environment with numerous local sources of carbon dioxide. Despite of relative proximity of those sites (ca. 100 km), substantial differences in both the recorded CO2levels and their isotopic composition were detected. The CO2 mixing ratios measured in the urban atmosphere revealed quasi-permanent excess 10
concentration of this gas when compared with near-by background atmosphere. The annual mean CO2 concentration recorded in Krakow in 2004 was almost 10% higher than that recorded at high-altitude mountain site (Kasprowy Wierch). Such effect is oc-curing probably in all urban centers. Carbon isotopic composition of atmospheric CO2 proved to be efficient tool for identification the surface CO2fluxes into the atmosphere 15
related to fossil fuel burning and their influence on the recorded levels of this gas in the local atmosphere. The available records of∆14C for Krakow and Kasprowy Wierch suggest gradual reduction of14C-free CO2fluxes into the urban atmosphere of Krakow in the past several years.
1. Introduction
20
Abrupt increase of atmospheric CO2concentration over the last 100 years, by far ex-ceeding the natural variations, has been unequivocally attributed to human activities (Keeling, 1993; GLOBALVIEW, 2004). The anthropogenic impact on the global carbon cycle is mainly related to fossil fuel and biomass burning, land-use changes, as well as various industrial activities (Marland et al., 2002). Although the level of atmospheric 25
BGD
2, 1849–1865, 2005 Carbon dioxide in southern Poland L. Chmura et al. Title Page Abstract Introduction Conclusions References Tables Figures J I J I Back Close Full Screen / EscPrint Version Interactive Discussion
EGU
magnitude of the CO2 fluxes entering and leaving the atmospheric carbon reservoir. These short-term changes have both anthropogenic and natural origin (Cias et al., 1995; Keeling et al., 1995). Identification and quantification of sources and sinks of carbon and their temporal and spatial variability on both global and regional scales, is a prerequisite for a better understanding of the dynamics of carbon cycle and its 5
response to ever increasing human impact (IPCC, 2001).
Development of reliable carbon cycle models requires adequate observational data. Up to now they are delivered mostly by the existing global and regional monitoring networks (GLOBALVIEW, 2004). Apart from the mixing ratios, also the isotopic com-position of carbon dioxide is measured in number of locations. Isotope characteristics 10
of carbon dioxide constitute a powerful tool for identification of sources and sinks of carbon and partitioning of carbon derived from burning of fossil fuels (Levin and Hes-shaimer, 2000; D ´emeny and Haszpra, 2002; Kuc et al., 2003).
The transition to market economy in east European countries is associated with major changes of industrial technologies and resulting shifts in the structure of total 15
energy consumption (gradual shift from coal to oil and natural gas). These changes have significant impact on strength and distribution of major sources of greenhouse gas emissions, in particular CO2, into the atmosphere in this part of Europe. Large urban and industrial centres are exposed to these emissions and the extent of their changes over the past years need to be quantified.
20
This work presents data gathered in southern Poland, mostly during the time pe-riod 2000–2004. They illustrate the variability of atmospheric carbon dioxide, both with respect to its mixing ratios and isotopic composition, recorded at two ground-level con-tinental sites located in contrasting environments: (i) high-altitude mountaneous area, relatively free of anthropogenic influences, and (ii) typical urban environment with nu-25
merous local sources of carbon dioxide. The distance between both sites is approxi-mately 100 km.
BGD
2, 1849–1865, 2005 Carbon dioxide in southern Poland L. Chmura et al. Title Page Abstract Introduction Conclusions References Tables Figures J I J I Back Close Full Screen / EscPrint Version Interactive Discussion
EGU
2. Site description
2.1. Kasprowy Wierch
The Kasprowy Wierch station is located in the south of Poland, within the High Tatra Mountains (Fig. 1a). The meteorological observatory which houses the monitoring station is located at the top of a mountain peak called Kasprowy Wierch (49◦140N, 5
19◦590E, 1989 m a.s.l., 300 m above the tree line). Kasprowy Wierch is situated at the intersection of three main valleys, at the border between Poland and Slovak Republic. The nearest town, Zakopane, is located approximately 900 m below, 6 km north of Kasprowy Wierch. This is a small tourist town. During winter holiday period (January, February), relatively large amounts of wood and fossil fuels are combusted in the valley. 10
The Kasprowy Wierch observatory is equipped with electrical heating system and does not use any fossil fuel. During wintertime, diesel-operated snow cars are used in the near-by valleys to maintain proper conditions for skiing.
The climate of Kasprowy Wierch area is typical for a continental mountain location, with relatively large diurnal and seasonal variations of temperature, high precipitation 15
rate, frequent changes of atmospheric pressure and strong winds. The winds are blowing predominantly along the N-S axis, with the average speed of around 7 m s−1. Winter season lasts typically for 8 months and ends up rapidly due to strong fohn circulation.
Regular observations of atmospheric CO2 concentrations started at Kasprowy 20
Wierch in 1994, as a joint project of the AGH University of Science and Technology, Krakow, Poland, and the University of Heidelberg, Germany. Continuous measure-ments using GC technique were initiated in 1996. The intake of outside air is located ca. 1 m above the roof of the observatory and ca. 6 m above the local ground. The data gathered at Kasprowy Wierch station till 2000 have been summarized by Necki et 25
al. (2003).
Since Kasprowy Wierch is situated within the transition zone between free tropo-sphere and the planetary boundary layer and is relatively free of local influences, this
BGD
2, 1849–1865, 2005 Carbon dioxide in southern Poland L. Chmura et al. Title Page Abstract Introduction Conclusions References Tables Figures J I J I Back Close Full Screen / EscPrint Version Interactive Discussion
EGU
site can be considered as a regional reference station for trace gas measurements in the lower atmosphere.
2.2. Krakow
Krakow (50◦040N, 19◦550E, 220 m a.s.l.), the second largest city of Poland, is located approximately 100 km north of Kasprowy Wierch. With more than 800 thousands in-5
habitants, rapidly growing car traffic and significant industrial activities, it represents a typical urban environment. Moreover, with the prevailing westerly circulation, the Krakow region is under substantial influence of a large coal mining and industrial cen-tre (Upper Silesia) located approximately 60 km west of the city. Characteristic fea-tures of the local climate are generally weak winds (annual average around 2.7 m/s) 10
and frequent inversions, extending sometimes over several days (particularly during winter time). These factors favour accumulation of surface gaseous emissions within the lower atmosphere above the city. The sampling site was situated on the University campus (Fig. 1b) located in the western part of the city, bordering recreation and sports grounds. The air intake was located on the roof of the Faculty building, approximately 15
20 m above the ground level.
3. Analytical methods
The GC technique was employed at both sites to measure the mixing ratios of atmo-spheric CO2. Automated gas chromatograph (Hewlett Packard, Series 5890 with FID detector and Ni catalyst for conversion of CO2 to CH4 and Porapak Q column) was 20
used. Reference working standard was injected after each sample. Four determina-tions of CO2 mixing ratios per hour were performed in automatic mode of operation. The air was cryogenically dried at −70◦C prior to analysis. Typical reproducibility of the mixing ratio measurements was around ±0.1 ppm. All CO2 data are reported in WMO CO2 mole fraction scale maintained via secondary standard gases periodically 25
BGD
2, 1849–1865, 2005 Carbon dioxide in southern Poland L. Chmura et al. Title Page Abstract Introduction Conclusions References Tables Figures J I J I Back Close Full Screen / EscPrint Version Interactive Discussion
EGU
calibrated against primary reference gases.
For isotope measurements the atmospheric CO2was continuously sampled by sorp-tion on molecular sieve, in bi-weekly intervals. After thermal desorpsorp-tion, the radiocar-bon activity in the given CO2sample was measured using benzene synthesis method and liquid scintillation spectrometry (Florkowski et al., 1975). The13C/12C ratio in the 5
collected CO2was determined by mass spectrometry.
Stable isotope composition of the analysed CO2 samples is expressed in δ nota-tion defined as per mille devianota-tion of the carbon isotope ratio measured in the sample (13C/12C) from that measured in the internationally accepted standard, VPDB (Coplen, 1996). The radiocarbon concentration of the measured samples was expressed as 10
∆14
C=[(As/Ast–1]×1000 where As and Ast stand for specific activity of the sample and the standard, respectively. Ast is corrected for decay since 1950 and normalized to δ13C=−19.0‰. As is normalized to δ13C=−25‰ (Stuiver and Pollach, 1977). Typical uncertainties of isotope analyses (±1 sigma) are in the order of ±0.1‰ for δ13C and ±8‰ for∆14
C. 15
4. Results and discussion
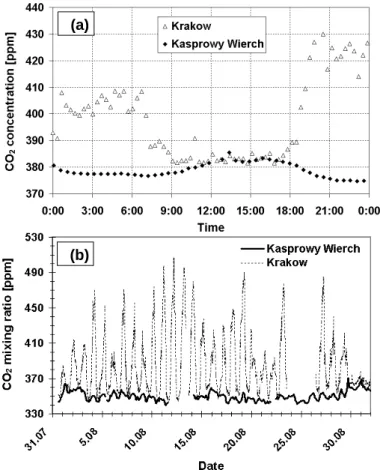
The CO2mixing ratios recorded at Kasprowy Wierch and Karkow stations are shown in Figs. 2a and b, respectively. The record for Kasprowy Wierch starts in June 1996 while in Krakow the measurements started only in 2003. Sampling at Kasprowy Wierch site was quasi continuous (except of breaks caused by technical problems), in contrary to 20
Krakow where it had a form of campaigns, whenever the GC instrument was available for this type of measurements.
It is apparent from Fig. 2 that these two records of CO2 mixing ratios differ consid-erably. The seasonal cycle, with reduced CO2mixing ratios during summer months, is well pronounced at Kasprowy Wierch. The presented record reveals typical behaviour 25
of atmospheric CO2 observed at mid-latitude continental sites of the Northern Hemi-sphere. The winter maximum ends in March, when the photosynthetic sink starts to
BGD
2, 1849–1865, 2005 Carbon dioxide in southern Poland L. Chmura et al. Title Page Abstract Introduction Conclusions References Tables Figures J I J I Back Close Full Screen / EscPrint Version Interactive Discussion
EGU
operate. From that time on, the CO2mixing ratio gradually decreases, reaching a mini-mum in August/September. Afterwards, the CO2level rises, reaching maximum values in January–February. During winter months, the influence of intense fossil fuel combus-tion in the near-by town Zakopane and its surroundings can be visible in the recorded concentrations of carbon dioxide. The peak-to-peak amplitude of the seasonal changes 5
of the measured CO2 mixing ratios varies significantly from year to year, the average being around 20 ppm. The measured mixing ratios reveal an increasing trend, from average value around 360 ppm in 1997 to around 380 ppm in 2004. The CO2 levels recorded in Krakow are generally higher (around 440 ppm in 2004) with much higher maxima of CO2content, reaching more than 600 ppm.
10
The comparison of diurnal CO2cycles recorded at Kasprowy Wierch and in Krakow is presented in Fig. 3. Figure 3a shows typical example of diurnal variability of CO2 mixing ratios, as recorded at both sites during summer time. Both the amplitude and the shape of diurnal CO2 changes differ considerably. In the urban environment, the lowest CO2 mixing ratios are recorded generally during mid-day, when the convective 15
activity of the lower atmosphere and resulting vertical mixing is at its maximum. In contrast, at the mountain site high CO2 mixing ratios are generally recorded during mid-day and early afternoon. This stems from sun-driven convection within the plane-tary bounday layer over Kasprowy Wierch “sucking” the CO2-laden air from the valleys towards the top of the mountain. Large differences in the amplitude of diurnal CO2 20
changes recorded at both sites are striking (Fig. 3b). In urban environment they may reach even ten times higher values that those recorded at the near-by mountain site. This is connected with presence of numerous local CO2 sources releasing relatively large amounts of CO2into the urban atmosphere, which further leads to elevated con-centrations and quasi-permanent excess of this gas above background concon-centrations, 25
which cannot be completely removed by mixing processes. This is illustrated by Fig. 4 which shows daily mean values of CO2mixing ratios recorded at both discussed sites during 2004. It is apparent from the data presented in Fig. 4 that the daily mean CO2 concentrations recorded at Krakow only seldom are comparable with those recorded
BGD
2, 1849–1865, 2005 Carbon dioxide in southern Poland L. Chmura et al. Title Page Abstract Introduction Conclusions References Tables Figures J I J I Back Close Full Screen / EscPrint Version Interactive Discussion
EGU
at the same time at Kasprowy Wierch. At most cases they are significantly higher. The annual average CO2 concentration in 2004 recorded at Kasprowy Wierch was equal 378 ppm while in Krakow it reached 408 ppm.
In addition to quasi-continuous observations of CO2 mixing ratios, also carbon iso-tope composition of this gas was regularly measured at both monitoring sites. The 5
measurements were performed on bi-weekly cumulative samples. This type of sam-pling is not adequate for studying short-term (diurnal) variability of the isotopic compo-sition of atmospheric CO2.
Measurements of carbon isotope composition of atmospheric CO2 have been initi-ated in Krakow in 1983. The early record of δ13C and ∆14C of atmospheric CO2 in 10
Krakow was published by Kuc (1991) and later analysed by Kuc and Zimnoch (1998). A dedicated study focused daily variations of CO2 mixing ratio and its stable isotope composition (δ13C, δ18O) within the urban atmosphere of Krakow was carried out by Zimnoch et al. (2004).
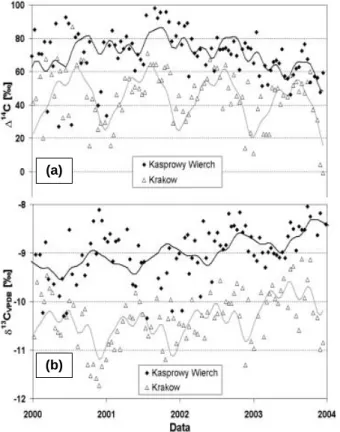
Figure 5 shows variations of14C and13C content in bi-weekly cumulative samples 15
of atmospheric CO2 collected at Krakow and Kasprowy Wierch during the four-year period (2000–2003). The apparent offset of the δ13C record for Krakow with respect to Kasprowy Wierch data in the order of 1.2‰ (Fig. 5b), is attributed to local emis-sions of CO2originating mostly from burning of fossil fuels. The offset of Krakow δ13C record with respect to maritime reference station Mace Head is even higher (around 20
2‰ – GLOBALVIEW, 2004). Upper envelope of the two records presented in Fig. 5b reveals a small increasing trend towards less negative δ13C values, pointing to dimin-ishing burden of regional atmosphere with CO2of anthropogenic origin. The Kasprowy Wierch δ13C record approaches the values reported for “clean” reference sites (GLOB-ALVIEW, 2004; Levin and Kromer, 1997). Seasonal fluctuations of δ13C visible at both 25
discussed sites are shifted in phase. The Krakow record reveals lowest δ13C values during winter season, when local CO2 emissions due to burning of fossil fuels in the city (heating plus car traffic) are most intense. At Kasprowy Wierch, less negative δ13C values are generally recorded during winter time, when advection of biospheric CO2
BGD
2, 1849–1865, 2005 Carbon dioxide in southern Poland L. Chmura et al. Title Page Abstract Introduction Conclusions References Tables Figures J I J I Back Close Full Screen / EscPrint Version Interactive Discussion
EGU
from the valleys beneath the station is cut-off and free tropospheric air is “seen” by the station more frequently.
Substantial fluxes of CO2of fossil-fuel origin lead to generally lower14C content in at-mospheric CO2recorded in urban environment, when compared to sites characterized by smaller anthropopression. This effect is clearly seen in Fig. 5a which shows records 5
of atmospheric14CO2concentration available for Krakow and Kasprowy Wierch. The Krakow∆14C record reveals distinct seasonality, with local minima of ∆14C occuring during winter months, when combustion of fossil fuels is most intense. This is not the case for Kasprowy Wierch where recorded fluctuations of ∆14C are much less pro-nounced and irregular. However, a distinct decreasing trend of14CO2concentration is 10
visible at both discussed sites and the difference between mean ∆14C values recorded for Krakow and Kasprowy Wierch is smaller from year to year, pointing to diminishing fluxes of radiocarbon-free CO2in Krakow. This is confirmed by energy-usage statistics for Krakow which indicate gradual reduction of coal burning in the municipal heating systems and reduction of low emission.
15
5. Conclusions
The presented work was focused on characterization of spatial and temporal variabil-ity of atmospheric concentrations of carbon dioxide and its isotopic composition, as recorded at two ground-level continental sites located in contrasting environments: (i) high-altitude mountaneous area, relatively free of anthropogenic influences, and (ii) 20
typical urban environment with numerous local sources of carbon dioxide. Despite of relative proximity of those sites, substantial differences in both the recorded CO2levels and their isotopic composition were detected. Human influence is clearly visible in the presented data, affecting both short- and long term changes of CO2 concentrations and its isotopic composition.
25
The CO2mixing ratios measured in the urban atmosphere revealed quasi-permanent excess concentration of this gas when compared with near-by background atmosphere.
BGD
2, 1849–1865, 2005 Carbon dioxide in southern Poland L. Chmura et al. Title Page Abstract Introduction Conclusions References Tables Figures J I J I Back Close Full Screen / EscPrint Version Interactive Discussion
EGU
The magnitude of this surplus is significant; in the studied case the annual mean CO2 concentration recorded in Krakow in 2004 was almost 10% higher than that recorded at high-altitude mountain site (Kasprowy Wierch). Such effect is occuring probably in all urban centers. For large cities with several million inhabitants this permanent surpluss of CO2may be significantly higher than that observed in this study. The elevated con-5
centrations of CO2are expected near the ground where people live and the biosphere is present. Moreover, one may argue that local climate in urban centers will be further modified by the presence of these elevated CO2 concentrations enhancing the effect of urban heat islands.
Carbon isotopic composition of atmospheric CO2 proved to be an efficient tool for 10
identification the surface CO2 fluxes into the atmosphere related to fossil fuel burning, their strength and temporal variability, as well as their influence on the recorded levels of this gas in the local atmosphere. The presented data clearly show that this influ-ence can be monitored on long term basis. The available records of∆14C for Krakow and Kasprowy Wierch suggest gradual reduction of14C-free CO2fluxes into the urban 15
atmosphere of Krakow in the past several years.
Acknowledgements. Partial financial support of this work through statutory funds of the Polish
Committee for Scientific Research (Project No. 11.11.220.01) as well as through EU Project CARBOEURO-IP (GOCE-CT-2003-505572) is kindly acknowledged. The authors wish to thank B. Lewandowska for14C preparations, J. Fiedorowicz for sample collection and H. Mroz for
20
mass-spectrometric measurements.
References
Cias, P., Tans, P. P., Troiler, M., White, J. W. C., and Francey, R. J.: A large northern hemisphere terrestrial CO2sink indicated by the13C/12C ratio of atmospheric CO2, Science, 269, 1098– 1102, 1995.
25
Coplen T. B.: New guidelines for reporting stable hydrogen, carbon and oxygen isotope-ratio data, Geochim. and Cosmochim. Acta., 60, 3359–3360, 1996.
BGD
2, 1849–1865, 2005 Carbon dioxide in southern Poland L. Chmura et al. Title Page Abstract Introduction Conclusions References Tables Figures J I J I Back Close Full Screen / EscPrint Version Interactive Discussion
EGU
D ´emeny, A. and Haszpra, L.: Stable isotope compositions of CO2 in background air and at polluted sites in Hungary, Rapid Comm. in Mass Spectr., 16, 797–804, 2002.
Florkowski, T., Grabczak, J., Kuc, T., and Rozanski, K.: Determination of radiocarbon in water by gas or liquid scintillation counting, Nukleonika, 20(11–12), 1053–1064, 1975.
GLOBALVIEW: Cooperative Atmospheric Data Integration Project – Carbon Dioxide,
CMDL-5
NOAA, Boulder, Colorado, (available via anonymous FTP at ftp://ftp.cmdl.noaa.gov, Path: ccg/co2/GLOBALVIEW), 2004.
IPCC: Integovernmental Panel on Climate Change, in: Climate Change 2001: The Scientific Basis, edited by: Houghton, J. T., The Third Report of Working Group 1, Cambridge Univer-sity Press, Cambridge, 2001.
10
Keeling, C. D.: Global observations of atmospheric CO2, in: The Global Carbon Cycle, NATO ASI Series, vol. 15, edited by: Heimann, M., Springer-Verlag, New York, 1–30, 1993. Keeling, C. D., Whorf, T. P., Wahlen, M., and Van der Plicht, H.: Interannual extremes in the
rate of rise of atmospheric carbon dioxide since 1980, Nature, 375, 666–670, 1995.
Kuc, T.: Concentration and carbon isotopic composition of atmospheric CO2 in southern
15
Poland, Tellus, 43B, 373–378, 1991.
Kuc, T. and Zimnoch, M.: Changes of the CO2 sources and sinks in a polluted urban area (southern Poland) over the last decade derived from the carbon isotope composition, Radio-carbon, 40, 417–423, 1998.
Kuc, T., Rozanski, K., Zimnoch, M., Necki, J. M., and Korus, A.: Anthropogenic emissions of
20
CO2and CH4in an urban environment, Applied Energy, 75(3–4), 193–203, 2003.
Levin, I. and Kromer, B.: Twenty years of high precision atmospheric14CO2 observations at Schauinsland station, Germany, Radiocarbon, 39(2), 205–218, 1997.
Levin, I. and Hesshaimer, V.: Radiocarbon – a unique tracer of global carbon cycle dynamics, Radiocarbon, 42, 69–80, 2002.
25
Marland, G., Boden, T. A., and Andres, R. J.: Global, regional and national CO2 emission estimates from fossil fuel burning, cement production, and gas flaring: 1751–1999, vol. 2002, Carbon Dioxide Information Analysis Center, Oak Ridge, Ten., 2002.
Necki, J., Schmidt, M., Rozanski, K., Zimnoch, M., Korus, A., Lasa, J., Graul, R., and Levin, I.: Six-year record of atmospheric carbon dioxide and methane at a high-altitude mountain site
30
in Poland, Tellus, 55B, 94–104, 2003.
Stuiver, M. and Polach, H. A.: Discussion: Reporting of14C data, Radiocarbon, vol. 19, no. 3, 355–363, 1977.
BGD
2, 1849–1865, 2005 Carbon dioxide in southern Poland L. Chmura et al. Title Page Abstract Introduction Conclusions References Tables Figures J I J I Back Close Full Screen / EscPrint Version Interactive Discussion
EGU
Thoning, K. W., Tans, P. P., and Komhyr, W. D.: Atmospheric carbon dioxide at Mauna Loa Observatory 2. Analysis of the NOAA GMCC data, 1974–1985, J. Geophys. Res., 94, 8549– 8565, 1989.
Zimnoch, M., Florkowski, T., Necki, J. M., and Neubert, R. E. M.: Diurnal variability of δ13C and
δ18O of atmospheric CO2in the urban atmosphere of Krakow, Poland, Isotopes in
Environ-5
BGD
2, 1849–1865, 2005 Carbon dioxide in southern Poland L. Chmura et al. Title Page Abstract Introduction Conclusions References Tables Figures J I J I Back Close Full Screen / EscPrint Version Interactive Discussion
EGU
(a)
(b)
Figure 1. Aerial view of the CO2 monitoring sites discussed in the paper: A - high-altitude
mountain site Kasprowy Wierch, Tatra Mountains; B - city of Krakow
Fig. 1. Aerial view of the CO2monitoring sites discussed in the paper: (a) high-altitude
moun-tain site Kasprowy Wierch, Tatra Mounmoun-tains;(b) city of Krakow.
BGD
2, 1849–1865, 2005 Carbon dioxide in southern Poland L. Chmura et al. Title Page Abstract Introduction Conclusions References Tables Figures J I J I Back Close Full Screen / EscPrint Version Interactive Discussion
EGU
(a)
(b)
Fig. 2. Records of CO2mixing ratios obtained for two contrasting environments, discussed in
the paper:(a) high-altitude mountain site Kasprowy Wierch, Tatra Mountains, (b) city of Krakow.
BGD
2, 1849–1865, 2005 Carbon dioxide in southern Poland L. Chmura et al. Title Page Abstract Introduction Conclusions References Tables Figures J I J I Back Close Full Screen / EscPrint Version Interactive Discussion
EGU (a)
(b)
Figure 3. Short-term variability of CO2 mixing ratios as observed at Kasprowy Wierch and
Krakow stations. A - typical example of diurnal changes of CO2 mixing ratio occurring at
both monitoring sites, B - comparison of the magnitude of diurnal changes of CO2 mixing
ratio recorded at Kasprowy Wierch and Krakow stations during summer (August 2002).
Fig. 3. Short-term variability of CO2mixing ratios as observed at Kasprowy Wierch and Krakow
stations.(a) typical example of diurnal changes of CO2mixing ratio occurring at both monitoring sites, (b) comparison of the magnitude of diurnal changes of CO2 mixing ratio recorded at Kasprowy Wierch and Krakow stations during summer (August 2002).
BGD
2, 1849–1865, 2005 Carbon dioxide in southern Poland L. Chmura et al. Title Page Abstract Introduction Conclusions References Tables Figures J I J I Back Close Full Screen / EscPrint Version Interactive Discussion
EGU
Figure 4. Daily mean values of atmospheric CO2 concentration recorded during 2004 at
Kasprowy Wierch and Krakow stations.
Fig. 4. Daily mean values of atmospheric CO2mixing ratio recorded during 2004 at Kasprowy
Wierch and Krakow stations.
BGD
2, 1849–1865, 2005 Carbon dioxide in southern Poland L. Chmura et al. Title Page Abstract Introduction Conclusions References Tables Figures J I J I Back Close Full Screen / EscPrint Version Interactive Discussion
EGU
(a)
(b)
Fig. 5. Changes of carbon isotopic composition of atmospheric CO2 recorded at Kasprowy
Wierch and Krakow stations during the time period 2000–2003. The data points represent bi-weekly cumulative samples. The lines are(a) changes of radiocarbon activity (∆14C),(b)
changes of13C content (δ13C). The smoothed curves were obtained using program recom-mended by NOAA/CMDL (CCGvu, ver. 4.40) (Thoning et al., 1989).