HAL Id: hal-00295721
https://hal.archives-ouvertes.fr/hal-00295721
Submitted on 11 Aug 2005
HAL is a multi-disciplinary open access
archive for the deposit and dissemination of
sci-entific research documents, whether they are
pub-lished or not. The documents may come from
teaching and research institutions in France or
abroad, or from public or private research centers.
L’archive ouverte pluridisciplinaire HAL, est
destinée au dépôt et à la diffusion de documents
scientifiques de niveau recherche, publiés ou non,
émanant des établissements d’enseignement et de
recherche français ou étrangers, des laboratoires
publics ou privés.
Comparison of rain gauge observations with modeled
precipitation over Cyprus using Contiguous Rain Area
analysis
N. Tartaglione, S. Mariani, C. Accadia, A. Speranza, M. Casaioli
To cite this version:
N. Tartaglione, S. Mariani, C. Accadia, A. Speranza, M. Casaioli. Comparison of rain gauge
obser-vations with modeled precipitation over Cyprus using Contiguous Rain Area analysis. Atmospheric
Chemistry and Physics, European Geosciences Union, 2005, 5 (8), pp.2147-2154. �hal-00295721�
www.atmos-chem-phys.org/acp/5/2147/ SRef-ID: 1680-7324/acp/2005-5-2147 European Geosciences Union
Chemistry
and Physics
Comparison of rain gauge observations with modeled precipitation
over Cyprus using Contiguous Rain Area analysis
N. Tartaglione1, S. Mariani2, C. Accadia2, A. Speranza3, and M. Casaioli2
1Department of Physics, University of Camerino, Camerino, Italy
2Agenzia per la Protezione dell’Ambiente e per i Servizi Tecnici, Rome, Italy
3Department of Mathematics and Informatics, University of Camerino, Camerino, Italy
Received: 19 January 2005 – Published in Atmos. Chem. Phys. Discuss.: 18 April 2005 Revised: 20 June 2005 – Accepted: 28 July 2005 – Published: 11 August 2005
Abstract. Verification of modeled rainfall with precipitation
observed by a rain gauge network has been performed in a case study over the Cyprus Island. Cyprus has a relatively dense rain gauge network. The applied verification method is the Contiguous Rain Area (CRA) analysis. Some drawbacks of the CRA method are pointed out when it is applied to such a case study. Impact on the CRA results, when considering different dimensions of the verification sub-domain and dif-ferent types of indicators (correlation and mean square error) used in the comparison, are discussed. Results indicate that care should be taken when verification of modeled rainfall is performed over a domain smaller than the model one.
1 Introduction
Oceans cover a large part of our planet; as a consequence of that, much rain falls at sea. Unfortunately, oceanic rainfall is difficult to measure. Although many climatologic stud-ies (Ikai and Nakamura, 2003; Imakoa and Spencer, 2000; Michaelides et al., 2004) show that satellite sensors can pro-vide information on hydrological cycle, verification of short-term forecasts (up to 2 days), over marine regions, remains problematic. It is possible to have information to estimate rainfall where islands, with rain gauges, are present. It is known that numerical models provide area average informa-tion on grid points, not point values. Thus, comparison be-tween forecast rain and observations collected over small is-lands by very few rain gauges may produce misleading re-sults, since such small islands can be thought as point loca-tions. Cyprus is an island large enough to have a dense rain gauge network, but it is not so large as to be considered as a land region. Its orography is simple enough, having an iso-lated mountain in the western part (Mt. Olympus; 1951 m)
Correspondence to: N. Tartaglione
and a thin barrier in northern part. This work was carried out within the framework of the VOLTAIRE European project (Validation of multi-sensor precipitation fields and numeri-cal modeling in Mediterranean test sites), where the island of Cyprus is one of test sites.
One of the tasks of this project is the comparison be-tween all available observations and numerically modeled rain fields. Comparison between model outputs and obser-vations is useful for assessing the capacity of models to well predict variables like precipitation. A method for evaluating forecast precipitation quality, in order to assess horizontal displacements, is the Contiguous Rain Area (CRA) analysis (Ebert and McBride, 1998, 2000). The CRA analysis allows decomposing the total spatial error into three different error sources: displacement, rain volume and pattern errors. Usu-ally, verification of rain events is performed over large do-mains, often at national scale (Accadia et al., 2005; McBride and Ebert, 2000; Mesinger, 1996). However, for large do-mains, verification of a single event might be difficult when other simultaneous events are present. McBride and Ebert (2000) pointed out that a way to avoid this problem is to per-form regional verification. The verification problem is also complicated by the presence of different rainfall patterns in a single event. Orographic precipitation and frontal rainfall might alter model skill assessment, especially where obser-vations are only available over small areas. In this paper, the authors study a rain event where this kind of problem is present.
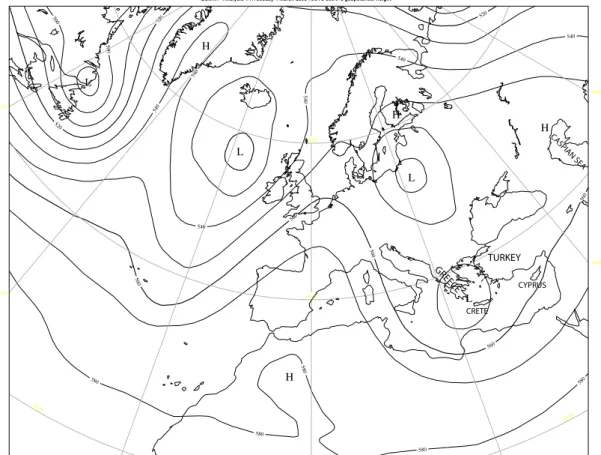
In this work a numerical model is verified over Cyprus for a relatively heavy precipitation event during the period 5–6 March 2003. Actually observed rainfall was due to a cold front that advected moist air from south associated with a trough with its main axis lying west of the island. This syn-optic system was originally associated with an upper level cold air pool over Italy on 3 March. This cyclone moved then eastward, affecting southern Greece and Crete on the 4th March as shown in Fig. 1. The system slowed down
2148 N. Tartaglione et al.: Contiguous Rain Area-based verification over Cyprus H H H H L L L L 50 0 500 520 520 520 54 0 540 540 540 540 540 560 560 560 560 560 580 580 580 580 580 20∞N 20∞N 40∞N 60∞N 60∞W 60∞W 40∞W 40∞W 20∞W 20∞W 0∞ 0∞ 20∞E 20∞E 40∞E 40∞E 60∞E 60∞E ECMWF Analysis VT:Tuesday 4 March 2003 18UTC 500hPa geopotential height
CASP IAN SEA TURKEY CYPRUS CRETE GR EECE
Fig. 1. 500 hPa geopotential at 18:00 UTC, 4 March 2003.
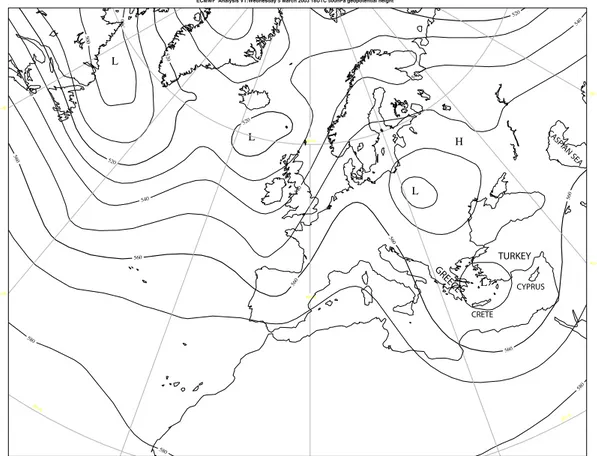
during the following 24-h remaining almost standing over the eastern Mediterranean Sea. At 18:00 UTC on 5 March, the 500 hPa geopotential pattern (Fig. 2) shows as the cy-clone’s centre is located north of the island of Crete between Greece and Turkey. The persistence of this cyclone over the Eastern Mediterranean produced very intense precipitation over the southern part of Turkey and moderate rainfall over Cyprus during the 24-h period ending at 6 March, 06:00 UTC (Fig. 3).
This article is divided as follows. Section 2 describes the model, data and methodologies used for estimating the dis-placement and intensity errors of forecast rainfall. In Sect. 3 the CRA analysis is applied and results are described, prob-lems met in this case are discussed. Finally in Sect. 4 con-clusions are presented.
2 The model, data and methods
2.1 The BOLAM Model
The model used in this comparison is the BOlogna Lim-ited Area Model (BOLAM) developed at FISBAT-CNR (now ISAC-CNR) (Buzzi et al., 1994). BOLAM is a finite differ-ence, hydrostatic primitive-equations model. The dynamical
core is based on the Forward-Backward Advection Scheme (FBAS) developed by Malguzzi and Tartaglione (1999). This scheme, formally equivalent to the leapfrog scheme, is much more efficient since it can run with a Courant number up to two, and it can be coupled with a forward-backward scheme for solving the gravity waves. The numerical diffusion is
based on ∇4operator. The model presents a few
hydromete-ors that are advected by a lagrangian scheme. The convection scheme consists in the Kain-Fritsch parameterization (Kain and Fritsch, 1990, 1995). The radiation parameterization fol-lows the Geylen scheme (Geleyn and Hollingsworth, 1979). The model runs on a rotated Arakawa C grid (in geographical coordinates), where the rotated equator goes across the do-main’s midlatitude, in order to minimize grid anisotropy. The
standard 6-h, 0.5◦resolution, 60 hybrid level, European
Cen-tre for Medium-Range Weather Forecasts (ECMWF) analy-ses and forecasts were first horizontally interpolated to the
BOLAM outer domain, with 0.3◦ grid spacing resolution,
covering the entire Mediterranean region, and then vertically interpolated to 40 equally spaced sigma levels. A smaller
do-main (with 0.09◦grid spacing) covering the Eastern
Mediter-ranean (Fig. 3) was nested in the larger and coarser one that provides initial and boundary conditions.
H L L L L 50 0 500 520 520 520 520 540 540 540 540 540 560 560 560 560 560 560 580 580 580 20∞N 20∞N 40∞N 60∞N 60∞W 60∞W 40∞W 40∞W 20∞W 20∞W 0∞ 0∞ 20∞E 20∞E 40∞E 40∞E 60∞E 60∞E ECMWF Analysis VT:Wednesday 5 March 2003 18UTC 500hPa geopotential height
CA SP IAN SEA GR EECE CRETE CYPRUS TURKEY
Fig. 2. 500 hPa geopotential at 18:00 UTC, 5 March 2003.
2.2 Observed precipitation
The Cyprus rain gauges, which were available in the Eu-ropean Project VOLTAIRE (http://www.voltaireproject.org) were used to compare rainfall modeled by BOLAM. The Cyprus rain gauge network (managed by the Cyprus Mete-orological Service) is composed of 147 rain gauges, cov-ering the Western part of the island. The precipitation is accumulated in 24 h, starting from 06:00 UTC of each day and ending at 06:00 UTC of the following day. The event occurred on 5 March 2003 when a cyclone interested the Eastern Mediterranean. Thus, precipitation analyzed in the present paper was accumulated from 06:00 UTC, 5 March 2003 to 06:00 UTC, 6 March 2003.
Gridded analysis of the observed precipitation field has been performed using a two-pass Barnes scheme (Barnes, 1973). This technique assigns a gaussian weight to an obser-vation as a function of distance between the obserobser-vation and grid box center. The two-pass implementation described by Koch et al. (1983) has been applied. A first pass is performed to produce a first guess precipitation analysis, followed by a second pass that increases the amount of detail from the previous pass. The convergence parameter is set to 0.2 for both passes, while the average data spacing has been set to
0.2◦. This setting is consistent with the constraint that the
ra-tio between grid size and average data spacing lays between 0.3 and 0.5 (Barnes, 1964, 1973). Grid points that do not
have any rain gauge within a radius of 0.15◦were neglected
to avoid the excessive rainfall spreading introduced by the analysis scheme on grid points far from the actual locations of rain gauges.
2.3 Forecast precipitation
The precipitation used for the comparison was the one
fore-cast by BOLAM having a grid spacing of 0.09◦. Modeled
rain was accumulated in the same time period of the obser-vations. Contours of the forecast precipitation over the inte-gration domain are shown in Fig. 3. In order to perform a ho-mogenous comparison, model output was interpolated from the native grid to a latitude-longitude grid with a horizontal
grid spacing of 0.09◦. The interpolation scheme is the
remap-ping procedure (Baldwin, 2000; Accadia et al., 2003), used operationally at the National Centers for Environmental Pre-diction/Environmental Modeling Center (NCEP/EMC). Ac-cadia et al. (2003) have recently shown that the NCEP remap-ping scheme is better than a simple bilinear interpolation scheme. Contours of the remapped precipitation, zoomed in the region of Cyprus, are shown in Fig. 4.
2150 N. Tartaglione et al.: Contiguous Rain Area-based verification over Cyprus
Fig. 3. Contours of precipitation, in mm, forecast in 24 h (from 06:00, 5 March 2003 to 06:00, 6 March 2003) over the native do-main of BOLAM.
2.4 Methods
Comparison between forecast and observed fields, both in a statistical and in a deterministic (case-study) approach, can be performed in many ways. For example, by using vi-sual verification, continuous and categorical statistics or joint distributions (Wilks, 1995), just to mention a few. These methods are also called standard. Diagnostic verification methods, like scale decomposition, entity-based and event-oriented analysis (Ebert, 2004), can be also used together with the aforementioned standard verification methods.
In particular, in an operational forecasting activity context, the most commonly used tools for statistical evaluation of quantitative precipitation forecasts (QPFs) are nonparamet-ric skill scores (i.e., ETS, BIA, POD, FAR, etc.) based on contingency tables. However, single case-study verification by means of standard nonparametric statistical methods may lead to unstable results, due to the paucity of the statistical sample. Since the interest is in the assessment of pattern and volume differences between observations and model forecast for a single event, the use of an object-oriented technique like the CRA (Ebert and McBride, 1998, 2000) analysis was preferred. This object-oriented technique is simply based on a pattern matching of two contiguous areas, defined as the observed and forecast precipitation areas delimited by a cho-sen isohyet. The event magnitude, although intense for the Cyprus Island, did not reach particularly high levels; hence the isohyet (CRA rain rate contour) was set to 0.0 mm/24 h.
Fig. 4. Contours of precipitation, in mm, forecast in 24 h (from 06:00, 5 March 2003 to 06:00, 6 March 2003) remapped on a longitude-latitude grid. This area was used in the comparison.
Fig. 5. Isohyets, in mm, observed in 24 h (from 06:00, 5 March 2003 to 06:00, 6 March 2003) interpolated on a latitude-longitude grid, over the Cyprus region.
Thus, to perform the pattern matching and obtain the best agreement between observations and forecasts, the forecast field is shifted within a rectangular domain enclosing the CRA, whose size (shifting value) is selected by the user.
When dealing with precipitation or, more in general, when the question is about forecast ability to match the field max-ima, the most suitable criterion to measure the spatial er-ror is the mean square erer-ror (MSE) minimization. Hence, in this study the displacement error was assessed by appro-priately shifting the forecast precipitation field so that the total squared difference against the observed rain field was minimized. This approach has the appealing feature that it is possible to simply decompose the error into three com-ponent sources: the displacement, the pattern and the vol-ume errors (Ebert and McBride, 2000). However, to deter-mine the horizontal displacement of the forecast precipita-tion pattern, the maximum pattern correlaprecipita-tion criterion was
a)
b)
c)
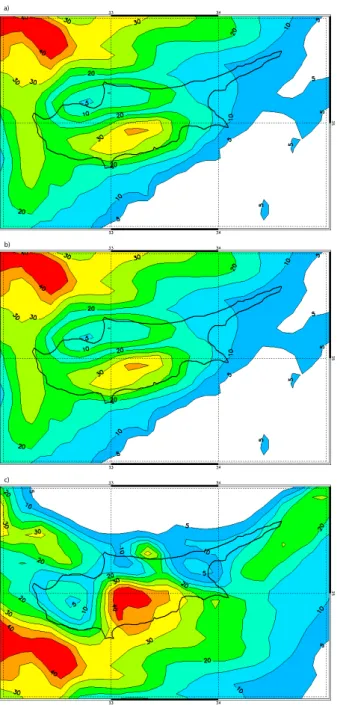
Fig. 6. Contours of modelled precipitation, for the three cases de-scribed in the text: (a) 9 grid points, (b) 13 grid points, (c) 17 grid points, shifted by an amount in according with column 3 of the Ta-ble 1 (correlation criterion).
also considered. This criterion tends to match the pattern structure of the observed and forecast fields.
The two criteria may produce, in general, different results, over a small or irregular CRA domain, as opposed to verifi-cation over a large CRA domain (Ebert and McBride, 2000). Moreover, the use of MSE criterion in a limited spatial do-main may lead to misleading results. This happens when the algorithm minimizes MSE, shifting the forecast field out of
a)
b)
c)
Fig. 7. As Fig. 6, but for MSE criterion (see Table 2).
the domain, instead of matching up with the nearby observa-tion field (Grams et al., 2005).
The CRA analysis has been performed using three shifting values sv: 9, 13 and 17; hence, the precipitation forecast field
was shifted from −sv to sv grid points (i.e., from −sv×0.09◦
to sv×0.09◦) both in latitude and in longitude.
Since observations were not available on each grid point, the number N of grid points, where the analysis was per-formed, changed from shift to shift. For this reason, a mini-mum requirement in the correlation (not to be confused with the pattern-matching criterion) had to be fulfilled in order
2152 N. Tartaglione et al.: Contiguous Rain Area-based verification over Cyprus
Table 1. CRA Verification for 24 h rainfall from 06:00 UTC, 5 March 2003 to 06:00, 6 March 2003. A CRA rain rate contour of 0.0 mm/24h (rain-norain areas) has been selected. The maximum observed precipitation value (from Barnes analysis) is equal to 28.1 mm/24 h. CRA matching criterion: correlation maximization.
Shift in Maximum [E, N] Compar. Initial Shifted MSE MSE MSE Initial Shifted
grid points forecast displacement grid MSE MSE displ. vol. patt. corr. corr.
(mm/24 h) (degree) points (mm2) (mm2) (%) (%) (%)
9 47.9 [0.27, 0.09] 73 84.28 78.15 7.30 54.34 38.36 0.506 0.693
13 56.5 [0.27, 0.09] 73 84.28 78.15 7.30 54.34 38.36 0.506 0.693
17 77.9 [0.36, −1.35] 73 84.28 126.83 – – – 0.506 0.746
Compar. grid points = Number of comparing grid points used in the CRA verification MSE displ. = Percentage of spatial error due to displacement error
MSE vol. = Percentage of spatial error due to volume error MSE patt. = Percentage of spatial error due to pattern error
Initial corr. = Pearson correlation coefficient between observation and forecast fields
Shifted corr. = Pearson correlation coefficient between observation and the best matching forecast fields.
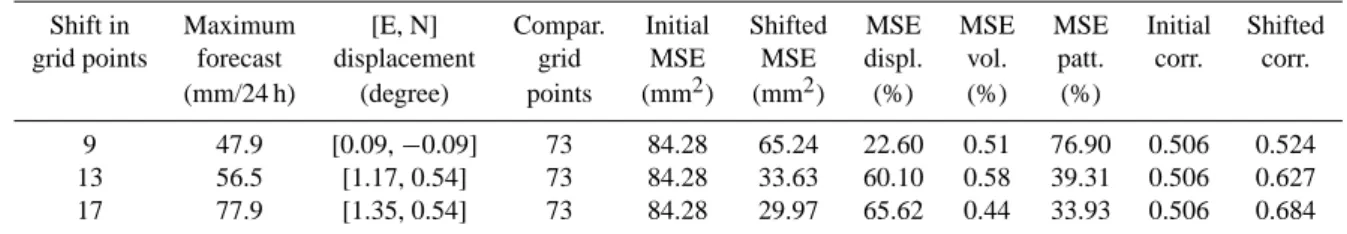
Table 2. As Table 1, but CRA matching criterion: MSE minimization.
Shift in Maximum [E, N] Compar. Initial Shifted MSE MSE MSE Initial Shifted
grid points forecast displacement grid MSE MSE displ. vol. patt. corr. corr.
(mm/24 h) (degree) points (mm2) (mm2) (%) (%) (%)
9 47.9 [0.09, −0.09] 73 84.28 65.24 22.60 0.51 76.90 0.506 0.524
13 56.5 [1.17, 0.54] 73 84.28 33.63 60.10 0.58 39.31 0.506 0.627
17 77.9 [1.35, 0.54] 73 84.28 29.97 65.62 0.44 33.93 0.506 0.684
to consider each shift as reasonable. The correlation value depends on the effective number of indipendent comparing samples, which are function of N and the autocorrelation of both the observed and forecast fields. After choosing a 95% confidence level, the F test (Panofsky and Brier, 1958; Xie and Arkin, 1995) was chosen to assess the statistical signifi-cance of each shift.
3 CRA applied to rain field over Cyprus
Figure 5 shows the observed rainfall, accumulated in 24 h, obtained with the Barnes analysis method. 73 model grid points are included in the area covered by rain gauges. Fig-ure 4 shows the 24-h accumulated forecast precipitation over the Cyprus region. The classical visual subjective verifica-tion indicates a slight westward displacement of the forecast precipitation field with respect to the observed one. This
displacement can be estimated in 0.6◦ westward, and 0.1◦
southward. Maximum precipitation recorded during the con-sidered time was about 40 mm in 24 h. This value has the same magnitude of maximum precipitation modeled by BO-LAM over Cyprus. Overall, the BOBO-LAM rain forecast can be assessed (subjectively) as a good forecast.
The Barnes analysis method produces a smoother ob-served precipitation field, so the precipitation assigned to each grid point is different from observations available at sin-gle stations. In this case the rain gauge network covers an area smaller than the integration domain of the model, hence it is natural to ask which subset of the model domain is the best to use for the CRA comparison. The subsets used in this work have been described in Sect. 2. Results obtained with the criterion of the maximum correlation are shown in Ta-ble 1 and those obtained with the minimum MSE are shown in Table 2.
Figures 6 and 7 show the shifted rain fields with displace-ment values as in column 3 of both tables. Although highest correlation values of data, in Table 1, and lower values of MSE, in Table 2, are found for a maximum allowed shift of 17 grid points, they seem to be the least reliable. In fact, using the maximum correlation criterion (Table 1), the shift, which gives the best correlation, is actually associated with an increase of MSE. Thus, a negative displacement error was obtained, then it was impossible to perform the MSE decomposition (see dashes in Table 1). The corresponding displacement found using the minimum MSE criterion (Ta-ble 2) is not consistent with the one found using the other criterion, although the associated correlation is the best of
those shown in Table 2. A visual inspection of Figs. 5, 6c and 7c indicates that the forecast displacement found using both methods with such a relatively large maximum allowed shift (17 grid points) yields an unphysical comparison be-tween forecast an observed fields. A larger domain over a relatively small verification area might produce incorrect tern matching due to the presence of many precipitation pat-terns that satisfy either minimum MSE or maximum correla-tion criteria. Considering the results associated with the other shifts, the correlation seems to be more stable than MSE cri-terion (cf. Tables 1 and 2). Displacements found with the for-mer method remain the same using either 9 or 13 grid points as maximum shift. For 17 grid points, this is not true. More-over, results obtained using the correlation criterion seems to be more physically plausible (cf. Figs. 4, 6 and 7).
It is worth noting in Table 2 that when the maximum al-lowed shift is 9 grid points the pattern error represents about 77% of total error, whereas volume error is close to zero. This should not come as a surprise since minimization of mean square error implies a minimization of the volume er-ror. These results are different from those obtained with the maximum correlation criterion, where volume error is higher, accounting for about 54% of total error. Instead, the maxi-mization of correlation implicates a minimaxi-mization of the pat-tern error. Such a minimization should be obtained by the modeled rain pattern that is closest to the observed pattern, if the forecast is good, inducing also a low value of the dis-placement error, as observed in this case. Shift for the
max-imum and significant correlation is 0.27◦West, 0.09◦South
as shown in Table 1. These values are close enough to ones obtained in the subjective and qualitative visual comparison and indicate a quite good forecast.
Considering the low value of the displacement (0.09◦
cor-responds to 1 grid point) in the first row of Table 2, it can be noted that for a domain allowing a 9 grid point shift, the MSE criterion indicates that this forecast was specifically good.
4 Conclusions
Although verification of rainfall using contiguous rain area analysis is an effective approach to verify systematic errors in quantitative precipitation forecasts (McBride and Ebert, 2000), some care has to be taken in the evaluation of precip-itation for small areas. This is especially important where small rain gauge networks are present, such as in islands like Cyprus. Thus, verification of modeled precipitation in ocean regions might present problems completely different from large land regions, where large rain gauge networks and more weather events may coexist.
In this paper the authors investigated the CRA approach to verify precipitation forecast during a single rain event over Cyprus. Two or more forecast rainfall patterns, with their rel-ative maximum, near each other might make the CRA
analy-sis unstable when observations are compared with these pat-terns that might be well far off the island.
Actually, verification of modeled rain is currently per-formed over large land regions as, for example, Australia and USA. However, as remarked by Ebert and McBride (2000), verification at national scale using standard techniques might produce misleading results when multiple weather systems are present. Instead, an objective-oriented technique, such as the CRA analysis, is able to separate the multiple weather systems’ effects by separately focusing on the regional do-main of each system.
In the case discussed in this paper, the verification area seems to be too small compared to the forecast rain field in order to have a physically significant CRA analysis. Since the considered observations are limited over the Cyprus area, the comparison was performed considering only a small model sub-domain covering the rain gauge network. How-ever, it must be pointed out that the presented results were always statistically significant. This indicates that area veri-fication may be still dependent on a subjective choice of di-mensions of the forecast domain to be verified. This might be a problem when verifying precipitation forecasts using the CRA method over areas small, if compared with the model domain.
Although defining the right dimension of the verification area is a problem, as showed earlier, it is necessary to define also the statistical indicator to use in the verification.
Correlation seems to be a better indicator than mean square error, for the case analyzed in this paper. It should be remarked that this could not be true in general. In other cases other indicators, as the same mean square error, might be bet-ter than correlation. However, in many cases maximization of correlation and minimization of mean square error give similar displacements. Decision of the type of indicator to use likely will depend on region or/and season (i.e. from the phenomenology). For example, Grams et al. (2005) found that the maximization of correlation worked better when con-sidering convective systems. Thus, an assessment of the re-liability of the indicator should be performed by operational centres currently using the CRA method. Actually, the pres-ence of different patterns on the control domain can induce some kind of errors, especially if the method is applied in an automated unsupervised way.
Evaluation of a precipitation forecast skill with indicators like MSE involves differences between observed and forecast fields. When different patterns of forecast rain are present close to the area of observation, the pattern associated with the best value of the selected indicator might not be the one actually associated with observed rainfall. On the other hand, correlation could not be the best indicator in other situations, for instance, when the analyzed field is very smooth. Thus, the choice of an appropriate verification methodology seems to be crucial for assessing model forecast quality.
2154 N. Tartaglione et al.: Contiguous Rain Area-based verification over Cyprus
Acknowledgements. This research was funded by EU project
VOLTAIRE (EVK2-2002-CT-00155). Authors are grateful at
Meteorological Service of Cyprus for rain gauge data. ECMWF provides data for the synoptic analysis and initial and boundary conditions for BOLAM. The authors wish to thank E. Amitai and U. Germann for some useful suggestions. We wish also to thank E. Ebert and M. Paulat who gave us useful comments and suggestions that improved the manuscript.
Edited by: H. Wernli
References
Accadia, C., Mariani, S., Casaioli, M., Lavagnini, A., and Speranza, A.: Sensitivity of precipitation forecast skill scores to bilinear and a simple nearest neighbor average method on high resolution verification grids, Wea. Forecasting, 18, 918–932, 2003. Accadia, C., Mariani, S., Casaioli, M., Lavagnini, A., and Speranza,
A.: Verification of precipitation forecasts from two limited area models over Italy and comparison with ECMWF forecasts using a resampling technique, Wea. Forecasting, 20, 276–300, 2005.
Baldwin, M. E.: QPF verification system documentation.
Available online at http://www.emc.ncep.noaa.gov/mmb/ylin/ pcpverif/scores/docs/mbdoc/pptmethod.html, 2000.
Barnes, S. L.: A technique for maximizing details in numerical weather map analysis, J. Appl. Meteor., 3, 396–409, 1964. Barnes, S. L.: Mesoscale objective analysis using weighted
time-series observations, NOAA Tech. Memo. ERL NSSL-62, Na-tional Severe Storms Laboratory, Norman, OK 73069, 60 pp. [NTIS COM-73-10781.], 1973.
Buzzi, A., Fantini, M., Malguzzi, P., and Nerozzi, F.: Validation of a limited area model in cases of Mediterranean cyclogenesis: Surface fields and precipitation scores, Meteor. Atmos. Phys., 53, 53–67, 1994.
Ebert, E. E.: Forecast Verification – Issues, Methods and FAQ, available online at http://www.bom.gov.au/bmrc/wefor/staff/eee/ verif/verif web page.html, 2004.
Ebert, E. E. and McBride, J. L.: Routine verification of NWP quan-titative precipitation forecasts for weather systems, 12th Confer-ence on Numerical Weather Prediction, Phoenix, AZ, Am. Me-teorol. Soc., J119–J122, 1998.
Ebert, E. E. and McBride, J. L.: Verification of precipitation in weather systems: determination of systematic errors, J. Hydrol., 239, 179–202, 2000.
Geleyn, J. F. and Hollingsworth, A.: An economical analytic method for the computation of the interaction between scattered and line absorption of radiation, Contrib. Atmos. Phys., 52, 1–16, 1979.
Grams, J. S., Gallus, W. A., Koch, S. E., Wharton, L. S., Loughe, A., and Ebert, E. E.: The use of a modified Ebert-McBride tech-nique to evaluate mesoscale model QPF as a function of convec-tive system morphology during IHOP 2002, Wea. Forecasting, in press, 2005.
Ikai, J. and Nakamura, K.: Comparison of rain rates over the ocean derived from TRMM microwave imager and precipitation radar, J. Atmos. Ocean. Technol., 20, 1709–1726, 2003.
Imakoa, K. and Spencere, R. W.: Diurnal variation of precipitation over the Tropical Oceans observed by TRMM/TMI combined with SSM/I, J. Climate, 13, 4149–4158, 2000.
Kain, J. S. and Fritsch, J. M.: A one-dimensional
entrain-ing/detraining plume model and its application in convective pa-rameterization, J. Atmos. Sci., 47, 2784–2802, 1990.
Kain, J. S. and Fritsch, J. M.: Convective parameterization in mesoscale models: The Kain-Fritsch scheme, The representation of cumulus convection in numerical models, A.M.S. Monograph, edited by: Emanuel, K. A. and Raymond, D. J., 165–170, 1995. Koch, S. E., desJardins, M., and Kocin, P. J.: An interactive Barnes
objective map analysis scheme for use with satellite and conven-tional data, J. Climate Appl. Meteor., 22, 1487–1503, 1983. Malguzzi, P. and Tartaglione, N.: An economical second order
ad-vection scheme for numerical weather prediction, Quart. J. Roy. Meteorol. Soc., 125, 2291–2303, 1999.
McBride, J. L. and Ebert, E. E.: Verification of quantitative precip-itation forecasts from operational numerical weather prediction models over Australia, Wea. Forecasting, 15, 103–121, 2000. Mesinger, F.: Improvements in quantitative precipitation forecasts
with the Eta regional model at the National Centers for Environ-mental Prediction: The 48-km upgrade, Bull. Amer. Meteorol. Soc., 77, 2637–2649, 1996.
Michaelides, S., Gabella, M., Constantinides, P., Perona, G.: Com-parison between TRMM data and in situ measurement in the is-land of Cyprus, Proceedings 2nd VOLTAIRE workshop, Ljubl-jana 6–8 October 2004.
Panofsky, H. A. and Brier, G. W.: Some applications of statistics to meteorology, Pennsylvania State University, University Park, 224, 1958.
Wilks, D. S.: Statistical methods in the atmospheric sciences, Aca-demic Press, 467, 1995.
Xie, P. and Arkin, P. A.: An intercomparison of gauge observations and satellite estimates of monthly precipitation, J. Appl. Meteo-rol., 34, 1143–1160, 1995.