HAL Id: hal-00296359
https://hal.archives-ouvertes.fr/hal-00296359
Submitted on 16 Oct 2007
HAL is a multi-disciplinary open access
archive for the deposit and dissemination of
sci-entific research documents, whether they are
pub-lished or not. The documents may come from
teaching and research institutions in France or
abroad, or from public or private research centers.
L’archive ouverte pluridisciplinaire HAL, est
destinée au dépôt et à la diffusion de documents
scientifiques de niveau recherche, publiés ou non,
émanant des établissements d’enseignement et de
recherche français ou étrangers, des laboratoires
publics ou privés.
Sacramento ? Part 1: Observations of ozone, nitrogen
oxides, and VOC reactivity
J. G. Murphy, D. A. Day, P. A. Cleary, P. J. Wooldridge, D. B. Millet, A. H.
Goldstein, R. C. Cohen
To cite this version:
J. G. Murphy, D. A. Day, P. A. Cleary, P. J. Wooldridge, D. B. Millet, et al.. The weekend effect
within and downwind of Sacramento ? Part 1: Observations of ozone, nitrogen oxides, and VOC
reactivity. Atmospheric Chemistry and Physics, European Geosciences Union, 2007, 7 (20),
pp.5327-5339. �hal-00296359�
www.atmos-chem-phys.net/7/5327/2007/ © Author(s) 2007. This work is licensed under a Creative Commons License.
Chemistry
and Physics
The weekend effect within and downwind of Sacramento – Part 1:
Observations of ozone, nitrogen oxides, and VOC reactivity
J. G. Murphy1,*, D. A. Day1,**, P. A. Cleary1,***, P. J. Wooldridge1, D. B. Millet2,****, A. H. Goldstein2, and R. C. Cohen1,3
1University of California at Berkeley, Department of Chemistry, USA
2University of California at Berkeley, Department of Environmental Science, Policy and Management, USA 3University of California at Berkeley, Department of Earth and Planetary Sciences, USA
*now at: Department of Chemistry, University of Toronto, Canada
**now at: University of California at Davis, Land, Air and Water Resources Department, USA ***now at: University of Pennsylvania, Department of Chemistry, USA
****now at: Harvard University, Department of Earth and Planetary Sciences, USA
Received: 30 October 2006 – Published in Atmos. Chem. Phys. Discuss.: 16 November 2006 Revised: 1 August 2007 – Accepted: 1 August 2007 – Published: 16 October 2007
Abstract. Day-of-week patterns in human activities can be
used to examine the ways in which differences in primary emissions result in changes in the rates of photochemical re-actions, and the production of secondary pollutants. Data from twelve California Air Resources Board monitoring sites in Sacramento, CA, and the downwind Mountain Counties air basin are analyzed to reveal day of week patterns in ozone and its precursors in the summers of 1998–2002. Measure-ments of non-methane hydrocarbons are available for the summers of 2001–2003 at three of these sites and NOxat six
of these sites for the full time period. This routine monitoring data is complemented by data sets of ozone and nitrogen ox-ide concentrations obtained in the summers of 2001 and 2003 at three sites in the region and comprehensive measurements of VOC reactivity at two sites in 2001. Daytime concentra-tions of nitrogen oxides (NOx≡NO+NO2) are approximately
35% lower on weekends at all the sites, whereas the VOC re-activity changes by less than 10%. All six sites in the Sacra-mento Valley have higher 8-h maximum average ozone on the weekend and are more likely to exceed the national stan-dard of 85 ppb on the weekend. In contrast, all the sites in the Mountain Counties are less likely to exceed the federal ozone standard on the weekend. Analysis of the day-of-week trends in odd oxygen show that the weekend effect of ozone within Sacramento is strongly influenced by NO sources close to the monitoring sites. This suggests that ozone measurements from monitoring sites close to highways, including two rural locations, may not be representative of the regional abun-dance, and lead to underestimates of long term exposure for humans and ecosystems.
Correspondence to: R. C. Cohen ([email protected])
1 Introduction
Day-of-week differences in meteorology and the chemical composition of the atmosphere have been frequently ob-served and attributed to the influence of humans on their environment (Ashworth, 1929; Cleveland et al., 1974; Gor-don, 1994; Beirle et al., 2003). Many analyses have shown that in urban areas in North America and Europe, concen-trations of ozone, a principal component of photochemical smog, maximize on the weekend, when emissions of its an-thropogenic precursors, nitrogen oxides (NOx≡NO+NO2)
and volatile organic compounds (VOC), are lowest (Jacob-son, 1975; Elkus and Wil(Jacob-son, 1977; Karl, 1978; Pryor and Steyn, 1995; Vukovich, 2000; Pont and Fontan, 2001; Pun et al., 2003). In contrast, at other sites, mainly those in rural areas or regions with high biogenic VOC emissions, ozone is at a minimum on the weekend (Cleveland and McRae, 1978; Altshuler et al., 1995; Husar, 1998; Heuss et al., 2003). Some analyses that grouped data according to meteorological vari-ables have shown that the sign of the weekend effect depends on whether meteorological conditions result in rapid ozone production (Bronnimann and Neu, 1997; Paschalidou and Kassomenos, 2004). Recent work has assessed the histori-cal evolution of the weekend effect in central and southern California (Marr and Harley, 2002b; Fujita et al., 2003).
A better understanding of the processes responsible for the weekend effect can provide direct insights into the policy-relevant question of how ozone concentrations are likely to respond to changes in precursor emissions (Altshuler et al., 1995; Blanchard and Fairley, 2001). Chemical trans-port model simulations using emission inventories that in-clude the day-of-week changes in the magnitude and timing
of emissions in urban areas have confirmed that there is a steeper reduction of NOxemissions compared to VOC
emis-sions on weekends, and that when these NOxreductions
oc-cur in NOx-saturated (VOC-limited) locations, they promote
the production of ozone (Marr and Harley, 2002a; Yarwood et al., 2003; Vukovich and Scarborough, 2004). Predictions from a recent modeling representation of a four-day period on the Iberian peninsula are consistent with observations of higher weekend ozone in urban areas, and lower ozone in regions downwind (Jimenez et al., 2005). However, most prior analyses have not included the detailed NOxand VOC
measurements, in both NOx-saturated and NOx-limited
en-vironments, that are essential for direct tests of mechanistic hypotheses. Those datasets that do exist are primarily short term, making it difficult to use observations to separate vari-ability due to emissions from that caused by meteorological variability.
The factors which have been hypothesized to explain the weekend effect in urban areas include (California Air Re-sources Board, 2003):
1. ozone titration – less suppression of ozone by lower NOxemissions on weekend mornings
2. increased weekend emissions – different activity pat-terns on the weekend actually generate more O3
pre-cursors
3. aerosol and UV radiation – more of the photons required to initiate ozone production reach the Earth’s surface on weekends because of reduced aerosol concentrations 4. NOx timing – weekend traffic patterns result in more
NOx being available during times of high
photochem-ical productivity resulting in more efficient instanta-neous ozone production (P(O3))
5. carryover at the surface - heavier traffic on Friday and Saturday nights results in a greater availability of O3
precursors at the surface on weekend mornings 6. carryover aloft – large amounts of ozone and
precur-sors persist above the nighttime boundary layer and mix down to the surface the following day in such a way that weekend concentrations are higher in urban areas 7. NOxdependence of P(O3) – lower NOxon weekends in
NOx-saturated areas leads to more rapid ozone
produc-tion
In this paper, we present observations of the day-of-week dependences of maximum 8-h average O3 concentrations,
and exceedances of the 8-h standard (85 ppb) from urban sites in the Sacramento Valley (SV) and more rural sites in the Mountain Counties (MC) air basins of central California between 1998 and 2002. The topography of the region en-sures that regular diurnal flow patterns persist (Zhong et al., 2004) and that datasets from entire summers can be treated
in a statistically meaningful way without meteorological fil-ters. Additionally we use measurements of NO, NO2, and
volatile organic compounds (VOC) to probe the photochem-ical environment for ozone production. The California Air Resources Board routinely monitors O3, NO, and NO2 at
urban sites in the Sacramento Valley and O3 at sites in the
Mountain Counties. We augment these routine observations with measurements of NO2, total peroxy nitrates (6PNs),
to-tal alkyl nitrates (6ANs) and HNO3made by thermal
disso-ciation laser-induced fluorescence (TD-LIF) (Cleary et al., 2002; Day et al., 2002) at additional sites in the two air basins, to extend our understanding of the role of nitrogen oxides in regional ozone production. Gas chromatography measurements of speciated VOC (Lamanna and Goldstein, 1999; Rubin et al., 2006) in the SV and MC are used to assess differences in VOC reactivity with OH between weekday and weekend.
Simultaneous measurements of O3and NO2permit
evalu-ation of the role of the first hypothesis: ozone suppression by NO emissions, both during morning rush hour and through-out the day. Direct measurements of the NOx and VOC
precursors to ozone enable us to investigate the veracity of the second hypothesis. Observations of PM10 in the
Sacra-mento Valley are used to assess the third hypothesis: the ef-fect of varying aerosol concentrations on ozone formation. In a companion paper (J. G. Murphy et al.: The weekend effect within and downwind of Sacramento – Part 2: Obser-vational evidence for chemical and dynamical contributions; hereafter referred to as Murphy et al., 2007b), we will ex-tend the analysis to examine the final four hypotheses in the list above. These four hypotheses are related to the complex interplay between the emissions, non-linear photochemistry and dynamics that govern the production and distribution of ozone on the regional scale. This data set offers the unique opportunity to use the weekend effect to assess the evolution of the NOx-dependence of an airmass from an urban center
as it is advected toward a rural mountainous region.
The chemical coupling between ozone and NOxresults in
non-linear relationships at concentrations of atmospheric rel-evance. The interconversion of O3, NO and NO2occurs
pri-marily through the following two reactions which constitute a chemical null cycle but act to partition the species accord-ing to the physical conditions (T , hν).
NO + O3→NO2+O2 (R1)
NO2+hν O2
−→NO + O3 (R2)
Net production of ozone occurs following the oxidation of volatile organic compounds (VOC) and CO by OH to gener-ate peroxy (HO2+RO2) radicals (R3), which can oxidize NO
to NO2(R4). The subsequent photolysis of NO2regenerates
NO and produces an O(3P) atom which combines with O2
to form ozone (R2). The rate of ozone production is set by (R4a). At low concentrations of NOx, [HO2+RO2] are
increases in NO. However, high concentrations of the nitro-gen oxide precursors relative to the reactivity of VOC pro-motes the reaction of OH with NO2(R5), which suppresses
the hydroxyl radical, slows the production of HO2+RO2, and
results in less ozone production. In other words, RO2
be-comes inversely dependent on NOxat high concentrations of
NOx, resulting in a non-linear dependence of O3production
on NOxabundance. At low concentrations of NOx, peroxy
radicals are lost mainly through self-reaction (R6).
OH + VOC−→O2 H2O + RO2 (R3)
RO2+NO → RO + NO2 (R4a)
RO2+NO + M → RONO2+M (R4b)
OH + NO2+M → HNO3+M (R5)
RO2+R′O2→ROOR′+O2 (R6)
Figure 1 shows the qualitative behavior of the ozone pro-duction rate over a wide range of NOx concentrations and
at three different VOC reactivities (≡6k3 [VOC]). On the
left-hand side of the figure, decreasing NOxconcentrations
reduce P(O3) whereas changes in VOC reactivity have little
effect. On the right-hand side of the figure, decreasing NOx
increases P(O3) and decreasing VOC reactivity decreases
P(O3). In the intermediate range, where ozone production
rates are at a maximum, reductions in both VOC and NOx
can be effective at reducing ozone production. Much effort is currently expended in assessing the NOx dependence of
ozone production with the goal of developing emission re-duction strategies that will successfully decrease ozone vio-lations without placing unnecessary restrictions on transport and industrial activity (National Research Council, 2004). The rate of ozone production (limited by R4a) is rarely eval-uated directly in the atmosphere, because peroxy radicals are extremely challenging to measure (Heard and Pilling, 2003). The relationships between ozone and other prod-ucts of the associated photochemistry such as nitric acid (R5) and peroxides (R6) have been suggested as an indirect mea-sure of the NOx-dependence of ozone production in an
air-mass (Sillman, 1995), although the relationships predicted by models have not been extensively compared to observa-tions. Weekday-weekend differences in precursor emissions are a nominally well-controlled experiment that allows us to test the dependence of ozone production on NOx
concentra-tion. Examining the sign and magnitude of the weekend ef-fect in a region may help in diagnosing the NOx regime in which the majority of ozone is produced and suggest an ef-fective course of action.
2 Air quality in the Sacramento region and downwind
Sacramento and the Sierra Nevada foothills to its east have been designated by the federal Environmental Protection
Fig. 1. The dependence of the ozone production rate P(O3) on the
abundance of nitrogen oxides (NOx) at three different VOC
reac-tivities. As the VOC reactivity is increased, the concentration at which O3production becomes NOx-saturated is higher. Increasing
VOC reactivity increases O3production where NOxis high but has
a small effect when production is NOx-limited. The exact quantities
obtained depend on the production and loss rates of HOxwhich for
this calculation are set to 2.25 ppb h−1(a reasonable value based on
production from the photolysis of ozone and formaldehyde).
Agency as a ‘serious’ non-attainment region that will require one of the latest attainment deadlines in the United States for the amended air quality standards, due to the severity of the problem. Violation of the 1997 National Ambient Air Quality Standard in ozone occurs when the 3-year average of the fourth highest daily maximum 8-h ozone concentra-tion measured at a monitor equals or exceeds 85 ppb. The Clean Air Act requires each state to develop a State Imple-mentation Plan (SIP) to attain the standard by a deadline set by the federal EPA. Strong sunlight, high temperatures, sig-nificant VOC and NOxemissions from mobile sources, and
biogenic emissions of reactive VOC from vegetation in the Sierra foothills combine to generate optimal conditions for rapid photochemical ozone production in the region. The state agency in charge of monitoring air quality and com-piling the SIP, the California Air Resources Board (CARB), has divided the region into two distinct air basins, the pop-ulous, low elevation Sacramento Valley, and the more rural, high elevation Mountain Counties (Fig. 2). While the geo-graphical extent of the MC extends further south and north along the western slope of the Sierra Nevada, the analysis presented in this paper is limited to those sites likely to be influenced by the Sacramento urban area. We include six sites in the Sacramento Valley Air Basin: T Street, Del Paso, North Highlands, Roseville, Folsom and Elk Grove and six sites in the Mountain Counties Air Basin downwind of Sacra-mento: Cool, Colfax, Placerville, White Cloud, Jackson and a non-CARB site, the University of California Blodgett For-est Research Station (UC-BFRS). Shorter term data sets with more comprehensive chemical measurements were acquired
Fig. 2. The location of the monitoring sites in the Sacramento
Val-ley and Mountain Counties (separated by the dashed line) used in this analysis.
by UC Berkeley researchers at two additional sites: Gran-ite Bay (July–September 2001) and Big Hill (March 2003– March 2004) and are used to inform our analysis of the longer term data sets.
Over the past twenty years, both air basins have exceeded the federal 8-h ozone standard between 15 and 75 days each year (CARB). Accurate comparisons of basin-wide trends are complicated by frequent changes to the number and lo-cation of active monitoring sites. Figure 3 shows the 8-h maximum air quality statistic (3 year average of 4th high-est value) for the CARB sites included in this analysis. The trace along the top of the gray area shows the statistic for the entire air basin while the individual sites are identified in the years for which adequate data exists. Before 1992, only the Del Paso and North Highlands sites have data, and these sites suggest a marked reduction in extreme ozone events be-tween 1986 and 1991. Currently Folsom has the highest 8-h average maximum ozone concentrations in the Sacramento Valley region. None of the Mountain Counties sites exam-ined in this analysis was established prior to 1992, yet the region likely had an existing air quality problem by the time routine monitoring at these sites began. Cool and Placerville have the highest 8-h maximum ozone concentrations among the Mountain Counties sites considered. Both air basins and all of the individual sites in the region except T Street and Elk Grove have violated the federal 8-h ozone standard ev-ery year for as long as ozone concentrations have been mon-itored in the region. While the SV air basin seems to have a downward trend in the 8-h air quality statistic, especially in the late 1980s, ozone concentrations in the MC air basin ap-pear to be increasing at some sites. Historical measurements of ozone precursors are not of sufficient abundance of quality to identify the cause of these trends, though rapid growth and
Fig. 3. 8-h maximum air quality statistic (3 year average of 4th
highest value) for the individual sites in (a) the Sacramento Valley and (b) the Mountain Counties. The top of the grey area is the basin-wide statistic of the 4th highest values calculated by finding the highest 8-h maximum each day from any site in the basin.
geographical shifts in population centers likely contribute. Between 1990 and 2000, population growth in the Mountain Counties, Eldorado (25%) and Placer (44%), occurred more rapidly than in Sacramento County (17%), where most of the population growth was concentrated in the eastern suburbs (State of California, 2002). While the boundaries between the air basins do not match perfectly with county boundaries used in demography, this data suggests that NOxlevels rose
more quickly, in a relative sense, in the suburban and rural regions to the east of Sacramento than in the urban center itself.
3 Regional meteorology and transport
A brief description of meteorology and transport is useful in understanding the ozone problem in the region. Exceedances of the ozone standard occur most frequently during the
months of May through October. This time period is defined as summer in the following analysis. During the summer, skies are generally clear, temperatures are high, and precip-itation events are rare. The dominant surface flow within California’s Central Valley is aligned along the major N-S axis of the valley. Much of the flow enters the Valley from the west through the Carquinez Pass and splits to flow from south to north over the Sacramento Valley and from north to south through the San Joaquin Valley (Zaremba and Car-roll, 1999; Zhong et al., 2004). Along the western slope of the Sierra Nevada range, daytime heating generates upslope flow from west to east, while this pattern reverses at night and air drains back down toward the valley floor (Fig. 4). The two flows couple, resulting in overall southwesterly flow of the Sacramento plume during the daytime (Carroll and Dixon, 2002; Dillon et al., 2002). Figure 5 shows local wind direction measurements at the five Sacramento Valley sites and five Mountain Counties sites with meteorological data recorded by CARB and UC Berkeley for the summers of 2000 and 2001. The roses depict the frequency of ob-servation of a wind direction (in 15 degree bins) during the daytime (10:00–18:00) in black and nighttime (22:00–6:00) in grey. Note the narrow range of wind directions at each site. All the sites in the Sacramento Valley have predomi-nantly southwesterly flow during the daytime and southeast-erly flow at night. The local wind directions of the MC sites demonstrate why they are so likely to be influenced by emis-sions from Sacramento. Daytime flow at the mountainous sites is westerly or southwesterly and reverses to flow in al-most exactly the opposite direction at night. Wind speeds are generally twice as fast during the daylight hours. The flow along the Sierra slopes tends to recycle airmasses: air that passed the site two hours before sunset may pass by again three or four hours after sunset if the flow changes by 180◦. In contrast, surface measurements show that flow in the val-ley continually brings air from the south over Sacramento, though periods of stagnation do occur and are often associ-ated with the highest concentrations of ozone in the city.
4 Timing of peak ozone
The ozone concentrations observed at a monitoring site are an integrated quantity determined by the timing and strength of the upwind precursor emissions and the rates of photo-chemistry and transport. Ozone production is initiated by OH radicals, whose concentration profile roughly follows insola-tion and thus maximizes near midday. Emissions of many biogenic VOC precursors to ozone production also peak in midday due to temperature or light-dependent emission rates. Anthropogenic NOxand VOC concentrations in the city are
roughly constant once the daytime boundary layer has been established and morning rush hour emissions are well-mixed. Observed ozone concentrations are the integral of the upwind production and loss and therefore often peak an hour or two
Fig. 4. Predominant meteorological regime that persists in Central
California during the summer months with daytime upslope flow (white arrows) and nighttime downslope flow (black arrows). The dotted outline represents the area of interest shown in Fig. 2.
after noon in areas of efficient photochemical production. The maximum 8-h daily average and the central hour (me-dian time of the eight hour period) of this occurrence were calculated for each site from May-October 1998–2002. The central hour of the 8-h maximum was usually also the hour of the maximum concentration on that day. In the Sacramento Valley, airmasses take roughly two or three hours to move from south to north over the city, and the central hour of the maximum usually occurs at 14:00 or 15:00. For the urban and suburban sites in the Sacramento Valley, the central hour of the 8-h maximum occurs between 13:00 and 16:00 over 95% of the time. Concentrations at Elk Grove tend to peak on the earlier side of that range, which suggests that the pre-cursors required for rapid ozone production are not available upwind of that site. Based on local wind speed and direc-tion, and the timescale of ozone producdirec-tion, “upwind” corre-sponds to at least 15 km southwest of Elk Grove. The other factor controlling the timing of peak ozone at urban sites is rush hour emissions of nitric oxide, which titrate ozone lo-cally in the early morning and evening. Even on days where rapid photochemical ozone production does not occur, max-imum ozone is observed during midday because the higher boundary layer and a respite from rush hour traffic reduce the effects of titration from local NO sources via (R1). The effects of ozone titration by NO emissions will be discussed further in Sect. 7.
In contrast to the timing of the ozone maxima in the SV sites, which are consistent with efficient local production, the central hour of the 8-h maximum at the Mountain Coun-ties sites occurs later and with greater variability. The tim-ing of the ozone peak at these sites is governed by transport and depends on the site’s proximity to the urban source of
Fig. 5. Wind roses depicting the frequency of observed daytime (10:00–18:00, black) and nighttime (22:00–6:00, grey) wind direction (rings
are spaced by 5% with the outer ring representing 30% of the observations. (a–e) are sites in the Sacramento Valley and (f–i) are sites in the Mountain Counties.
precursors. While peak concentrations of OH and biogenic VOC emissions likely occur close to noon, the NOxand
an-thropogenic VOC involved in ozone production are not avail-able until upslope flow delivers urban emissions to the re-gion. The concentration and timing of maximum ozone at the rural sites suggests that ozone is produced both in Sacra-mento and in the urban plume as it is advected through the Mountain Counties. At the most remote sites, UC-BFRS and White Cloud, the diurnal cycle in ozone is less pronounced than near the city, and peak values typically occurs in the late afternoon (15:00–20:00). This timing is consistent with the transit time of the urban plume, corroborated by measure-ments of CO, nitrogen oxides, and anthropogenic VOC at the UC-BFRS (Lamanna and Goldstein, 1999; Bauer et al., 2000; Dillon et al., 2002; Day, 2003). Days on which peak ozone concentrations occur in the early morning hours can be roughly equated with days when the urban plume does not reach the site later that day. The peak values observed dur-ing early morndur-ing are much lower than those that occur in the late afternoon. For White Cloud and the UC-BFRS, the urban plume arrives on more than 80% of the days from May to October. Thus improvements to air quality in the Sacra-mento Valley and Mountain Counties are likely to require controls on the emissions of urban precursors to ozone pro-duction. The Mountain Counties will not be able to achieve significant improvements in its own air quality through local emission reductions alone because the impact of the upwind Sacramento sources is so dominant.
5 The weekend effect in the Sacramento region
Because monitoring sites are predominantly located in pop-ulous areas where primary pollutants and human exposure to them is maximized, most discussion of the weekend ef-fect relates to high NOxenvironments with less attention
fo-cused on regions downwind. Many different metrics have been used to assess ozone and a “weekend effect” can depend on which data are chosen for analysis. Because ozone is a secondary pollutant that is relatively long-lived compared to its precursors, and because frequency distributions of ozone have a tail at high concentrations that is particularly impor-tant in regulatory contexts, averages often mask imporimpor-tant features. Research has generally identified a weekend ef-fect more readily when focusing solely on high percentiles, exceedance events or anything that concentrates on the ex-tremes (Cleveland et al., 1974). We focus on the maximum 8-h average as a policy-relevant quantity that has been shown to have weekday-weekend differences in a variety of photo-chemical environments (Heuss et al., 2003).
Using archived hourly ozone measurements during the summers of 1998–2002 from the twelve sites listed above, and attributing data between midnight and 7 am to ozone production from the previous day (a necessary considera-tion only at the remote sites), the maximum 8-h average ozone concentration was found for each day. The frequency of exceeding the federal 8-h air quality standard for ozone was then calculated separately for weekdays and weekends. Compared to the rural sites, most urban sites have a lower rate of exceeding the federal eight hour ozone standard and are more likely to do so on the weekend (Fig. 6). Folsom and Cool seem to be ideally located to experience prolonged
Fig. 6. Percent of days on weekends (Sat–Sun) or weekdays (Mon–
Fri) for which a particular site exceeded the federal 8-h ozone stan-dard for May–October 1998–2002. The six sites on the left are located in the SV while the six sites on the right are in the MC.
periods of high ozone concentrations, suggesting that they sit within or downwind of regions in which ozone is efficiently produced. The sign of the weekend effect changes near the interface between the two air basins. The six MC sites all have improved air quality on the weekends, but in general they are more likely to exceed the ozone standard than any of the urban sites. Local wind observations at Jackson suggest that it is not impacted by Sacramento emissions under nor-mal flow patterns but may receives anthropogenic emissions from the Interstate 5 corridor and possibly Stockton (2003, pop. 270 000) about 50 km to the west.
6 Day-of-week trends in O3, NOxand VOC
It is instructive to separate data from each day of the week to learn how the contributing effects of emissions, and sub-sequent production, transport, and losses play out in influ-encing the trends. Day-of-week averages for the summers of 1998–2002 are calculated for 8-h maximum ozone, and for daytime NOxand VOC concentrations, the precursors to
photochemical ozone formation. Figure 7a shows that max-imum 8-h O3concentrations at sites in the Sacramento
Val-ley are about 2–5 ppb higher on Sat-Sun compared to week-days. In contrast, sites in the Mountain Counties, Fig. 7b, have the lowest 8-h O3concentrations on Sunday and
gener-ally increase throughout the week. Data obtained at Big Hill during the summer of 2003 are also included in this figure; along with three other sites it has lower ozone on Saturday than Friday. The importance of transport and the buildup of pollution is evident in the timing of the cycles, as most sites have lower ozone on Monday than on Saturday. However, the variations in average ozone between different days of the week are smaller than the 95% confidence interval of any sin-gle day. The MC sites all have concentrations closer to the
Fig. 7. Day-of-week pattern in the maximum 8-h O3average in the (a) Sacramento Valley and (b) Mountain Counties. The uncertainty
in any average 8 h maximum point, is represented by the 95% con-fidence interval and shown only for T Street for the sake of clarity. The 95% CI for all of the points at all of the sites in Figs. 7a and b ranged between 2 and 3.5 ppb.
federal standard and thus deviations from average behavior are more likely to result in exceedances.
The main difference in NOx emissions by day of week
is most evident in the concentrations observed during early morning hours, but for the purpose of ozone production, it is the abundance of NOxduring the daytime hours that is
criti-cal. Thus for Sacramento Valley sites, Fig. 8a compares the mean NOxconcentrations between 10:00 and 18:00, a time
period when photochemical activity is high and the bound-ary layer is well-developed. The California Air Resources Board does not monitor NOx at any sites in the Mountain
Counties so we rely on measurements of NO2, organic
ni-trates, and HNO3made by UC Berkeley using TD-LIF
in-struments at UC-BFRS in the summer of 2001 and at Big Hill in the summer of 2003 to give an indication of day-of-week behavior in this region. Over a timescale of minutes to hours, nitrogen oxides are photochemically processed into more oxidized reactive nitrogen species (NOz ≡peroxy
ni-trates + alkyl nini-trates + HNO3+ . . . ). The sum of all
Fig. 8. Day of week pattern in the NOxconcentration for the time
period of maximum ozone: (a) mean NOxbetween 10:00 and 18:00
in the Sacramento Valley, symbols as in Fig. 7a and also including Granite Bay (✄), (b) mean NOx(open symbols) and NOy(filled
symbols) between 12:00 and 20:00, while the urban plume is influ-encing the rural sites of UC-BFRS (✁) and Big Hill (✄). Error bars represent the 95% confidence interval.
conserved species in the atmosphere than NOxalone. NO is
less significant at rural sites and is estimated here by assum-ing photostationary state described in (R1)–(R3) and usassum-ing measurements of NO2and TUV estimates of JNO2 (Cleary et al., 2007). Figure 8b shows the concentrations of both NOxand NOyat two sites in the Mountain Counties between
12:00–20:00, when ozone peaks.
Measurements of NOxare made by the California Air
Re-sources Board using the TECO 42C instrument, which passes air over a heated catalyst that converts reactive nitrogen com-pounds to NO, which is subsequently detected using chemi-luminescence. This molybdenum oxide catalyst used in these instruments is known to have a positive response to organic nitrates and nitric acid in the temperature range in which it is operated (Winer et al., 1974; Fitz, 2002), however the inlets on these instruments are not configured to sample HNO3
ef-fectively. The NO2concentration reported by this
measure-ment technique is therefore likely to be biased high by the
presence of organic nitrates. The extent to which the NOx
concentrations are overestimated depends on the relative im-portance of NOzto total nitrogen oxides. In urban areas like
the Sacramento Valley, where recent emissions of NO domi-nate, the positive interference is less important than in highly processed airmasses. Measurements of organic nitrates by TD-LIF at the UC Berkeley site of Granite Bay from July-September of 2001 (Cleary et al., 2005) suggest the positive bias would be less than 30% of NOx, even for a 100%
con-version efficiency of organic nitrates to NO by the catalyst. Figure 8a shows the weekly cycle in mean daytime NOx
concentrations at sites in the Sacramento Valley for the sum-mers of 1998–2002. Roseville is located within 200 m of Interstate 80 while the T Street site is in the downtown core and less than 400 m north of Highway 50. The NOx
observa-tions at these sites likely represent the high end of the range of NOx concentrations present in the boundary layer over
Sacramento. Lower weekend emissions result in substan-tially reduced concentrations, and average concentrations in-crease from Monday through Friday. While individual sites are located within varying proximities to emission sources, it appears that NOxincreases at the sites in parallel by roughly
0.4 ppb/day throughout the week. This suggests that NOx
is building up in the city during the week and/or that the city receives air from an upwind source that also has NOx
building up during the week. Similarly, the concentrations observed on Saturday are 25% higher than those observed on Sunday. Although it is unclear to what extent that re-flects different emissions versus different initial conditions, it can be expected that carryover from Friday is an impor-tant factor. Traffic counts and fuel-dependent emission fac-tors have been used to estimate the day-of-week cycle in mo-bile source NOxemissions in Central California (Marr and
Harley, 2002a; Harley et al., 2005). These estimates indicate that emission patterns are similar Monday through Thursday, with additional late night emissions on Friday. There is a significant decrease in heavy duty diesel traffic on weekends, and total NOx emissions on Sunday are slightly lower than
Saturday.
The absolute abundance of NOy and NOx at Mountain
Counties sites (Fig. 8b) is much lower than in the Sacra-mento Valley but the weekend/weekday NOxratio of about
65% persists throughout the region. The rural sites do not have the same trend of increasing NOxthroughout the week that the urban sites do, but the MC datasets only encompass one year of data each and synoptic scale transport patterns may mask a more general pattern of increases that might be evident if additional data were available. The rural sites have lower NOxconcentrations on Sundays than on Saturdays,
in-dicating lower emission and/or regional carryover of emis-sions from the previous day. These day-of-week trends con-firm that increased traffic to recreational areas in the Sierra Nevada on the weekend does not dominate the NOxpattern
observed at the rural sites during times of maximum ozone. It is consistent with observations at UC-BFRS that sources
Fig. 9. Daytime NMHC measurements (ppb C) during the summers
of 2001–2003 at three sites in the Sacramento Valley.
in the Sacramento Valley contribute significantly to NOx
ob-served downwind in the Mountain Counties sites throughout the week. Figures 7a and 8a show that higher ozone on the weekend in urban areas occurs when NOxconcentrations are
lower. Figures 7b and 8b demonstrate that in rural airmasses with less NOx, the weekend effect in ozone changes sign, and
fewer exceedances occur on weekends in rural areas down-wind of major NOxsources.
Other studies in this region and in other urban areas have shown a similar decrease in NOx concentrations on
week-ends (∼35%) with a smaller decrease in the abundance of the VOC precursors to ozone production (Marr and Harley, 2002b; Blanchard and Tanenbaum, 2003). CARB monitors non-methane hydrocarbons (NMHC) at three Sacramento Valley sites using a TECO 55 hydrocarbon analyzer that re-ports a mixing ratio of total C in NMHC. Figure 9 shows that as air moves from south to north and east over Sacra-mento (from Elk Grove to Del Paso to Folsom), the daytime concentration of NMHC increases by roughly a factor of two, due likely to both accumulating anthropogenic emissions and biogenic emissions, especially from the oak belt on the east-ern perimeter of the city. Assessment of the change in ozone production rate due to changes in peroxy radical precursors would require identification and quantification of the individ-ual compounds since the rate at which VOC are oxidized to RO2(k3) varies by orders of magnitude between species.
Speciated measurements of the VOC that contribute strongly to ozone production were made simultaneously at Granite Bay and the UC-BFRS from July–September 2001. A detailed list of VOC measured at Granite Bay can be found in Rubin et al. (2006). While the VOCs measured at the sites include a wide variety of both biogenic and anthropogenic compounds, some species that were not measured may make a non-negligible contribution to the reactivity in the airmass. Formaldehyde is likely the most important contributor to re-activity that was not included in the measurements, but its main source in the region is isoprene degradation and thus it
Fig. 10. Measurements of the hydrocarbon reactivity in summer
2001 (10:00–18:00) derived from the sum of all VOC measured plus CO (top panel), and the anthropogenic hydrocarbons only (bottom panel) at (a) Granite Bay and (b) UC-BFRS.
is not expected to have a strong day-of-week pattern. Car-bon monoxide was measured by gas chromatography at UC-BFRS during this time period and is considered as part of the reactivity with OH. No CO measurements were made at Granite Bay, therefore measurements from the Del Paso site were used. CO and NOxhave a common vehicular source in
this urban area, and based on the observation that NOxat Del
Paso is about twice as high as NOxat Granite Bay, this likely
leads to a slight overestimate of CO, but its contribution to reactivity should represent the same day-of-week pattern as other anthropogenic contributions to reactivity not measured at the site. CO contributes roughly 20% to the reactivity with OH at both the suburban and rural sites. Figure 10 shows the daytime OH reactivity (6k3[VOC+CO]) from the sum
of VOC measured by GC and separately, the reactivity from a suite of VOC known to have only anthropogenic sources (not including CO). At both sites, the reactivity from an-thropogenic compounds is lowest on the weekend, reflecting lower emissions. Because the weekend reduction in diesel traffic is less important for VOC emissions and because of
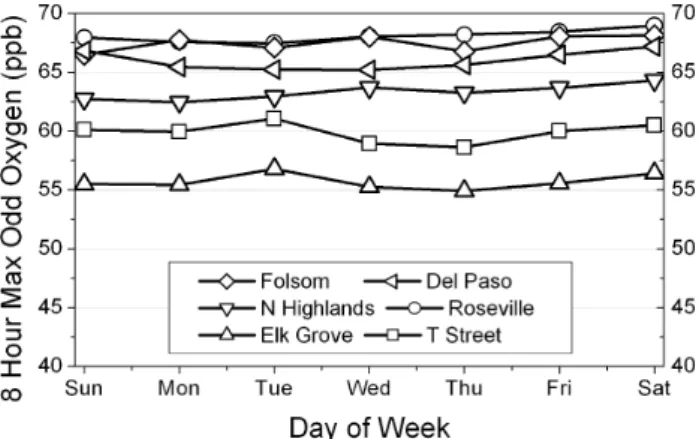
Fig. 11. Day-of-week pattern in the maximum 8-h average odd
oxy-gen in the Sacramento Valley (for comparison with ozone data in Fig. 7a). The 95% CI (not shown) ranged between 2.5 and 4 ppb for all of the sites.
the importance of biogenic VOC at the two sites, VOC re-activity changes by less than 10% between weekdays and weekends at both the urban and rural sites, a much smaller change than for NOx. VOC at the UC-BFRS are dominated
by biogenic sources, which have no known day-of-week de-pendence in emissions, thus the lower concentrations dur-ing the week likely reflect more rapid photochemical loss, a subject explored further in the companion paper (Murphy et al., 2007b). The observational data presented in this section show that concentrations of ozone precursors are not higher on the weekend for the Sacramento Valley and Mountain Counties Air Basins, thereby disproving hypothesis (#2).
Total VOC reactivity is similar (within 30%) at the urban and rural sites, likely because the anthropogenic urban emis-sions that are diluted and lost during transport have been re-placed by biogenic emissions as the plume is advected up-slope. With reference to Fig. 1, this means that a single VOC reactivity curve is qualitatively appropriate to consider O3production as NOxvaries between Granite Bay and the
UC-BFRS. However, between the Sacramento suburbs and the mid-elevation pine forests, there is a significant source of isoprene, which may increase the VOC reactivity at interme-diate distances. As shown in Fig. 1, the production of O3is
relatively insensitive to changes in VOC reactivity at the low NOxconcentrations encountered in rural areas so this should
not have a large effect on regional ozone.
7 Differences in odd oxygen partitioning
Because of the chemistry described in (R1)–(R4), it is im-portant to separate the effects of interconversion from differ-ences in ozone production rates. By defining odd oxygen as the sum of ozone and nitrogen dioxide (Ox≡O3+NO2), we
can isolate changes in production from differences in parti-tioning under changing NOxregimes. Figure 11 shows the
day-of-week pattern for total odd oxygen at Sacramento Val-ley sites. The urban sites no longer have significantly higher maximum 8-h averages on the weekends. The geographic pattern becomes more clear: as the air moves from south to north over the city, emissions of NO are photochemically processed by reaction with O3 and RO2 into odd oxygen.
Thus the sites in the northeast part of the Sacramento ur-ban area have higher odd oxygen because the emissions of NOxand VOC from the city have had more time to be
pro-cessed. The different day-of-week behavior between ozone and odd oxygen suggests that in the Sacramento region, vary-ing degrees of interconversion of ozone to NO2 by mobile
source emissions of NOxmakes an important contribution to
the weekend effect.
The counterpart to Fig. 11 could not be made for the Mountain Counties due to the lack of routine NOx
measure-ments in that region. NO2at these rural sites is likely to be
quite small compared to ozone, and is unlikely to have a large influence on odd oxygen patterns. If the day-of-week trends observed at the UC-BFRS and Big Hill hold throughout the region, the combination of lower NO2 and lower ozone on
the weekend would result in total odd oxygen minimizing on weekends. This pattern of low O3 associated with low
NOxis consistent with the majority of ozone observed in the
region being produced under NOx-limited conditions.
How-ever, the interconversion of odd oxygen by fresh NOx
emis-sions may still influence ozone observations at sites in the Mountain Counties. With reference to Fig. 2, Colfax and Placerville are closer to the region of efficient ozone produc-tion than the respective downwind sites of White Cloud and the UC-BFRS, but the 8-h maximum ozone at the closer sites is actually lower by a few ppb for each pair. Because the Col-fax and Placerville monitoring sites are located within 300 m of Interstate 80 and Highway 50 respectively, it is likely that NO2makes a more significant contribution to odd oxygen at
those sites. This suggests that monitoring sites located near major transportation routes are potentially underestimating the regional abundance of ozone, and should include NO2
measurements in order to capture the true concentration of odd oxygen and guide policy decisions. It should be empha-sized that the effect of ozone suppression by NO emissions, while most evident during morning rush hour, is important throughout the day. Lower ozone concentrations can be seen throughout the day in airmasses that were likely not influ-enced by urban emissions during the morning rush hour. The timescale of ozone production by (R4a) is hours, whereas the timescale of suppression by (R1) is minutes. A significant proportion of the NO observed at urban (or even rural) sites located in close proximity to a major road has had time to suppress the ozone but not to affect its production. Therefore the influence of lower weekend NO emissions on ozone pro-duction rates can best be assessed by examining the behavior of odd oxygen throughout the day. This analysis shows that the suppression of ozone by NO emissions (hypothesis #1) is an important factor in the weekend effect in ozone at urban
sites in the Sacramento Valley. It likely has an influence on the regional scale as well, and NO2 measurements at sites
in the Mountain Counties located close to highways are re-quired to quantify the effect.
8 The role of aerosols in the ozone weekend effect
Marr and Harley (2002a, b) proposed that reduced concen-trations of aerosol on weekends may increase ozone produc-tion by increasing the availability of UV photons required to initiate HOxproduction. Aerosols interact with radiation
through both absorption and scattering processes. The ab-sorption of UV radiation by aerosols acts to reduce the avail-able number of photons, however scattering aerosol may de-crease the photon flux below the aerosol layer while increas-ing it above. Therefore the effect of aerosols on the availabil-ity of UV radiation may be altitude dependent, but the over-all effect throughout the column will be negative for absorb-ing aerosols. Accurate size distributions and sabsorb-ingle scatterabsorb-ing albedo of the aerosol burden are needed for rigorous calcu-lations of their impact on photolysis frequencies (Wendisch et al., 1996). In a modeling simulation of the 1987 South-ern California Air Quality Study, Jacobson (1998) found that the effect of aerosols on photolysis frequencies depended on the relative importance of scattering and absorption. Qin et al. (2004) found that during a study of the South Coast Air Basin, scattering by PM10aerosol was between 9–17% lower
on the weekend, but no measurements of absorption or the net effect on UV irradiance were made at any altitude.
To properly address the role of aerosols, direct mea-surements of the day-of-week trends in the wavelength-dependent light absorption and scattering of atmospheric aerosol are necessary, but such detailed measurements are rarely available. In the Sacramento region, summer daytime measurements of PM10 at the Del Paso and T Street
moni-toring sites (2001–2003) show a day-of-week pattern, with Sunday concentrations almost 30% lower than later week-days (Fig. 12). However, simultaneous observations of light-scattering at Del Paso, in the lower panel, show no signif-icant day-of-week trend. Because radiation effects depend on aerosol size and composition, more specific measure-ments of aerosol characteristics, or of UV radiation itself, are needed to quantify the importance of the effect. Jacobson (1998) found that a simulation of a multi-day ozone episode in Southern California that did not include aerosols predicted surface ozone concentrations which were 5–8% higher than a model run with aerosols. This suggests that a reduction in PM10 of less than 30% will likely affect surface ozone by
less than 5%. More detailed measurements of aerosol char-acteristics are required to quantify the influence of aerosol on ozone production and its role in the weekend effect.
Fig. 12. Aerosol concentrations (µg/m3) of PM10measured at the
Del Paso and T Street monitoring sites in the Sacramento Valley. The bottom panel shows simultaneous measurements of light scat-tering (back scatter ratio) at the Del Paso site.
9 Conclusions
Day-of-week patterns in observations of ozone and its pre-cursors at twelve sites within and downwind of the Sacra-mento metropolitan area from the summers of 1998–2002 have been investigated. The analysis shows that all six sites in the Sacramento Valley air basin exceed the 8-h standard more frequently on the weekend than on weekdays, whereas all six sites in the more rural Mountain Counties have worse air quality on weekdays. While previous work has identi-fied higher weekend ozone concentrations in urban areas, and lower weekend ozone in some rural areas, this is the first analysis to use a well-characterized urban plume to fol-low the weekend effect in ozone over sites that differ in NOx
abundance by an order of magnitude. At the same time, spe-ciated measurements of VOC and CO at a suburban and ru-ral site demonstrate that the reactivity toward OH changes by less than 30% throughout the urban plume and by less than 10% between weekdays and weekend at both sites. Observa-tions of NOxand anthropogenic VOC confirm that emissions
of the dominant anthropogenic precursors to ozone produc-tion are not higher on the weekend (negating hypothesis #2). The important role that biogenic emissions play in the region means that the total VOC reactivity with OH has a negligi-ble (<10%) day-of-week pattern in both counties. Higher weekend biogenic VOC at the UC-BFRS suggests that the oxidation rate of these VOC is slower on the weekend. Ob-servations of PM10at two urban monitoring sites showed that
lower weekend concentrations could not be directly related to an increase in photolysis frequencies for ozone-forming reactions (hypothesis #3). More detailed measurements are required to quantify the role aerosols play in the weekend effect of ozone.
We also show that titration by NO emissions can be an im-portant control over the weekend effect in ozone, not only at rush hour, but throughout the day (hypothesis #1). The analysis reveals that sites located within several hundred me-ters of transportation routes will have significantly depressed ozone concentrations, leading to underestimates of the aver-age regional abundance, if the O3concentrations are
extrapo-lated without detailed consideration of the NO2that is
simul-taneously present. Furthermore, monitoring stations that are near to NO sources are influenced by chemistry occurring on temporal and spatial scales much finer than the resolution of gridded models used to represent atmospheric photochem-istry, and thus should be used with care when comparisons are made.
Because fresh NOxemissions continue throughout the day
in the Sacramento region, it was necessary to examine the patterns in total odd oxygen at the sites in the Sacramento Valley. By comparing day-of-week patterns in odd oxygen to those in ozone, we showed that titration by NO is the main source of a weekend effect in ozone at the urban and subur-ban sites. Titration at CARB sites in the Mountain Counties is difficult to assess in the absence of NOxmeasurements, but
clearly does not dominate the day-of-week trends because it would produce the opposite behavior to that observed.
Acknowledgements. The analysis presented here was primarily
supported by NSF ATM-0138669. We gratefully acknowledge that support and the U.S. Department of Energy support for measurements at Granite Bay under contract AC03-76SF0009. Observations at UC-BFRS were supported by NSF ATM-0138669 (Cohen) and ATM-0443448 (Goldstein). We thank Megan McKay and Gunnar Schade for assistance with meteorological, ozone, and VOC data from UC-BFRS. Measurements at Big Hill were made in collaboration with the California Air Resources Board under Contract No. 01-327. We are grateful to the Eureka Union School District, Sierra Pacific Industries, and the United States Forest Service for the use of the sites.
Edited by: P. Monks
References
D. o. Finance: Revised Historical City, County and State Popula-tion Estimates, 1991–2000, with 1990 and 2000 Census Counts., State of California, 2002.
Altshuler, S. L., Arcado, T. D., and Lawson, D. R.: Weekday vs weekend ambient ozone concentrations - discussion and hy-potheses with focus on Northern California, J. Air Waste Man-age., 45, 967–972, 1995.
Ashworth, J. R.: The influence of smoke and hot gases from factory chimneys on rainfall, Q. J. Roy. Meteor. Soc., 55, 841–850, 1929. Bauer, M. R., Hultman, N. E., Panek, J. A., and Goldstein, A. H.: Ozone deposition to a ponderosa pine plantation in the Sierra Nevada Mountains (CA): A comparison of two differ-ent climatic years, J. Geophys. Res., 105(D17), 22 123–22 136, doi:10.1029/2000JD900168, 2000.
Beirle, S., Platt, U., Wenig, M., and Wagner, T.: Weekly cycle of NO2by GOME measurements: a signature of anthropogenic
sources, Atmos. Chem. Phys., 3, 2225–2232, 2003, http://www.atmos-chem-phys.net/3/2225/2003/.
Blanchard, C. L. and Fairley, D.: Spatial mapping of VOC and NOx-limitation of ozone formation in central California, Atmos.
Environ., 35, 3861–3873, 2001.
Blanchard, C. L. and Tanenbaum, S. J.: Differences between week-day and weekend air pollutant levels in southern California, J. Air Waste Manage., 53, 816–828, 2003.
Bronnimann, S. and Neu, U.: Weekend-weekday differences of near-surface ozone concentrations in Switzerland for different meteorological conditions, Atmos. Environ., 31, 1127–1135, 1997.
California Air Resources Board: The Ozone Weekend Effect in Cal-ifornia, CARB Planning and Technical Support Division, Sacra-mento, 2003.
California Air Resources Board Air Quality Database: www.arb.ca. gov/aqd/aqdpage.
Carroll, J. J. and Dixon, A. J.: Regional scale transport over com-plex terrain, a case study: tracing the Sacramento plume in the Sierra Nevada of California, Atmos. Environ., 36, 3745–3758, 2002.
Cleary, P. A., Wooldridge, P. J., and Cohen, R. C.: Laser-induced fluorescence detection of atmospheric NO2with a commercial
diode laser and a supersonic expansion, Appl. Opt., 41, 6950– 6956, 2002.
Cleary, P. A., Murphy, J. G., Wooldridge, P. J., Day, D. A., Millet, D. B., Goldstein, A. H., and Cohen, R. C.: Observations of total alkyl nitrates within the Sacramento urban plume, Atmos. Chem. Phys. Discuss., 5, 4801–4843, 2005,
http://www.atmos-chem-phys-discuss.net/5/4801/2005/. Cleary, P. A., Wooldridge, P. J., Millet, D. B., McKay, M.,
Gold-stein, A. H., and Cohen, R. C.: Observations of total peroxy ni-trates and aldehydes: measurement interpretation and inference of OH radical concentrations, Atmos. Chem. Phys., 7, 1947– 1960, 2007,
http://www.atmos-chem-phys.net/7/1947/2007/.
Cleveland, W. S., Graedel, T. E., Kleiner, B., and Warner, J. L.: Sunday And workday variations in photochemical air pollutants in New-Jersey and New-York, Science, 186, 1037–1038, 1974. Cleveland, W. S. and McRae, J. E.: Weekday-weekend ozone
con-centrations in Northeast United-States, Environ. Sci. Technol., 12, 558–563, 1978.
Day, D. A., Wooldridge, P. J., Dillon, M. B., Thornton, J. A., and Cohen, R. C.: A thermal dissociation laser-induced fluo-rescence instrument for in situ detection of NO2, peroxy
ni-trates, alkyl nini-trates, and HNO3, J. Geophys. Res., 107(D6),
doi:10.1029/2001JD000779, 2002.
Day, D. A.: Observations of NO2, total peroxynitrates, total alkyl
nitrates, and HNO3 in the mid-Sierras and Sacramento plume using Thermal Dissociation – Laser Induced Fluorescence, Uni-versity of California, 207 pp., 2003.
Dillon, M. B., Lamanna, M. S., Schade, G. W., Goldstein, A. H., and Cohen, R. C.: Chemical evolution of the Sacramento ur-ban plume: Transport and oxidation, J. Geophys. Res., 107(D5), 4045, doi:10.1029/2001JD000969, 2002.
Elkus, B. and Wilson, K. R.: Photochemical air pollution – Week-end weekday differences, Atmos. Environ., 11, 509–515, 1977.
Fitz, D. R.: Evaluation of NOyand Nitric Acid Measurement
Meth-ods and Collection of Ambient Data, California Air Resources Board, 2002.
Fujita, E. M., Stockwell, W. R., Campbell, D. E., Keislar, R. E., and Lawson, D. R.: Evolution of the magnitude and spatial extent of the weekend ozone effect in California’s South Coast Air Basin, 1981–2000, J. Air Waste Manage., 53, 802–815, 2003.
Gordon, A. H.: Weekdays Warmer Than Weekends, Nature, 367, 325–326, 1994.
Harley, R. A., Marr, L. C., Lehner, J. K., and Giddings, S. N.: Changes in motor vehicle emissions on diurnal to decadal time scales and effects on atmospheric composition, Environ. Sci. Technol., 39, 5356–362, 2005.
Heard, D. E. and Pilling, M. J.: Measurement of OH and HO2in
the troposphere, Chem. Rev., 103, 5163–5198, 2003.
Heuss, J. M., Kahlbaum, D. F., and Wolff, G. T.: Weekday/weekend ozone differences: What can we learn from them?, J. Air Waste Manage., 53, 772–788, 2003.
Husar, R. B.: Seasonal and Weekly Pattern of Ozone over the OTAG Region, paper presented at Air and Waste Management Associa-tion’s 90th Annual Meeting & Exhibition, Abstr.-No.: 98-A942, 1998.
Jacobson, J. S.: Comparison of Weekend-Weekday Ozone and Hy-drocarbon Concentrations in Baltimore-Washington Metropoli-tan Area, Atmos. Environ., 9, 1040–1040, 1975.
Jacobson, M. Z.: Studying the effects of aerosols on vertical pho-tolysis rate coefficient and temperature profiles over an urban air-shed, J. Geophys. Res., 103, 10 593–10 604, 1998.
Jimenez, P., Parra, R., Gasso, S., and Baldasano, J. M.: Modeling the ozone weekend effect in very complex terrains: a case study in the Northeastern Iberian Peninsula, Atmos. Environ., 39, 429– 444, 2005.
Karl, T. R.: Day of Week Variations of Photo-Chemical Pollutants in St-Louis Area, Atmos. Environ., 12, 1657–1667, 1978. Lamanna, M. S. and Goldstein, A. H.: In situ measurements of
C2-C10volatile organic compounds above a Sierra Nevada
pon-derosa pine plantation, J. Geophys. Res., 104(D17), 21 247– 21 262, doi:10.1029/1999JD900289, 1999.
Marr, L. C. and Harley, R. A.: Modeling the effect of weekday-weekend differences in motor vehicle emissions on photochemi-cal air pollution in central California, Environ. Sci. Technol., 36, 4099–4106, 2002a.
Marr, L. C. and Harley, R. A.: Spectral analysis of weekday-weekend differences in ambient ozone, nitrogen oxide, and non-methane hydrocarbon time series in California, Atmos. Environ., 36, 2327–2335, 2002b.
National Research Council: Air Quality Management in the United States, The National Academies Press, 2004.
Paschalidou, A. K. and Kassomenos, P. A.: Comparison of air pollutant concentrations between weekdays and weekends in Athens, Greece for various meteorological conditions, Environ. Technol., 25, 1241–1255, 2004.
Pont, V. and Fontan, J.: Comparison between weekend and week-day ozone concentration in large cities in France, Atmos. Envi-ron., 35, 1527–1535, 2001.
Pryor, S. C. and Steyn, D. G.: Hebdomadal and Diurnal Cycles in Ozone Time-Series From the Lower Fraser Valley, BC, Atmos. Environ., 29, 1007–1019, 1995.
Pun, B. K., Seigneur, C., and White, W.: Day-of-week behavior of atmospheric ozone in three US cities, J. Air Waste Manage., 53, 789–801, 2003.
Qin, Y., Tonnesen, G. S.. and Wang, Z.: Weekend/weekday dif-ferences of ozone, NOx, CO, VOCs, PM10and the light scatter
during ozone season in southern California, Atmos. Environ., 38, 3069–3087, 2004.
Rubin, J. I., Kean, A. J., Harley, R. A., Millet, D. B., and Gold-stein, A. H.: Temperature dependence of volatile organic com-pound evaporative emissions from motor vehicles, J. Geophys. Res., D03305, doi:10.1029/2005JD006458, 2006.
Sillman, S.: The Use Of NOy, H2O2, and HNO3as indicators for
ozone-NOx-hydrocarbon sensitivity in urban locations, J.
Geo-phys. Res., 100, 14 175–14 188, 1995.
Vukovich, F. M.: The spatial variation of the weekday/weekend dif-ferences in the Baltimore area, J. Air Waste Manage., 50, 2067– 2072, 2000.
Vukovich, F. M. and Scarborough, J.: 15-year simulation of ozone in Baltimore using SIPM, Atmos. Environ., 38, 4825–4837, 2004.
Wendisch, M., Mertes, S., Ruggaber, A., and Nakajima, T.: Vertical profiles of aerosol and radiation and the influence of a tempera-ture inversion: Measurements and radiative transfer calculations, J. Appl. Meteorol., 35, 1703–1715, 1996.
Winer, A. M., Peters, J. W., Smith, J. P., and Pitts, J. N.: Re-sponse Of Commercial Chemiluminescent NO-NO2Analyzers
To Other Nitrogen-Containing Compounds, Environ. Sci. Tech-nol., 8, 1118–1121, 1974.
Yarwood, G., Stoeckenius, T. E., Heiken, J. G., and Dunker, A. M.: Modeling weekday/weekend Los Angeles region for 1997, J. Air Waste Manage., 53, 864–875, 2003.
Zaremba, L. L. and Carroll, J. J.: Summer wind flow regimes over the Sacramento Valley, J. Appl. Meteorol., 38, 1463–1473, 1999. Zhong, S. Y., Whiteman, C. D., and Bian, X. D.: Diurnal evolution of three-dimensional wind and temperature structure in Califor-nia’s Central Valley, J. Appl. Meteorol., 43, 1679–1699, 2004.
![Figure 1 shows the qualitative behavior of the ozone pro- pro-duction rate over a wide range of NO x concentrations and at three different VOC reactivities (≡6k 3 [VOC])](https://thumb-eu.123doks.com/thumbv2/123doknet/14775910.593716/4.892.467.817.93.317/figure-shows-qualitative-behavior-duction-concentrations-different-reactivities.webp)