HAL Id: hal-02933135
https://hal.univ-lorraine.fr/hal-02933135
Submitted on 7 Jan 2021
HAL is a multi-disciplinary open access
archive for the deposit and dissemination of
sci-entific research documents, whether they are
pub-lished or not. The documents may come from
teaching and research institutions in France or
abroad, or from public or private research centers.
L’archive ouverte pluridisciplinaire HAL, est
destinée au dépôt et à la diffusion de documents
scientifiques de niveau recherche, publiés ou non,
émanant des établissements d’enseignement et de
recherche français ou étrangers, des laboratoires
publics ou privés.
To cite this version:
Fenna Bergmann, Tilmann Schwenk, Volkhard Spiess, Christian France-lanord. Middle to Late
Pleis-tocene Architecture and Stratigraphy of the Lower Bengal Fan-Integrating Multichannel Seismic Data
and IODP Expedition 354 Results. Geochemistry, Geophysics, Geosystems, AGU and the
Geochemi-cal Society, 2020, 21 (1), pp.e2019GC008702. �10.1029/2019GC008702�. �hal-02933135�
every ~15 kyr independent from sea‐level changes. The CLSs are embedded in sheeted sediments deposited out of unchannelized turbidity currents, which represent almost two thirds of the lower Bengal Fan sediments. On 100‐kyr timescales, CLSs and sheeted/unchannelized sediments build up subfans, which alternately occupied the western and the eastern Bengal Fan, while the remaining area was draped by ~10 to 20 m‐thick layers of background/hemipelagic sediments. Three subfans have been reconstructed: Subfan B (1.24–0.68 Ma) formed concurrently with the Middle Pleistocene Hemipelagic Layer, Subfan C (0.68–0.25 Ma) covered the entire study area, and Subfan D (0.25 Ma to recent) deposited concomitant with the Late Pleistocene Hemipelagic Layer. The continuous succession of subfans indicates an uninterrupted fan activity independent from sea‐level cycles at least since the Middle Pleistocene. This remarkable independent behavior in terms of sediment supply has not been observed at the Amazon Fan but is in agreement with observations from the Congo Fan. Finally, the analysis of a complete cross section through the lower Bengal Fan reveals that almost half of the sediment represents sands, indicating that the lower Bengal Fan may not generally be classified as “mud rich” (≤30% sand).
Plain Language Summary
The northern Indian Ocean receives large amounts of material eroded by wind and rain onshore. Most of the sediment comes from the Himalayan mountain range and contains important information about the evolution of the Himalaya as well as the past Asian climate. After erosion, it is transported by large rivers, such as the Ganges and Brahmaputra, to the coast. Underwater, the sediment moves even farther southwards within river‐like features, the so‐called channel‐levee systems. Eventually, the material is deposited within the submarine Bengal Fan, a large sediment body covering most parts of the Bay of Bengal. In this study, we combine the results of a large underwater drilling campaign (IODP Expedition 354) with acoustic images of the subsurface from the lower Bengal Fan in order to develop a profound understanding of the timing and location of channel‐levee activity and sediment deposition. This knowledge will eventually help scientists to understand the past climate in the Himalaya region. We show that the location of sediment deposition is highly variable and can move more than 100 km laterally. These variations are investigated in detail for the last 1 million years.1. Introduction
The Bengal Fan is the largest submarine fan on Earth and the primary sink of sediments eroded in the Himalayan Mountains (Curray et al., 2003; Galy & France‐Lanord, 2001; Milliman & Farnsworth, 2011). Thus, the Bengal Fan is ideal to investigate the link between the Indian/Asian collision and the associated Himalayan uplift with its impact on climate, monsoon system, weathering/erosion intensity, and the global carbon cycle (Curray et al., 2003; Derry & France‐Lanord, 1997; Emmel & Curray, 1983; France‐Lanord et al., 2016; Galy et al., 2007).
In this context, the Bengal Fan was the target of IODP Expedition 354 (Exp 354) drilling seven sites at 8°N (France‐Lanord et al., 2016). Since the Late Miocene, most of the Bengal Fan sediment has been distributed
©2019. The Authors.
This is an open access article under the terms of the Creative Commons Attribution License, which permits use, distribution and reproduction in any medium, provided the original work is properly cited. Supporting Information: • Supporting Information S1 Correspondence to: F. Bergmann, f.bergmann@uni‐bremen.de Citation:
Bergmann, F., Schwenk, T., Spiess, V., & France‐Lanord, C. (2020). Middle to Late Pleistocene Architecture and Stratigraphy of the lower Bengal Fan— Integrating multichannel seismic data and IODP Expedition 354 results. Geochemistry, Geophysics, Geosystems, 21, e2019GC008702. https://doi.org/ 10.1029/2019GC008702
Received 11 SEP 2019 Accepted 8 NOV 2019
Expedition 354 drilling results.
This novel data set was utilized to establish a new, more detailed stratigraphy for the lower Bengal Fan, pro-viding a history of the lateral and temporal succession of terrestrial input along the entire Exp 354 transect at 8°N (since the Middle Pleistocene). On this basis, the study reconstructs lifetimes and locations of subfans and CLSs, thereby reconstructing the depositional dynamics of the Bengal Fan. Moreover, the study quan-tifies the ratio between CLSs and “nonchannelized” sediments.
1.1. Regional Background 1.1.1. The Bengal Fan
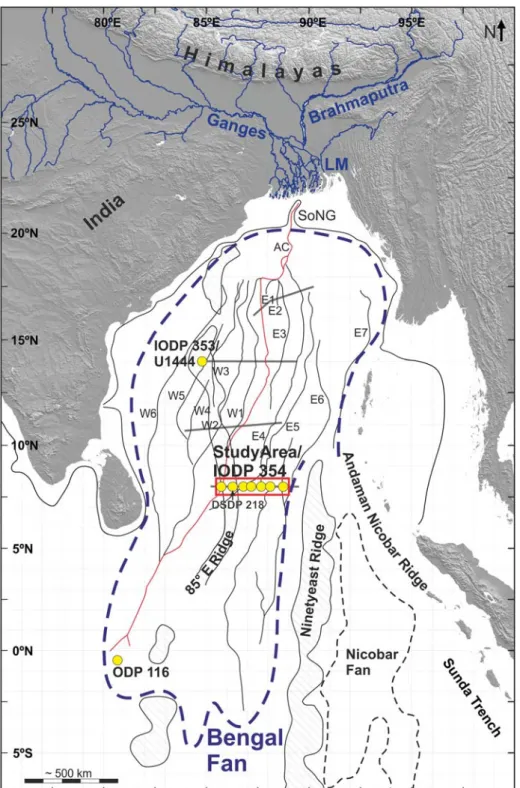
The Bengal Fan is bordered by India and Sri Lanka in the West, Bangladesh, and Myanmar in the North, and the Andaman‐Nicobar Ridge and Sumatra in the East (Figure 1). It extends over 3,000 km southwards from the shelf edge across the equator and covers almost the entire Bay of Bengal (Figure 1; Curray et al., 2003; Emmel & Curray, 1983).
Like Amazon Fan, Congo Fan, and Mississippi Fan, the Bengal Fan is classified as a fine‐grained or mud‐ rich fan (Bouma, 2000, 2001; Pickering & Hiscott, 2016; Radhakrishna et al., 2012; Richards et al., 1998). These large, mud‐rich (≤30% sand content) submarine fans are further characterized by low slope gradients and extensive, meandering CLSs in the upper and middle fan and more sheeted (lobe) deposition in the dis-tal fan (Pickering & Hiscott, 2016 and references therein; Richards et al., 1998).
The Bengal Fan was initiated subsequent to the collision of India with Asia in the Middle Paleocene to Early Eocene and the uplift of the Himalayan mountain range and Tibetan Plateau (Curray et al., 2003; Gibbons et al., 2015; Tada et al., 2016). The fan is underlain by the two aseismic ridges 85°E Ridge and Ninetyeast Ridge emplaced during the northward movement of the Indian plate (Figure 1; Bastia, Radhakrishna et al., 2010; Gopala Rao et al., 1997; Krishna, Neprochnov, et al., 2001). The ridges are buried under sediments in the northern Indian Ocean and partly exposed in the central Indian Ocean. The Eocene to Early Miocene sediment section of the Bengal Fan is composed of sheeted turbidites, while since the Late Miocene sediment supply via CLSs dominates (Curray et al., 2003; Schwenk & Spieß, 2009). The CLSs act as the main sediment pathway forming a complex depositional system originating from frequent channel avulsions, the reoccupation of older pathways, and lateral depocenter migration (Curray et al., 2003; Schwenk & Spieß, 2009). In the modern situation, sediment is transported from the Himalayan area to the shelf mainly via the Ganges and Brahmaputra rivers. The material is temporarily stored in the deep incised shelf canyon Swatch of No Ground (SoNG) before it is episodically released to the fan (Curray et al., 2003; Kuehl et al., 1989; Michels et al., 2003; Schwenk & Spieß, 2009). Several previous seismic studies have been conducted on the Bengal Fan investigating the fan evolution and architecture (e.g., Curray et al., 2003; Gopala Rao et al., 1997; Hübscher et al., 1997; Krishna et al., 2016; Schwenk et al., 2003; Schwenk et al., 2005; Schwenk & Spieß, 2009). Curray et al. (2003) mapped surface CLSs including abandoned channels (E7–E1 and W6–W1) as well as the youngest system, the Active Channel (AC), which also received sediments in Holocene times (Hein et al., 2017; Weber et al., 1997). Some of these channels (E4, E5, E6, and AC) reach our study area, while the other channels are located further to the west or terminate upfan (Figure 1). Based on the mapping of surface and bur-ied CLSs, Curray et al. (2003) introduced the concept of subfans. Subfans govern only parts of a submar-ine fan while concurrently the adjacent areas receive no or almost no fan sediments. For the upper Bengal Fan, the four Subfans A (1.9–0.96 Ma), B (0.96–0.465 Ma), C (0.465–0.125 Ma), and D (0.125 Ma to present) have been mapped and dated by correlation to DSDP Site 218 (Curray et al., 2003;
Figure 1). However, as DSDP Site 218 has been only spot cored with a rotary technique, recovery, particularly of sands, and age constraints were poor (Von der Borch & Sclater, 1974), resulting in large uncertainties. Subfans, also called channel‐levee complexes, are common for large submarine fans and
Figure 1. Overview map of the Bengal Fan. Solid blue lines: major river systems; blue dashed line: outline Bengal Fan; black and red lines: surface channels after Curray et al. (2003; from old to young: W7–W1, E7–E1, and Active Channel (AC)); gray lines: multichannel seismic profiles as shown in Figure 9; red square: study area. LM = lower Meghna River; SoNG = Swatch of No Ground. Tectonic features and fan outlines are redrawn after Bastia, Das, et al. (2010), Bastia, Radhakrishna, et al. (2010), Choudhuri et al. (2014), Curray et al. (2003), and McNeill et al. (2017).
have also been described for the Amazon Fan (e.g., Flood & Piper, 1997; Lopez, 2001; Piper et al., 1997), the Congo Fan (Marsset et al., 2009; Savoye et al., 2009), and the Mississippi Fan (Bouma et al., 1989). The investigation of four nearly W‐E‐oriented MCS profiles by Schwenk and Spieß (2009) revealed numer-ous other buried CLSs. Their data set includes the MCS Profile GeoB907‐020+027, along which the Exp 354 drill sites have been planned and drilled. The profile has been reprocessed for this study. Schwenk and Spieß (2009) identified two regional unconformities tentatively dated by correlation to DSDP Site 218 as of Pliocene (~4.8 Ma) and Pleistocene (~0.64 Ma) age. Following Schwenk and Spieß (2009), both unconformi-ties correlate with intraplate folding events found in the central Indian Ocean (Krishna, Bull, & Scrutton, 2001) and/or with lithological changes at ODP Leg 116 sites (Cochran, 1990; Stow et al., 1990). Instead, Exp 354 drilling revealed that the Pleistocene horizon, which was interpreted as an unconformity, is now associated with a boundary between a regionally extensive hemipelagic unit (Middle Pleistocene Hemipelagic Layer; see section below) and overlying turbiditic sediments (France‐Lanord et al., 2016).
1.1.2. IODP Expedition 354
IODP Expedition 354“Bengal Fan” took place in February/March 2015 and drilled seven sites along a W‐E transect at 8°N (Sites U1449–U1455; for location see Figures 1 and 3). At all seven sites, a record spanning the last 1–2 Myr has been recovered. The overall lithology of the cores is dominated by siliciclastic sand, silt, and clay deposited by turbidity currents (Figure 2; Adhikari et al., 2018; France‐Lanord et al., 2016). The sand recovered at 8°N is characterized by the same grain size range as the sediment transported today as basal transport by the Ganges and Brahmaputra rivers (Garzanti et al., 2010; Lupker et al., 2011).
Turbiditic sediments alternate with intervals of background (hemipelagic) sedimentation composed of cal-careous clay and nannofossil‐rich calcareous clay layers (France‐Lanord et al., 2016). Background sediments accumulate at low rates and consist dominantly of thefinest clay fraction of a turbidity suspension cloud which can be distributed uniformly over large areas and mixed with pelagic sediment.
At each of the seven sites, two prominent, regionally extending layers of background/hemipelagic sediment of several meters thickness have been recovered, namely, the Middle Pleistocene Hemiplegic Layer (MPHL)
Figure 2. Lithostratigraphic summary of Expedition 354 showing lithologies that constitute >10% of the core (modified after France‐Lanord et al., 2016). YYT = Youngest Toba Tuff, age after Gasparotto et al. (2000); LPHL = Late Pleistocene Hemipelagic Layer; E. huxleyi FO =first occurrence Emiliania huxleyi; MPHL = Middle Pleistocene Hemipelagic Layer. Ages of E. huxleyi FO and Brunhes‐Matuyama boundary after Gradstein et al. (2012). For core locations see Figures 1 and 3.
and the Late Pleistocene Hemipelagic Layer (LPHL; Figure 2). The MPHL comprises the Matuyama‐ Brunhes Boundary (0.778 Ma), the Jaramillo Subchron (1.072–0.988 Ma), and/or the Cobb Mountain Subchron (1.186–1.072 Ma; France‐Lanord et al., 2016; Gradstein et al., 2012). Following Weber and Reilly (2018), the MPHL is composed of a pure hemipelagic part (their Unit 2a) lasting from ~MIS37 to MIS25 (~1.24–0.93 Ma) overlain by a mixed hemipelagic/turbiditic part (their Unit 2b) lasting from ~MIS25 to MIS17 (~0.93–0.68 Ma). Where the MPHL is purely hemipelagic, sedimentation rates are 2–2.5 cm/kyr. Weber and Reilly (2018) further suggest that the top of the MPHL laterally varies in age. While hemipelagic deposition ceased around MIS17 (~0.68 Ma) at IODP Site U1452, it lasted until ~MIS9 (~0.3 Ma) at Site U1451 (Weber & Reilly, 2018). However, limited age constraints complicate the accurate dating of the top of the MPHL. The LPHL marks another phase of long‐lasting and widespread background/hemipelagic deposition draping the sediments at Sites U1449–U1453, the eastern part of the Exp 354 drilling transect (Figure 2). At Site U1455, the hemipelagic sediments of the LPHL are intermixed with turbiditic material while at Site U1454, only a ~22‐cm‐thick hemipelagic drape has been recovered (France‐Lanord et al., 2016). One stratigraphic marker within the LPHL is the Youngest Toba Tephra (~0.075 Ma, Gasparotto et al., 2000) which has been recovered at the six eastern Exp 354 sites. The LPHL comprises an average sedimentation rate of ~2.3 cm/kyr, and its onset has been dated to ~0.25 Ma (Weber et al., 2018; Weber & Reilly, 2018). The stratigraphy of the drilling transect is further constrained by the first occurrence (FO) of Emiliania huxleyi (~0.29 Ma; age after Gradstein et al., 2012) identified in all seven drill sites between the LPHL and the MPHL (Figure 2). Within this interval further thin hemipelagic layers were recovered, and seismic data are required to correlate these undated layers between drill sites.
2. Materials and Methods
In this study, we present high‐resolution MCS data of the Bengal Fan in integration with drilling results from the Exp 354 carried out in February/March 2015 (Figures 2 and 3).
2.1. Seismoacoustic Data Acquisition and Processing
The MCS data set used in this study was acquired during the two R/V Sonne research cruises SO125 in 1997 and SO188 in 2006, in cooperation of the University of Bremen and the BGR Hannover (Spieß et al., 1998; Spieß et al., 2006). The data set consists of 52 profiles with a total length of ~1,500 km (Figure 3). The MCS data were recorded with two differently sized seismic sources (both GI‐guns) and different recording units resulting in two data sets with different vertical and horizontal resolution as well as a different subsea-floor penetration (see Table 1 for details). All data underwent full MCS data processing including common‐
Figure 3. Bathymetric map of the study area at 8°N. Black and red lines: multichannel seismic profiles used in this study. Yellow dots: IODP Expedition 354 drill sites. AC, E4, E5, and E6: surface channels after Curray et al. (2003).
Table 1
Summary of the Specifications of the Utilized Multichannel Seismic Data Sets Cruise Seismic source volume
No. of channels Streamer length, active section (m) Channel spacing (m) Frequency range (Hz) Vertical resolution (m) Bin size along‐track (m)
SO188 4.1 L generator 1.7 L injector 96 600 6.25 25–200 ~15 8
midpoint binning, velocity analysis, normal‐moveout correction, stacking, noise reduction, static correc-tions, and time migration. The processed data have a standard seismic polarity. Processing and interpreta-tion of the MCS data were conducted with the software“Vista 14; Seismic Data Processing” and “IHS Kingdom 2016.” The bathymetry data shown in Figure 3 were acquired using the swath sounder Hydrosweep DS (SO93, SO125) and the Simrad EM120 (SO188), respectively. The bathymetry data were pro-cessed on board with the software“QPS Fledermaus” and the open‐source software MB‐systems (Caress & Chayes, 2017). The data imaged in Figure 3 are gridded with a resolution of 100 × 100 m. Time‐depth con-version shown onfigures was conducted with seismic velocities of 1,500 m/s for the water column and 1,650 m/s for the subseafloor. The thickness of the MPHL (section 3.1.1; Figure 6) has been converted from two‐ way travel time to meters using the average P‐wave velocity of calcareous clay measured during Exp 354 (1,530 m/s; France‐Lanord et al., 2016).
2.2. Core‐Seismic Integration
Onboard measurements during Exp 354 revealed fairly uniform grain sizes and P‐wave velocities throughout the upper ~200 mbsf. This is further confirmed by downhole logging measurements conducted at Site U1453
Figure 4. Top: Uninterpreted multichannel seismic data near Site U1453 and channel E4. MS = magnetic susceptibility, onboard measured, SI units (France‐ Lanord et al., 2016). Bottom: Interpreted multichannel seismic data near Site U1453 and channel E4 including the main architectural elements of channel‐levee systems (channelfill, point bars, levees) intercalated by HARPs (high amplitude reflection packages) and Hemipelagic Layers. LPHL = Late Pleistocene Hemipelagic Layer; MPHL = Middle Pleistocene Hemipelagic Layer. For location see Figure 5.
(between ~70 and 220 mbsf), allowing a well‐seismic tie down to the MPHL using a constant seismic velocity. For each drill site, the seismic velocity was determined byfitting prominent seismic reflections with the core lithology as well as measured physical properties (Figure 4). Hemipelagic (background) lithologies are characterized by low magnetic susceptibility and low natural gamma radiation (France‐ Lanord et al., 2016). Due to the relatively high impedance contrast to the surrounding turbiditic sediments, these can be very well correlated to high amplitude reflections in the seismic data (Figure 4). Additionally, velocities were cross‐checked with onboard measured P‐wave velocities (France‐Lanord et al., 2016). The bestfit between the MCS data and Exp 354 drilling results was achieved using a constant
Figure 5. (a) Top: Uninterpreted multichannel seismic Profile GeoB97‐020+027 and IODP Expedition 354 drill sites. Bottom: Interpreted line drawing of Profile GeoB97‐020+027 indicating channel‐levee systems (CLSs) and their succession (1 = oldest CLS; 40 = youngest CLS). Yellow CLSs = Subfan C, blue CLSs = Subfan D. LPHL = Late Pleistocene Hemipelagic Layer; E. huxleyi FO =first occurrence Emiliania huxleyi; MPHL = Middle Pleistocene Hemipelagic Layer. For location see Figures 1 and 3. For a high‐resolution image of Figure 5, see Figure S1. (b) Top: Continuation of the uninterpreted multichannel seismic Profile GeoB97‐020+027 and IODP Expedition 354 drill sites. Bottom: Interpreted line drawing of Profile GeoB97‐020+027 indicating channel‐levee systems (CLSs) and their succession (1 = oldest CLS; 40 = youngest CLS). Yellow CLSs = Subfan C, blue CLSs = Subfan D. For location see Figures 1 and 3; for legend see Figure 5a.
sediment velocity of ~1,640 m/s for Sites U1449, U1454, and U1455, ~1,650 m/s for Sites U1451 and U1453, and ~1,680 m/s for Sites U1450 and U1452. With this well‐seismic tie, a fit of lithological units with the corresponding reflections within a seismic wavelength (approximately 5 m) was achieved. During the onboard drilling operation, interfaces could be targeted better than 2.5 m. However, further depth uncertainties of several meters derive from coring disturbances and reduced recovery, since the curation procedure forces all samples to be shifted toward the top of a core.
3. Results
The 420‐km‐long, west‐east‐oriented MCS Profile GeoB97‐020+027 illustrates the (seismo)stratigraphic fra-mework of the study area as well as the lateral and vertical variability of Bengal Fan sedimentation at 8°N. Profile GeoB97‐020+027 crosses all Exp 354 drill sites and extends to the 85°E Ridge and the Ninetyeast Ridge (Figures 1 and 5). The seafloor depth increases westwards from ~3,600 to ~3,750 m water depth. Here we focus on the upper ~100–250 m of the sediment column down to the MPHL, which is strongly influ-enced by the formation of CLSs (Schwenk et al., 2005; Schwenk & Spieß, 2009).
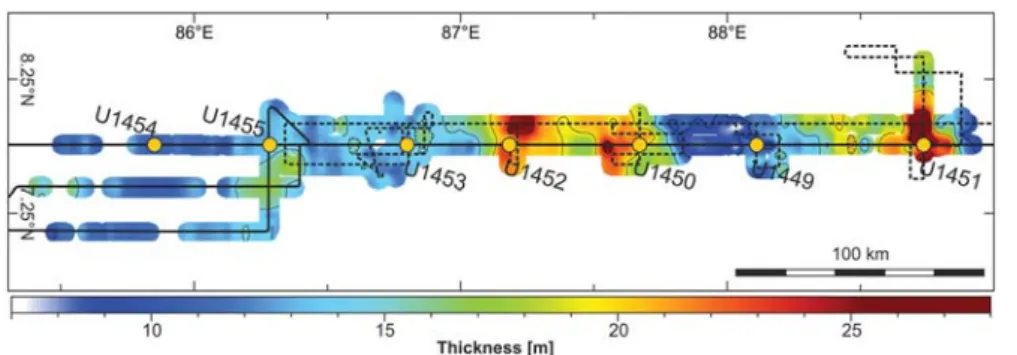
Figure 6. Thickness map of the Middle Pleistocene Hemipelagic Layer (MPHL). Conversion of two‐way travel time into meters has been conducted with the average P‐wave velocity of calcareous clay measured during Exp 354 (1,530 m/s).
Table 2
Summary of the Six Seismic Facies and Their Geological Interpretation
Seismic facies
Seismic
reflection pattern Continuity Amplitude
Reflection configuration
External
shape Lithology Geological interpretation
SF 1 (background/ hemipelagic sediments)
Continuous High Parallel Sheeted
a
Hemipelagic dominated layer deposited in areas not reached by the elsewhere concurrently occurring fan sedimentation SF 2 (HARPs) Continuous Medium to high (Sub)parallel Variable
a
Coarse sediment deposited via unchannelized turbidity currents
SF 3 (CHARs) Discontinuous High Chaotic Irregular Not drilled Coarse sediment transported at channel thalweg
SF 4 (Point Bars) Continuous where not reflection free
Low, in parts reflection free
Subparallel Irregular Not drilled Indicator of lateral channel thalweg migration
SF 5 (Levee Deposits) Continuous Low to moderate
Divergent Wedge
a
Levees deposited via overspilling turbidity currents
SF 6 (Channel Fill) Continuous Moderate to high Parallel Fill Not drilled Erosional channelfill after channel abandonment
Levee Deposits, HARPs (high amplitude reflection packages), Channel Fill, and CHARs (chaotic high ampli-tude reflection packages) as typical seismic facies for the Bengal Fan (based on work on the Amazon Fan, e.g., Flood et al., 1997; Hiscott et al., 1997; Lopez, 2001; Pirmez et al., 1997).
3.1.1. Seismic Facies 1 (Background Sedimentation/Hemipelagic Layer)
Seismic Facies 1 (SF 1) consists of distinct, high amplitude, continuous, and parallel reflections. SF 1 drapes underlying reflections and reveals a lateral extent of up to several hundred kilometers. Exp 354 drilling clearly links SF 1 with the MPHL and the LPHL (Figure 4; France‐Lanord et al., 2016; see also section 3.2. The MPHL is acoustically represented by two high amplitude reflections confining parallel, lower amplitude internal reflections. The LPHL is represented by a high amplitude reflection directly at the seafloor. Additional single, distinct, high amplitude reflections of SF 1 correlate to calcareous clay layers of thicknesses below the vertical seismic resolution.
3.1.2. Seismic Facies 2 (HARPs)
Seismic Facies 2 (SF 2) represents parallel to subparallel reflection packages present along the entire work-ing area. Where SF 2 overlies an inclined surface/reflection, reflections of SF 2 onlap the underlying strata. The reflections of SF 2 are rather continuous and of medium to high amplitude in‐between CLSs. The upper boundary is either conformable or erosional truncated by“channel facies.”
Exp 354 core descriptions (France‐Lanord et al., 2016) as well as post‐cruise grain size measurements (cores U1450A + B and U1451A + B; Adhikari et al., 2018) show that SF 2 is predominantly composed of sand (>85% sand content) and silty sands (85–50% sand content), locally intercalated with layers of silt and clay. Following Lopez (2001) and Schwenk et al. (2005), SF 2 is associated with HARPs (further also referred to as unchannelized turbiditic sediments). HARPs are massive to graded sands deposited from unchannelized tur-bidity currents, either as intrachannel deposits or as channel‐lobes during the downfan migration of a CLS (Figures 4 and 5; Lopez, 2001; Schwenk et al., 2005).
3.1.3. Seismic Facies 3 (CHARs)
Seismic Facies 3 (SF 3) forms irregularly shaped features found at or beside the base of most surface and bur-ied channels. The base contact of SF 3 is in general unconformable and mostly characterized by downlaps. The facies comprises partly chaotic, partly west‐ or east‐dipping reflections of high amplitude.
SF 3 has not been drilled during Exp 354. Based on its seismic character and following Schwenk et al. (2005), SF 3 is associated with CHARs, which are interpreted as aggradational channelfill deposited from the coarse sediment fraction of a turbidity current confined within the migrating and aggrading channel thalweg (Lopez, 2001; Pirmez & Imran, 2003; Schwenk et al., 2005).
3.1.4. Seismic Facies 4 (Point Bars)
Seismic Facies 4 (SF 4) comprises blocks of low amplitude reflections located adjacent to the thalweg of channels. Where internal reflections are visible, they are inclined toward the channel thalweg. The lower boundary of SF 4 is defined by downlaps while the upper boundary is conformable. In places, SF 4 appears almost reflection free, probably because the reflectors are too steep to be imaged.
No lithological information on SF 4 is available as it has not been drilled during Exp 354. In accordance with Schwenk et al. (2005), SF 4 is associated with point bars, which form during the lateral migration of a channel thalweg.
3.1.5. Seismic Facies 5 (Levee Deposits)
Seismic Facies 5 (SF 5) features wedge‐shaped bodies next to flanks of surface and buried channels. SF 5 comprises divergent, low to moderate amplitude reflections downlapping or onlapping on a base reflector, which is often of high amplitude. The upper boundary appears conformable.
Where SF 5 sediments have been recovered during Exp 354, they consist of clayey silt to sandy silt turbidites, partly intercalated by sandy layers (Adhikari et al., 2018; France‐Lanord et al., 2016). The seismic character-istic of SF 5 and its typical location at channelsflanks clearly indicates them as levee deposits formed by overspilling of turbidity currents traveling through the nearby channel (Hiscott et al., 1997; Pirmez & Imran, 2003; Schwenk et al., 2005)
3.1.6. Seismic Facies 6 (Channel Fill)
Seismic Facies 6 (SF 6) occurs as isolated U‐ or V‐shaped feature interbedded with SF 2 and flanked by SF 5. The facies comprises parallel layered, distinct reflections of medium to high amplitude with sharp lateral boundaries to the surrounding strata. SF 6 is often erosionally truncated into SF 1, 2, and/or 5.
Lithological information on SF 6 is not available as it has not been drilled during Exp 354. Based on its seis-mic characteristics and following Schwenk et al. (2005), SF 6 is linked to the turbiditic fill of abandoned channels.
3.2. Regional Deposition of Hemipelagic Sediments 3.2.1. The Middle Pleistocene Hemipelagic Layer
The MPHL is a layer extending almost continuously throughout the whole study area and is associated with SF 1 (Figures 5–7). The depth of the MPHL varies from west to east with ~180 ms (~148 m) below the seafloor west of Site U1454, 80 ms (~66 m) below the seafloor above the 85°E Ridge, 200–210 ms (~173 m) below the seafloor in the center of Profile GeoB97‐020+027, and only ~30 ms (~25 m) below the seafloor in the east
Figure 7. Diagram showing the succession of channel‐levee systems highlighting their lateral migration. The x axis represents the distance along Profile GeoB97‐ 020+27 as in Figure 5. The y axis represents relative time. Yellow: channel‐levee systems of Subfan C; blue: channel‐levee systems of Subfan D. The surface channels (AC and E4‐6) are highlighted by a red outline. The Middle and Late Pleistocene Hemipelagic Layers (MPHL and LPHL) are shaded in red and blue, respectively. Dimensions of channel‐levee systems are not to scale.
3.3. Channel‐Levee Systems (SF 3–6)
Based on the above described seismic facies interpretation, 42 CLSs have been identified above the MPHL, and another CLS has been found incorporated into the MPHL. The CLSs are composed of SF 3–6. Criteria for the identification of CLSs are the existence of levees (SF 5) and erosional truncations at the channel flanks. All large CLSs (4, 14–17, 21, 22, 26–29, 35, and 40) are filled (or partly filled) by a combination of CHARs, Point Bars, and Channel Fill (SF 3, 4, and 6). For the remaining smaller channels, the data do not resolve between these three different seismic facies.
Based on the tracing of levee base reflectors of all CLSs, a relative stacking pattern has been developed from oldest (No. 1) to youngest (No. 40; Figures 5 and 7). For systems 8 and 9, 14 and 15, 16 and 17, 19 and 20, and 38 and 39, respectively, base reflectors were not clearly separable. Hence, these systems are numbered as a/b‐ W or a/b‐E according to their relative lateral position on Profile GeoB97‐020+027. In addition to these 42 well‐developed CLSs, several small channels without levees were identified but not considered for the recon-struction of the stacking pattern. Four CLSs represent the surface channels AC (No. 40), E4 (No. 29), E5 (No. 27), and E6 (No. 26). The system E4 shows three separable superimposed levees (Figure 4, see also Schwenk & Spieß, 2009 and theirfigure 3), each of which is counted as an individual system (No. 4, 14/15W, and 29). The width of the levees ranges from a few kilometers to 40 km (e.g., the AC; Figure 7). The maximum levee thickness is likewise variable, ranging from a few meters up to ~40 m. The eroded channel relief (base of the levee to maximum erosion depth) exceeds the levee heights in almost all CLSs. The maximum channel relief of ~163 m is reached at system No. 35. The CLSs cluster at three locations, namely, west of the 85°E Ridge (0– 80 km in Figure 5), east of the 85°E Ridge (130–230 km), and between Sites U1450 and U1449 (270–340 km). Between these areas of channel‐levee development, the subseafloor is dominated by HARPs and small, unle-veed channels (Figure 5).
The CLSs have been grouped into two subfans. The older subfan includes the systems 2–29. CLS No. 1 (265 km) marks the reappearance of CLS formation in the study area after the deposition of the MPHL (Figures 5–7). The lateral position of two subsequent systems within this subfan migrates back and forth between Sites U1455 and U1451 (Figure 5). The distance between two successive systems ranges from <10 up to >150 km (Figure 7). The older subfan includes the development of the surface channels E4, E5, and E6, each draped by the LPHL, and is constrained by the 85°E Ridge and the Ninetyeast Ridge. The youngest subfan includes the CLSs 30–40, which are all located west of the 85°E Ridge (Figure 5). The distance between two successive systems in this subfan ranges from ~10 to 100 km. The younger subfan is less con-strained by Exp 354 drill sites. The MCS data cover only the eastern levee of CLS No. 37, and it is unknown how many additional CLSs are located outside of our data range. The two unlabeled CLSs at 10 and 60 km (gray, Figure 5), respectively, cannot conclusively be assigned to either subfan (Figure 5). The depth of the biostratigraphic datum E. huxleyi FO at Sites U1455 and U1454 indicates that both CLSs are most likely older than system No. 28, but reflections between these CLSs are ambiguous.
3.4. Unchannelized Turbiditic Sediments (SF 2)
Besides the numerous CLSs, large parts of the sediments are composed of unchannelized sediments (HARPs; Figure 5). When omitting the hemipelagic parts, the remaining unchannelized sediments represent ~63% of the total amount of sediments deposited along Profile GeoB97‐020+027 (above the MPHL), while the CLSs represent the remaining 37%. The unchannelized sediments spread laterally for tens to hundreds of kilo-meters, a lot farther than the levees do, while maintaining a relativelyflat upper surface as expressed by their onlapping of the underlying CLSs.
from the dominance of hemipelagic sedimentation to a turbidite‐ dominated regime. The onlapping reflectors overlying the MPHL imply that the turbiditic sedimentationfirst reappeared proximal to Site U1452 and from there spread gradually west and eastwards, underlining the asynchronous character of the upper boundary of the MPHL.
Schwenk and Spieß (2009) interpreted the onlapping reflectors at the top of the MPHL as an“unconformity” of Pleistocene age. They tentatively attributed its formation to the intraplate tectonic activity in the central Indian Ocean discussed by Krishna, Bull, and Scrutton (2001). However, following Exp 354 and the new interpretation of Profile GeoB97‐ 020+027, the change of reflector configuration at the MPHL upper boundary does not represent an unconformity but rather a transition from background to turbiditic fan sedimentation. Consequently, we propose that also the Pliocene and Miocene“unconformities” identified at 8°N (Schwenk & Spieß, 2009), a set of undated reflectors former interpreted as “unconformities” at 11°N, 14°N, and 16.5°N (Ua–Ug, Figure 9; Schwenk & Spieß, 2009), and Unconformity B identified at the IODP Leg 116 sites (0.8 Ma, Cochran, 1990) are representing the shift from back-ground to fan sedimentation.
The succession of deposition displayed in Figure 7 clearly highlights the concurrent deposition of the MPHL and the LPHL with fan sediments. The parallel occurrence of both background and fan sediments along a single horizon can be explained with the concept of subfans. For the Quaternary section of the upper Bengal Fan, this concept has been intro-duced by Curray et al. (2003). The concept of subfans implies that background/hemipelagic sedimentation is linked to the deflection of tur-biditic materialflux into other regions of the fan and does not imply a fan shutoff. Consequently, the LPHL and the MPHL represent time spans when fan deposition is still ongoing but deflected to other areas.
4.1.2. Timing of Subfans
Since the onset of the MPHL, three individual phases of deposition can be distinguished at 8°N. The oldest is the MPHL itself (~1.24–0.68 Ma; Weber & Reilly, 2018), deposited in the study area while it is likely that con-currently fan deposition occurred elsewhere. The MPHL is followed by the two subfans identified in the seis-mic data (~0.68–0.25 Ma and ~0.25 Ma to recent, respectively), and the deposition of the LPHL was concurrent with the younger subfan. With our new data, we are able to extend the subfans,first introduced by Curray et al. (2003), as far south as 8°N and get an improved control on their timing. In order to integrate ourfindings on subfan deposition with the findings from earlier studies (Curray et al., 2003; Schwenk & Spieß, 2009), we combine subfan location (discussed in section 4.1.3 and Figure 9) and timing (this section and Figure 8). Evidently, the most recent Subfan D and our younger subfan represent the same depositional unit, including, amongst others, the AC. Profile GeoB97‐020+027 covers the easternmost part of Subfan D plus its hemipelagic equivalent, the LPHL. Weber et al. (2003) and Schwenk and Spieß (2009) suggested that Subfan D started to develop around ~300 ka ago, earlier than suggested by Curray et al. (2003). Assuming that the onset of the LPHL also marks the onset of Subfan D, we are able to limit its initiation to having occurred after ~0.29 ka (E. huxleyi FO) but before ~0.25–0.2 ka (age of LPHL base after Weber et al., 2018
Figure 8. Subfan sequences as interpreted by Curray et al. (2003), Schwenk and Spieß (2009), and this study and the concurrently deposited hemipelagic layer (SF 1; this study). The naming of subfans in this study after Curray et al. (2003). Dating of subfans based on Weber et al. (2018) and Weber and Reilly (2018). LPHL = Late Pleistocene Hemipelagic Layer; MPHL = Middle Pleistocene Hemipelagic Layer.
Figure 9. (a–c) Interpreted map of Subfans B (red), C (yellow), and D (blue) based on Exp 354, IODP Expedition 353 Site U1444, and multichannel seismic profiles GeoB97‐059/69, 041, 028, and 020+27 (Schwenk & Spieß, 2009; this study). Surface channels and the position of subfans on the upper Bengal Fan (grey shaded areas) after Curray et al. (2003). (d) Sketch of Subfans B, C, and D in cross section along the multichannel seismic profiles GeoB97‐059/69, 041, 028, and 020+27 (Schwenk & Spieß, 2009; this study). Ua–Ug = unconformities after Schwenk and Spieß (2009). W1–W5, AC, and E3–E6 = surface channels after Curray et al. (2003) and Schwenk and Spieß (2009).
onset and termination earlier than proposed by Curray et al. (2003; Figure 8).
4.1.3. Regional Extent of Subfans
In Figure 9 we present a model of subfan location for large parts of the Bengal Fan, which integrates our new findings from 8°N with the early work from Curray et al. (2003). For this model, we additionally utilized the MCS profiles GeoB97‐028, 041, and 059/069 published by Schwenk and Spieß (2009) and IODP Expedition 353 Site U1444 located at ~14°N directly above the 85°E Ridge (Clemens et al., 2016). The subfan maps shown in Figure 9 are based on seven main assumptions discussed in the following. (1) The subfan synchro-nously deposited with the MPHL is not covered by the Exp 354 and our MCS data. However, the subfan loca-tion can only be west of the 85°E Ridge since east of the study area lies the Nicobar Fan, which has been disconnected from the Bengal Fan since ~2 Ma ago (McNeill et al., 2017). (2) No turbiditic sedimentation reached Site U1444 between ~3.5 and 0.45 Ma ago (Unit 2, 169–95 m CSF‐A; Clemens et al., 2016). However, gravity anomaly maps (Bastia, Radhakrishna, et al., 2010) and MCS lines (Schwenk & Spieß, 2009) show that Site U1444 is located above a high elevated section of the 85°E Ridge marking this long‐ lasting hemipelagic phase as a local phenomenon. (3) Top and bottom of Unit 2, Site U1444, correlate with Unconformities Uc and Ud at 14°N identified by Schwenk and Spieß (2009). These two unconformities split up just east of Site U1444 where they are intercalated by turbiditic sediments. (4) Tentative northwards tra-cing of the MPHL (along preliminary processed MCS profiles) correlates it with Unconformity Ub at 11°N (Schwenk & Spieß, 2009). (5) Combining our findings with the studies of Curray et al. (2003) and Schwenk and Spieß (2009), we assigned surface channels E2–E7 to Subfan C and surface channels W1– W6, the AC, and E1 to Subfan D. (6) Unconformities Ue and Uf (16.5°N; Schwenk & Spieß, 2009) enclose Subfan C. (7) The elevation of the 85°E Ridge above the regional (paleo)seafloor varies from north to south and thus allowed turbidity currents to overflow this ridge at some places while at others it acted as a topo-graphic barrier (Bastia, Radhakrishna, et al., 2010; Radhakrishna et al., 2012).
The deposition of the MPHL at both MCS profiles at 8°N and 11°N proves the absence of the concurrently deposited Subfan B there. However, at the MCS profile at 8°N (GeoB97‐020+027), the acoustic character of the unconformity associated with the MPHL is different in the very west compared to the remaining pro-file (Figure 5). The distinct set of high amplitude reflections enclosing a lower amplitude package character-izing the MPHL disappear west of CLS No. 35 (Figure 5). This may be related to the presence of the fan sediments of Subfan B and the absence of the MPHL. A similar, although not as distinct, change in acoustic appearance is observed for Ub in the west of Profile GeoB97‐028. The long‐lasting hemipelagic deposition at IODP Site U1444 proves the absence of Subfan B at this location. However, turbiditic sediments deposited west of Site U1444, between Unconformities Uc and Ud (14°N), cover the timespan from ~0.45 to 3.5 Ma, including the time of deposition of Subfan B. Thus, we interpret the upper part of turbiditic sediments enclosed by Uc and Ud as Subfan B. Furthermore, based on the sequence of subfans, we interpret the sedi-ments enclosed by Unconformities Ug and Uf at 16.5°N (Figure 9) as Subfan B. Unfortunately, except for the AC, no absolute age constraints exist at 16.5°N making this interpretation uncertain. Our data do not cover the Bengal Fan west of the 85°E Ridge. Nonetheless, in general sediments from the Bay of Bengal can also reach this part of the Bengal Fan (Bastia, Radhakrishna, et al., 2010; Krishna et al., 2016). Therefore and due to the disconnection of Nicobar Fan and Bengal Fan prior to the formation of Subfan B, we consider the western Bengal Fan as the most likely location of Subfan B. Subfan C is well constrained in the eastern Bengal Fan by the surface channels E2–E7 and its deposition at 8°N. Unconformities traced on the profiles at 16, 14, and 11°N indicate that Subfan C partly underlies Subfan D, while at 8°N the two subfans lie side by side. At IODP Exp 353 Site U1444 turbiditic sedimentation (onset Unit 1, Clemens et al., 2016) commences at
in order to focus the accommodation of the two Subfans C and D.
4.2. Local Depocenter Shifting
Our data provide nearly full coverage of the evolution of Subfan C at 8°N during which in total 28 CLSs reached 8°N (CLS 02–29, Figures 5 and 6). Using the total duration of Subfan C, the average lifetime for CLSs is calculated to ~15 kyr. These calculations do not include the at least 30 small and unleveed channels visible in the MCS data (Figure 5), which are believed to develop during the downfan migration of a CLS as feeder channel within the terminal lobe (Jegou et al., 2008; Picot et al., 2016). Considering that these small channels represent CLSs terminating further upfan, the average lifetime of the CLSs must be shorter. The variable size of CLSs on the Bengal Fan implies unequally long lifetimes rather than a regular succession. This suggests autocyclic processes such as upfan avulsions as main control on the CLS lifetimes and not cyc-lic trigger such as sea‐level variations. However, to fully understand if small‐scale sea‐level changes might have had an influence on channel avulsions, more accurate control on CLS ages is required.
One of the strikingfindings on Profile GeoB97‐020+027 is a prominent segment of 50–60 km width comple-tely lacking CLSs (Figure 5, between Sites U1452 and U1450). This CLS gap has also been observed at the SO188 MCS profiles located 10 km upfan (see map Figure 3) but not at the MCS profiles at 11, 14, and 16.5°N (Schwenk & Spieß, 2009), implying the lack of CLS being a local phenomenon. Curiously enough this gap coincides with the today topographically lowest part of the MPHL where turbiditic deposition restarted after the MPHL (Figure 5, ~210–280 km). CLSs tend to fill such topographic lows, but this basin has been filled by unchannelized turbiditic sediments only. Therefore, it is suggested that during the deposition of Subfan C CLSs located in its center did not prograde down to 8°N. Instead, they must have terminated upfan, and only their depositional lobes reached the drilling transect.
4.3. Sand Deposition on the Bengal Fan and Its Implication on Submarine Fan Classification
As described in section 3.4, about two thirds (~63%) of the sediments reaching 8°N (along Profile GeoB97‐ 020+027) are deposited by unchannelized turbidites (SF 2/HARPs in seismic data). At Site U1453, the unchannelized turbidites of Subfan C accumulated with an average rate of ~35 cm/kyr and seem to be depos-ited almost continuously at 8°N during the subfan's active phase of more than 400 kyr.
Where successfully recovered during Exp 354, HARPs represent sands and silty sands with the sand frac-tion dominated byfine sand (Adhikari et al., 2018; France‐Lanord et al., 2016). The Exp 354 sites exhibit numerous drilling gaps. However, the reflection pattern of the HARPs is continuous throughout the MCS data, suggesting that drilling gaps within the HARPs are the result of the loss of sand during coring. Therefore, HARPs should be, like at the Amazon Fan (Lopez, 2001), considered as sandy facies. Following the results of Adhikari et al. (2018), the sand content of the unchannelized sediments (HARPs) often exceeds 70%. Consequently, sand makes up almost half (~44%) of the sediment deposited since the MPHL at 8°N. Moreover, this is likely an underestimate as the sediments deposited on the channelfloors and within abandoned channels were not included in these calculations. Furthermore, the channel facies (SF 3 [CHARs] and SF 4 [Point Bars]) probably contain significant amounts of sand as shown for the Amazon Fan (Flood et al., 1997; Manley et al., 1997) or the Congo Fan (Babonneau et al., 2010). These two seismic facies represent at least onefifth of the overall channel‐levee sediments. No sediments of SF 3 and SF 4 have been recovered during Exp 354. Taking SF 3 and 4 into account for sand content calcula-tions by assuming the same sand content as for SF 2 (HARPs; 70%) would increase the overall sand content at 8°N to 50%.
Fan. There, the turbiditic sediment of the Pleistocene section (their Unit 1) is as well dominated by sandy material (Clemens et al., 2016).
Very large submarine fans associated with low slope gradients, large, meandering CLSs, and a sand content of≤30% have been classified as “mud‐rich fans,” and, like Indus, Amazon, Congo, Mississippi, or Laurentian Fan, the Bengal Fan has been supposed to follow this classification (Pickering & Hiscott, 2016 and references therein; Richards et al., 1998). However, this is in contrast to the high sand content at the lower Bengal Fan estimated from the seismic data and drilling results. This high sand content may also be linked to the sedi-ments sourcing the Bengal Fan as the upstream setting differs to other large submarine fans in terms of, for instance, distance to mountain belt, area of delta plain, and river‐canyon connection. Nonetheless, also on other submarine fans large amounts of sand have been found. Pirmez et al. (1997) discuss the existence of massive sand packages on the middle and lower Amazon Fan (30‐ and >100‐m thickness, respectively). These observations suggest that large submarine fans may have the capacity to store large amounts of sands. Following this, the general characterization of large, low slope gradient submarine fans as“mud rich” (≤30% sand) may not be generally applicable. As discussed above, the sand content within a submarine fan increases downfan due to the loss of smaller grain sizes via overspilling. This, in combination with the observed high sand content at the middle to lower Bengal Fan, suggests that a distance‐related classification for large submarine fans, mud rich in proximal areas and mixed or sand rich in distal areas, is more suitable.
4.4. External Controls on the Bengal Fan in Comparison With Other Large Submarine Fans
Major controls on large submarine fans are the tectonic setting, the climatic conditions, the location of the submarine canyon transferring sediment to the deep sea, and sea‐level fluctuations (Bouma, 2001; Richards et al., 1998; Pickering & Hiscott, 2016 and references therein; Sweet & Blum, 2016). The tectonic setting influences, for example, the distance to the sediment source, basin morphology, and the vulnerability of the source area for erosion (Bouma, 2001; Pickering & Hiscott, 2016 and references therein). Climate varia-bility, on the other hand, steers precipitation and thereby directly influences runoff and fluvial transport capacity. Finally, sea‐level variations control sediment supply to submarine fans by changing the configura-tion of supplying rivers and submarine canyons acting as a connecconfigura-tion to the submarine fans (Bouma, 2001; Pickering & Hiscott, 2016 and references therein).
A prominent and well‐studied submarine fan is the Amazon Fan, which is often used as a typical example for the evolution and mechanisms of large, mud‐rich fans (Lopez, 2001; Maslin et al., 2006; Piper et al., 1997; Pirmez & Imran, 2003; Richards et al., 1998). The Amazon Fan received sediment exclusively during times of sea‐level lowstand thereby forming individual subfans (or here called channel‐levee complexes; Lopez, 2001; Piper et al., 1997). During times of high sea level, when the connection between the Amazon River and the Amazon Canyon was interrupted, thin hemipelagic layers and/or mass transport units were intercalating the individual channel‐levee complexes (Lopez, 2001; Maslin et al., 2006; Piper et al., 1997). In contrast, in other fan systems, a connection between river and feeder canyon is maintained. Recent stu-dies proved continuous sedimentation within the Indus submarine canyon since the last ~11 ka (Li et al., 2018). And the connection between Congo River and Congo Canyon ensures continuous sedimentflux to the submarine fan independent of sea level (Babonneau et al., 2010). This continuous sediment supply to the Congo Fan, even throughout sea‐level highstands, resulted in the deposition of three individual subfans concurrently with background sedimentation in the adjacent areas (Marsset et al., 2009; Savoye et al., 2009). The lateral shift between subfans here is mainly controlled by accommodation space (Savoye et al., 2009).
Bengal Fan and Congo Fan also reveal similar lifetimes of the subfans. Subfans C and D on the Bengal Fan lasted 453 and 250 kyr, respectively, while the three channel‐levee complexes on the Congo Fan had life-times between 210 and 330 kyr (Savoye et al., 2009). On the other hand, channel‐levee complexes on the Amazon Fan accumulated only during a single glacial‐interglacial cycle (~50–100 kyr; Piper et al., 1997, Lopez, 2001) since the fan was inactive during highstands.
Regarding individual CLSs it is evident that the average lifetime of Pleistocene CLSs of the lower Bengal Fan (~15 kyr) is on the same order as of the Congo Fan (5–17 kyr). However, CLS sizes on the Bengal Fan are highly variable suggesting highly variable lifetimes. In contrast, CLS lifetimes on the Amazon Fan were shorter (3–8 kyr). Channel avulsion there is associated with small‐scale sea‐level variations (Jegou et al., 2008; Maslin et al., 2006; Piper et al., 1997), whereas the avulsions on the Congo Fan were controlled by an interplay of internal (e.g., channel confinement and slope) and external forcing (e.g., turbidity current fre-quency and sea level; Picot et al., 2016; Savoye et al., 2009). The large variations in CLS size on Bengal Fan imply a more complex interaction of internal and external forcing.
The close resemblance between Bengal Fan and Congo Fan highlights the strong influence of the river‐ canyon configuration on the development of a submarine fan. A rising sea level does not necessarily inter-rupt sediment supply to a fan, in contrast to the Amazon Fan. A deeply incised shelf canyon (Congo Canyon; SoNG) and sufficient along‐shore transport (Bengal Fan) can maintain sediment delivery to the fan even throughout periods of rising and high sea level, while for the Amazon system in times of high sea level, sedi-ment is distributed along the shelf due to the presence of strong shelf currents (Geyer et al., 1996).
5. Conclusions
This study utilized a novel data set of high‐resolution MCS data in combination with Exp 354 drilling, the first systematic drilling transect across a sedimentary fan, in order to develop a new, refined stratigraphy for the lower Bengal Fan and to investigate the lateral and temporal variability of sediment deposition along the drilling transect at 8°N. Moreover, the channel‐levee stacking pattern developed and presented in this study enabled the comparison and correlation of the seven Exp 354 drill sites on a relative stratigraphy. Sedimentation in the study area is characterized by CLSs, unchannelized turbidity currents, and regional hemipelagic/background deposition. Turbiditic deposition governs parts of the Bengal Fan at a time forming so‐called subfans while hemipelagic deposition dominates concurrently in the remaining fan area, thereby creating condensed layers up to 20‐m thickness. Since the Middle Pleistocene, the three Subfans B (1.24– 0.68 Ma), C (0.68–0.25 Ma), and D (0.25 Ma to recent) and the two hemipelagic layers (MPHL [1.24–0.68 Ma; Weber & Reilly, 2018] and LPHL [0.25 Ma to recent; Weber et al., 2018]) built up in the Bengal Fan. Guided by topographic highs created by the 85°E Ridge and the Ninetyeast Ridge, the location of the subfans alternates between western and eastern fans. MPHL and LPHL represent the hemipelagic equivalents to Subfans B and D, respectively. The shift from one subfan to another does not correlate with glacial‐ interglacial cycles and thus is presumably controlled by the supplying canyons as suggested by Curray et al. (2003) in conjunction with fan topography. This constructional pattern has a close resemblance to deposition on the Congo Fan and indicates the deflection of fan sediments to different fan areas as the main driver for the presence of thick hemipelagic layers.
Above the MPHL sediments in the study area are constructed of 42 CLSs and numerous unleveed channels composing 37% of the total sediments deposited. The new data set provides for thefirst time an average CL
This study shows a very high sand content for the lower Bengal Fan, above the limit for mud‐rich fans of 30%. We, therefore, suggest that this classification is not appropriate for the Bengal Fan. The results also indi-cate that large submarine fans may store a larger proportion of sand than previously assumed, which is also found for other large submarine fans (e.g., Amazon Fan; Pirmez et al., 1997). A general characterization of large, low slope gradient submarine fans as“mud rich” (≤30% sand) may therefore not be generally applic-able, in particular because the sand/mud ratio increases downfan (Bouma, 2001; Posamentier & Kolla, 2003). We propose that a distance‐dependent classification (mud rich in proximal areas; mixed or sand rich in distal areas) should be applied with gradual transitions downfan.
References
Adhikari, S. K., Sakai, T., & Yoshida, K. (2018). Data report: Grain size analysis of Bengal Fan sediments at Sites U1450 and U1451, IODP Expedition 354. Expedition, 354, 1. https://doi.org/10.14379/iodp.proc.354.202.2018
Babonneau, N., Savoye, B., Cremer, M., & Bez, M. (2010). Sedimentary architecture in meanders of a submarine channel: Detailed study of the present Congo turbidite channel (Zaiango project). Journal of Sedimentary Research, 80(10), 852–866. https://doi.org/10.2110/ jsr.2010.078
Bastia, R., Das, S., & Radhakrishna, M. (2010). Pre‐and post‐collisional depositional history in the upper and middle Bengal fan and eva-luation of deepwater reservoir potential along the northeast Continental Margin of India. Marine and Petroleum Geology, 27(9), 2051–2061. https://doi.org/10.1016/j.marpetgeo.2010.04.007
Bastia, R., Radhakrishna, M., Das, S., Kale, A. S., & Catuneanu, O. (2010). Delineation of the 85°E ridge and its structure in the Mahanadi Offshore Basin, Eastern Continental Margin of India (ECMI), from seismic reflection imaging. Marine and Petroleum Geology, 27(9), 1841–1848. https://doi.org/10.1016/j.marpetgeo.2010.08.003
Bouma, A. (2000). Coarse‐grained and fine‐grained turbidite systems as end member models: Applicability and dangers. Marine and Petroleum Geology, 17(2), 137–143. https://doi.org/10.1016/S0264‐8172(99)00020‐3
Bouma, A. (2001). Fine‐grained submarine fans as possible recorders of long‐and short‐term climatic changes. Global and Planetary Change, 28(1), 85‐91. https://doi.org/10.1016/S0921‐8181(00)00066‐7
Bouma, A., Coleman, J., Stelting, C., & Kohl, B. (1989). Influence of relative sea level changes on the construction of the Mississippi Fan. Geo‐Marine Letters, 9(3), 161–170.
Caress, D. W., & Chayes, D. N. (2017). MB‐System: Mapping the seafloor. https://www.mbari.org/products/research‐software/mb‐system. Choudhuri, M., Nemèok, M., Stuart, C., Welker, C., Sinha, S. T., & Bird, D. (2014). 85° E Ridge, India—Constraints on its development and
architecture. Journal of the Geological Society of India, 84(5), 513–530.
Clemens, S. C., Kuhnt, W., LeVay, L. J., & Scientists, Exp. 353. (2016). Indian monsoon rainfall. Proceedings of the International Ocean Discovery Program, 353: College Station, TX (International Ocean Discovery Program). https://doi.org/10.14379/iodp.proc.353.2016 Cochran, J. R. (1990). Himalayan uplift, sea level, and the record of Bengal Fan sedimentation at the ODP Leg 116 sites. In Cochran, J.R., Stow,
D.A.V., et al., Proc. ODP, Sci. Results, 116: College Station, TX (Ocean Drilling Program). 116, 397‐414. https://doi.org/10.2973/odp.proc. sr.116.144.1990
Curray, J. R., Emmel, F. J., & Moore, D. G. (2003). The Bengal Fan: Morphology, geometry, stratigraphy, history and processes. Marine and Petroleum Geology, 19(10), 1191‐1223. https://doi.org/10.1016/S0264‐8172(03)00035‐7
Dennielou, B., Droz, L., Babonneau, N., Jacq, C., Bonnel, C., Picot, M., et al. (2017). Morphology, structure, composition and build‐up processes of the active channel‐mouth lobe complex of the Congo deep‐sea fan with inputs from remotely operated underwater vehicle (ROV) multibeam and video surveys. Deep Sea Research Part II: Topical Studies in Oceanography, 142, 25–49.
Derry, L., & France‐Lanord, C. (1997). Himalayan weathering and erosion fluxes: Climate and tectonic controls. In W. Ruddiman (Ed.), Tectonic uplift and climate change, (pp. 289–312). US: Springer.
Emmel, F. J., & Curray, J. R. (1983). The Bengal Submarine Fan, northeastern Indian ocean. Geo‐Marine Letters, 3(2‐4), 119–124. https:// doi.org/10.1007/bf02462456
Flood, R. D., & Piper, D. J. W. (1997). Amazon Fan sedimentation: The relationship to equatorial climate change, continental denudation, and sea‐level fluctuations. In R. D. Flood, D. J. W. Piper, A. Klaus, & L. C. Peterson (Eds.), Proc. ODP, Sci. Results (Vol. 155, pp. 653–675). College Station, TX: Ocean Drilling Program. https://doi.org/10.2973/odp.proc.sr.155.246.1997
Flood, R., Piper, D. J. W., Klaus, A., & Peterson, L. C. (1997). Proc. ODP, Sci. Results, 155: College Station, TX (Ocean Drilling Program). https://doi.org/10.2973/odp.proc.sr.155.1997
France‐Lanord, C., Spiess, V., Schwenk, T., Klaus, A., & & Scientists, Exp. 354 (2016). Proceedings of the International Ocean Discovery Program, 354. College Station, TX: International Ocean Discovery Program. https://doi.org/10.14379/iodp.proc.354.2016
Galy, A., & France‐Lanord, C. (2001). Higher erosion rates in the Himalaya: Geochemical constraints on riverine fluxes. Geology, 29(1), 23–26. https://doi.org/10.1130/0091‐7613(2001)029<0023:herith>2.0.co;2
Acknowledgments
This study was funded through the German Research Foundation (DFG) within the IODP Priority program (Grant SCHW1551/7‐1/2). We would like to thank captain, crew, and scientific party of RV Sonne cruises SO93, SO125, and SO188, and Exp 354. Funding for the collection of seismic data was provided by BMFT Project 03 G 0093 A (SO93), BMBF Grant 03 G 0125A (SO125), and BMBF Grant 03 G 0188A (SO188). The manuscript benefitted greatly from the advice of the editor Claudio Faccena, the reviewer Michael Steckler, and one anonymous reviewer. The data for this paper will be available by contacting the
corresponding author or accessed through PANGAEA (https://doi.org/ 10.1594/PANGAEA.908317).
Gopala Rao, D., Krishna, K., & Sar, D. (1997). Crustal evolution and sedimentation history of the Bay of Bengal since the Cretaceous. Journal of Geophysical Research‐all series, 102(17), 747–717,768. https://doi.org/10.1029/96JB01339
Gradstein, F. M., Ogg, J. G., Schmitz, M., & Ogg, G. (2012). The geologic time scale 2012. Elsevier.
Hein, C. J., Galy, V., Galy, A., France‐Lanord, C., Kudrass, H., & Schwenk, T. (2017). Post‐glacial climate forcing of surface processes in the Ganges–Brahmaputra river basin and implications for carbon sequestration. Earth and Planetary Science Letters, 478, 89–101. https:// doi.org/10.1016/j.epsl.2017.08.013
Hiscott, R. N., Hall, F. R., & Pirmez, C. (1997). Turbidity‐current overspill from the Amazon Channel: Texture of the silt/sand load, paleoflow from anisotropy of magnetic susceptibility, and implications for flow processes. In R. D. Flood, D. J. W. Piper, A. Klaus, & L. C. Peterson (Eds.), Proc. ODP, Sci. Results (Vol. 155, pp. 53–78). College Station, TX: Ocean Drilling Program. https://doi.org/10.2973/odp. proc.sr.155.202.1997
Hübscher, C., Spieβ, V., Breitzke, M., & Weber, M. E. (1997). The youngest channel‐levee system of the Bengal Fan: Results from digital sediment echosounder data. Marine Geology, 141(1), 125‐145. https://doi.org/10.1016/S0025‐3227(97)00066‐2
Jegou, I., Savoye, B., Pirmez, C., & Droz, L. (2008). Channel‐mouth lobe complex of the recent Amazon Fan: The missing piece. Marine Geology, 252(1), 62–77. https://doi.org/10.1016/j.margeo.2008.03.004
Krishna, K., Bull, J., & Scrutton, R. (2001). Evidence for multiphase folding of the central Indian Ocean lithosphere. Geology, 29(8), 715–718 . https://doi.org/10.1130/0091‐7613(2001)029<0715:EFMFOT>2.0.CO;2
Krishna, K., Ismaiel, M., Srinivas, K., Rao, D. G., Mishra, J., & Saha, D. (2016). Sediment pathways and emergence of Himalayan source material in the Bay of Bengal. Current Science, 110(3), 363.
Krishna, K., Neprochnov, Y. P., Rao, D. G., & Grinko, B. (2001). Crustal structure and tectonics of the Ninetyeast Ridge from seismic and gravity studies. Tectonics, 20(3), 416–433.
Kuehl, S. A., Hariu, T. M., & Moore, W. S. (1989). Shelf sedimentation off the Ganges‐Brahmaputra river system: Evidence for sediment bypassing to the Bengal fan. Geology, 17(12), 1132–1135. https://doi.org/10.1130/0091‐7613(1989)017<1132:SSOTGB>2.3.CO;2 Li, Y., Clift, P. D., Böning, P., Blusztajn, J., Murray, R. W., Ireland, T., et al. (2018). Continuous Holocene input of river sediment to the
Indus Submarine Canyon. Marine Geology, 406, 159–176. https://doi.org/10.1016/j.margeo.2018.09.011
Lopez, M. (2001). Architecture and depositional pattern of the Quaternary deep‐sea fan of the Amazon. Marine and Petroleum Geology, 18(4), 479–486. https://doi.org/10.1016/S0264‐8172(00)00071‐4
Lupker, M., France‐Lanord, C., Lavé, J., Bouchez, J., Galy, V., Métivier, F., et al. (2011). A Rouse‐based method to integrate the chemical composition of river sediments: Application to the Ganga basin. Journal of Geophysical Research,
116(F4). https://doi.org/10.1029/2010JF001947
Manley, P. L., Pirmez, C., Busch, W., & Cramp, A. (1997). Grain‐size characterization of Amazon Fan deposits and comparison to seismic facies units. In Flood, R.D., Piper, D.J.W., Klaus, A., and Peterson, L.C. (Eds.), 1997 Proceedings of the Ocean Drilling Program, Scientific Results, 155, 53‐48. https://doi.org/10.2973/odp.proc.sr.155.202.1997
Marsset, T., Droz, L., Dennielou, B., & Pichon, E. (2009). Cycles in the architecture of the Quaternary Zaire turbidite system: A possible link with climate. External Controls on Deep‐Water Depositional Systems. SEPM Special Publication, 89–106.
Maslin, M., Knutz, P. C., & Ramsay, T. (2006). Millennial‐scale sea‐level control on avulsion events on the Amazon Fan. Quaternary Science Reviews, 25(23), 3338–3345. https://doi.org/10.1016/j.quascirev.2006.10.012
McNeill, L. C., Dugan, B., Backman, J., Pickering, K. T., Pouderoux, H. F., Henstock, T. J., et al. (2017). Understanding Himalayan erosion and the significance of the Nicobar Fan. Earth and Planetary Science Letters, 475, 134–142. https://doi.org/10.1016/j. epsl.2017.07.019
Michels, K. H., Suckow, A., Breitzke, M., Kudrass, H. R., & Kottke, B. (2003). Sediment transport in the shelf canyon“Swatch of No Ground” (Bay of Bengal). Deep Sea Research Part II: Topical Studies in Oceanography, 50(5), 1003–1022.
Milliman, J., & Farnsworth, K. (2011). Runoff, erosion, and delivery to the coastal ocean. River discharge to the coastal ocean: A global synthesis(pp. 13–69). Cambridge, UK: Cambridge University Press.
Mitchum, R. Jr., Vail, P., & Sangree, J. (1977). Seismic stratigraphy and global changes of sea level, Part 6: Stratigraphic interpretation of seismic reflection patterns in depositional sequences. Payton, C.E. (Ed.), Seismic stratigraphy—Applications to hydrocarbon explora-tion. AAPG Memoir, 26, 117–133.
Pickering, K., & Hiscott, R. (2016). Deep marine systems: Processes, deposits, environments, tectonics and sedimentation. Wiley, Chichester, 2015, 657.
Picot, M., Droz, L., Marsset, T., Dennielou, B., & Bez, M. (2016). Controls on turbidite sedimentation: Insights from a quantitative approach of submarine channel and lobe architecture (Late Quaternary Congo Fan). Marine and Petroleum Geology, 72, 423–446. https://doi.org/ 10.1016/j.marpetgeo.2016.02.004
Piper, D. J. W., Flood, R. D., Cisowski, S., Hall, F., Manley, P. L., Maslin, M., Mikkelsen, N., & Showers, W. (1997). Synthesis of stratigraphic correlations of the Amazon fan. In R. D. Flood, D. J. W. Piper, A. Klaus, & L. C. Peterson (Eds.), Proc. ODP, Sci. Results (Vol. 155, pp. 595–609). College Station, TX: Ocean Drilling Program. https://doi.org/10.2973/odp.proc.sr.155.245.1997
Pirmez, C., Hiscott, R. N., & Kronen, J. K. Jr. (1997). Sandy turbidite successions at the base of channel‐levee systems of the Amazon Fan revealed by FMS logs and cores: Unraveling the facies architecture of large submarine fans. In R. D. Flood, D. J. W. Piper, A. Klaus, & L. C. Peterson (Eds.), Proc. ODP, Sci. Results (Vol. 155, pp. 7–33). College Station, TX: Ocean Drilling Program. https://doi.org/10.2973/odp. proc.sr.155.201.1997
Geologists), 92, 107–131.
Schwenk, T., Spieß, V., Breitzke, M., & Hübscher, C. (2005). The architecture and evolution of the Middle Bengal Fan in vicinity of the active channel–levee system imaged by high‐resolution seismic data. Marine and Petroleum Geology, 22(5), 637–656. https://doi.org/ 10.1016/j.marpetgeo.2005.01.007
Schwenk, T., Spieß, V., Hübscher, C., & Breitzke, M. (2003). Frequent channel avulsions within the active channel–levee system of the middle Bengal Fan—An exceptional channel–levee development derived from Parasound and Hydrosweep data. Deep Sea Research Part II: Topical Studies in Oceanography, 50(5), 1023–1045. https://doi.org/10.1016/S0967‐0645(02)00618‐5
Spieß, V., Hübscher, C., Breitzke, M., Böke, W., Krell, A., von Larcher, T., et al. (1998). Report and preliminary results of R/V Sonne cruise 125, Cochin–Chittagong, 17.10.‐17.11.97: Bremen, 128 p.
Spieß, V., Schwenk, T., Bartels, T., Blanz, T., Etourneau, J., Gainusa‐Bogdan, A., et al. (2006). Cruise Report RV Sonne cruise 188‐1, Singapore‐Chittagong, 06.06‐04.07.2006: Bremen, 72 p.
Stow, D. A., Amano, K., Batson, B., Brass, G. W., Corrigan, J., Raman, C., et al. (1990). 31. Sediment facies and processes on the distal Bengal Fan, Leg 116. Cochran, JR, Stow, DAV, et al. Proceedings of the Ocean Drilling Project, Leg, 116, 377‐396.
Tada, R., Zheng, H., & Clift, P. D. (2016). Evolution and variability of the Asian monsoon and its potential linkage with uplift of the Himalaya and Tibetan Plateau. Progress in Earth and Planetary Science, 3(1), 1–26. https://doi.org/10.1186/s40645‐016‐0080‐y Von der Borch, C. C., & Sclater, J. C. (1974). Initial reports of the Deep Sea Drilling Project Leg 22, (p. 890). Washington DC: US Government
Printing Office.
Weber, M. E., Lantzsch, H., Dekens, P., Das, S. K., Reilly, B. T., Martos, Y. M., et al. (2018). 200,000 years of monsoonal history recorded on the lower Bengal Fan—Strong response to insolation forcing. Global and Planetary Change, 166, 107–119. https://doi.org/10.1016/j. gloplacha.2018.04.003
Weber, M. E., & Reilly, B. T. (2018). Hemipelagic and turbiditic deposits constrain lower Bengal Fan depositional history through Pleistocene climate, monsoon, and sea level transitions. Quaternary Science Reviews, 199, 159–173. https://doi.org/10.1016/j. quascirev.2018.09.027
Weber, M. E., Wiedicke, M. H., Kudrass, H. R., Hübscher, C., & Erlenkeuser, H. (1997). Active growth of the Bengal Fan during sea‐level rise and highstand. Geology, 25(4), 315–318. https://doi.org/10.1130/0091‐7613(1997)025<0315:AGOTBF>2.3.CO;2
Weber, M. E., Wiedicke‐Hombach, M., Kudrass, H. R., & Erlenkeuser, H. (2003). Bengal Fan sediment transport activity and response to climate forcing inferred from sediment physical properties. Sedimentary Geology, 155(3–4), 361–381. https://doi.org/10.1016/S0037‐ 0738(02)00187‐2