HAL Id: hal-00295725
https://hal.archives-ouvertes.fr/hal-00295725
Submitted on 12 Aug 2005
HAL is a multi-disciplinary open access
archive for the deposit and dissemination of
sci-entific research documents, whether they are
pub-lished or not. The documents may come from
teaching and research institutions in France or
abroad, or from public or private research centers.
L’archive ouverte pluridisciplinaire HAL, est
destinée au dépôt et à la diffusion de documents
scientifiques de niveau recherche, publiés ou non,
émanant des établissements d’enseignement et de
recherche français ou étrangers, des laboratoires
publics ou privés.
The Indian summer monsoon rainfall: interplay of
coupled dynamics, radiation and cloud microphysics
P. K. Patra, S. K. Behera, J. R. Herman, S. Maksyutov, H. Akimoto, Y.
Yamagata
To cite this version:
P. K. Patra, S. K. Behera, J. R. Herman, S. Maksyutov, H. Akimoto, et al.. The Indian summer
monsoon rainfall: interplay of coupled dynamics, radiation and cloud microphysics. Atmospheric
Chemistry and Physics, European Geosciences Union, 2005, 5 (8), pp.2181-2188. �hal-00295725�
Atmos. Chem. Phys., 5, 2181–2188, 2005 www.atmos-chem-phys.org/acp/5/2181/ SRef-ID: 1680-7324/acp/2005-5-2181 European Geosciences Union
Atmospheric
Chemistry
and Physics
The Indian summer monsoon rainfall: interplay of coupled
dynamics, radiation and cloud microphysics
P. K. Patra1, S. K. Behera1, J. R. Herman2, S. Maksyutov1, H. Akimoto1, and T. Yamagata3,1
1Frontier Research Center for Global Change/JAMSTEC, Yokohama 2360001, Japan 2NASA Goddard Space Flight Center, Greenbelt, Maryland 20771, USA
3Dept. Earth and Planetary Science, University of Tokyo, Tokyo 113-0033, Japan
Received: 28 January 2005 – Published in Atmos. Chem. Phys. Discuss.: 9 May 2005 Revised: 22 July 2005 – Accepted: 5 August 2005 – Published: 12 August 2005
Abstract. The Indian summer monsoon rainfall (ISMR), which has a strong connection to agricultural food produc-tion, has been less predictable by conventional models in re-cent times. Two distinct years 2002 and 2003 with lower and higher July rainfall, respectively, are selected to help un-derstand the natural and anthropogenic influences on ISMR. We show that heating gradients along the meridional mon-soon circulation are reduced due to aerosol radiative forcing and the Indian Ocean Dipole in 2002. An increase in the dust and biomass-burning component of the aerosols through the zonal monsoon circulation resulted in reduction of cloud droplet growth in July 2002. These conditions were opposite to those in July 2003 which led to an above average ISMR. In this study, we have utilized NCEP/NCAR reanalyses for meteorological data (e.g. sea-surface temperature, horizontal winds, and precipitable water), NOAA interpolated outgo-ing long-wave radiation, IITM constructed all-India rainfall amounts, aerosol parameters as observed from the TOMS and MODIS satellites, and ATSR fire count maps. Based on this analysis, we suggest that monsoon rainfall prediction models should include synoptic as well as interannual vari-ability in both atmospheric dynamics and chemical composi-tion.
1 Introduction
The Indian summer monsoon is a giant feedback system in-volving interactions between land, ocean, and atmosphere. Efforts to understand its behaviour are scientifically chal-lenging and date back to over a century (Walker, 1910; Bjerk-nes, 1969; Lighthill and Pierce, 1981; Hastenrath, 1988; Pant and Rupakumar, 1997; Webster et al., 1998). The Indian summer monsoon rainfall (ISMR), defined here as the
cumu-Correspondence to: P. K. Patra
lative rainfall over continental India during June-July-August (JJA), also has important implications for the socio-economic system of the subcontinent. For example, the domestic crop yield in India has traditionally been linked to the ISMR (Parthasarathy et al., 1988); the agricultural sector accounts for about a quarter of India’s gross domestic product and 60 percent of the labour force. The JJA rainfall in 2002 was only about 78% of the seasonal average (679.2 mm, for the period 1871–2002) (Parthasarathy et al., 1995). This resulted in almost a 40% drop in groundnut production according to AgJournal (http://www.agjournal.com) and a 13% reduction in rice production according to the Food and Agriculture Or-ganization of the United Nations (http://www.fao.org). This is one of the highest deficit monsoon rainfall years in the last hundred years, second only to 1972.
The dynamical link between below normal rainfall years and the positive phase of El Ni˜no/Southern Oscillation (ENSO) (see Webster et al., 1998, for a review) and the nega-tive phases of Indian Ocean Dipole (IOD) has been addressed earlier (Ashok et al., 2001) as has the high stability condi-tion over the Arabian Sea (Narayanan et al., 2004). These impact studies considered only the dynamical aspect of the Indian summer monsoon system (ISMS), as does the statis-tical ISMR prediction model employed by the Indian Mete-orological Department (IMD) (Gowariker et al., 1991; Ra-jeevan et al., 2004). However, statistical models for rain-fall prediction based on several dynamical predictors have not been successful in foreseeing the 2002 summer rainfall deficit (Rajeevan et al., 2004). The situation using numerical climate prediction models was also not encouraging for this particular monsoon prediction failure (discussed in Gadgil et al., 2002). Therefore, we believe the dynamical conditions related to Indian summer monsoon do not account fully for total seasonal precipitation. Thus, the focus of this study is to analyze the radiative and microphysical aspects of the ISMS arising from interannual variability in aerosol content over the Indian subcontinent.
2182 P. K. Patra et al.: Supression of monsoon rainfall by aerosols Aerosol particles (with residence times ranging from days
to weeks) can absorb or reflect incoming solar radiation to exert a large radiative cooling (up to 30 W m−2) at the earth’s
surface (Satheesh and Ramanathan, 2000). Recently, it has also been suggested that different aerosol types of continen-tal origin (e.g. dust, biomass burning) could affect the growth of cloud droplets and thereby the rainfall intensity (Rosen-feld et al., 2001; Andreae et al., 2004). All the above men-tioned processes could coherently affect the ISMS by reduc-ing evaporation from the water and land surfaces, weakenreduc-ing the pressure gradients between the African high and Tibetan low (zonal/transverse monsoon component) as well as the cross-equatorial/lateral circulation of the monsoon (ref. Web-ster et al., 1998), and inhibiting the growth of cloud droplets.
2 Materials and method
The aerosol index (for dust and smoke; positive values) ac-quired from the Total Ozone Mapping Spectrometer (TOMS) (Herman et al., 1997), are used in this study to depict the source and transport of aerosols. Several studies have shown that the TOMS AI is proportional to aerosol opti-cal depth (AOD) measured using different techniques over various parts of the world (Torres et al., 2002; source: ftp: //toms.gsfc.nasa.gov; accessed: May 2004). The all-India rainfall is constructed by the Indian Institute of Tropical Me-teorology (IITM), based on rain gauge measurements at 306 stations (http://www.tropmet.res.in, see Data link). For the spatial distribution and high frequency time series of rain-fall over our study region we have used the Tropical Rain-fall Measuring Mission (TRMM) satellite observations (ver-sion: 3B42; source: ftp://lake.nascom.nasa.gov). The me-teorological datasets (horizontal winds, surface temperature, precipitable water content) datasets from the NCEP/NCAR reanalysis and NOAA interpolated outgoing long-wave radi-ation (OLR) (Kalnay et al., 1996; source: http://www.cdc. noaa.gov) are used to depict the mean state of the atmo-sphere and its deviations during the two distinct years of 2002 and 2003. The analysis of these years is to a great extent restricted by the unavailability of simultaneous mi-crophysical data. The AOD and several aerosol parameters are from MODIS onboard the Terra satellite (King et al., 2003). The monthly global fire maps (night time only) are obtained from the ATSR World Fire Atlas (Algorithm 1), European Space Agency – ESA/ESRIN (via Galileo Galilei, Italy; http://dup.esrin.esa.int/ionia/).
3 Results and discussion
It is seen from the ISMR variability for the period 1871– 2003 and the ENSO index that the deficit ISMR years were strongly linked to the El Ni˜no (positive SST anomaly) years for the period 1871–1978 (Pearson’s correlation coefficient r=−0.43, sample size n=53). This coupling has weakened
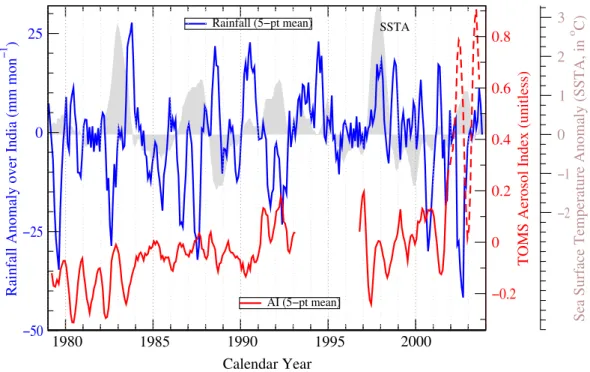
substantially (r=−0.15, n=15) in the past few decades (pe-riod: 1979–2002), with the most prominent deviation oc-curing in 2002, when a large negative ISMR anomaly was observed during a weak El Ni˜no event. A positive rainfall anomaly has also occurred in 1997 during the period of a strong El Ni˜no event (see Fig. 1).
Human activities have influenced the Earth’s climate sys-tem, an effect that has escalated over the past few decades (IPCC, 2001). Thus, the break down of the dynamical link between ISMR and ENSO could possibly be a manifesta-tion of chemistry-climate interacmanifesta-tion in the ‘Anthropocene’ era. At the same time, human capability to probe our at-mosphere has also increased significantly from the time of pioneering work by Gilbert Walker and Jacob Bjerknes. In Fig. 1, we show the variability in TOMS AI and rainfall over India, and SST anomaly (SSTA) in the equatorial Pa-cific Ocean (averaged for the area: 4◦N–4◦S and 150◦W– 90◦W). The interannual variations in JJA mean of AI and ISMR are strongly anti-correlated (r=−0.66, n=19) for the period 1978–2002. This anti-correlation has become increas-ingly prominent in recent years. Figure 1 also shows a grad-ual increase in AI over the Indian region, which is probably caused by increased industrialization in the developing world over the past 2–3 decades (Akimoto, 2003) and by increas-ing deforestation (Rosenfeld et al., 2001). An analysis of the long-term trends in individual monthly mean rainfall over India for the period 1870–2003 (from linear fits) produces negative slopes (average=0.09 mm/year) for June, July and September. A significant positive slope of similar value is ob-tained for August only. The cause for such long-term trends is beyond the scope of this study (only interannual variability in rainfall is discussed here). The climate response to aerosol direct and indirect effects in a transport-radiation-cloud mi-crophysics model also produces a reduction in precipitation over the Indian subcontinent during the period 1850 and 2000 (Takemura et al., 2005).
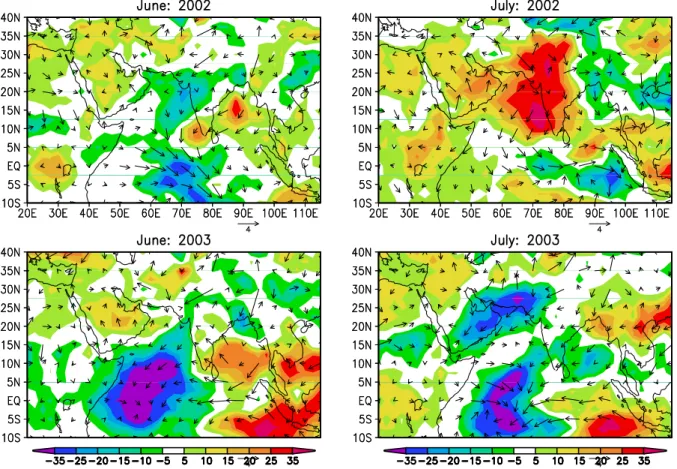
3.1 Salient features of the July 2002 and 2003 monsoons Now we focus our discussion on the years 2002 (56% less July rainfall than average) and 2003 (15% more July rain-fall than average) to demonstrate the possible impacts of at-mospheric dynamics, radiation and cloud microphysics on ISMR. Figure 2 illustrates the differences in OLR and hor-izontal winds during June and July of 2002 and 2003. As expected from the ISMR anomaly, the positive OLR (clearer sky) anomalies are widespread in July 2002 over the west-ern Indian Ocean and the Indian subcontinent, and relatively lower OLR values (cloudier sky) are found in the eastern Indian Ocean and southeast Asia. The opposite is true in 2003 with a much stronger amplitude. This East-West os-cillatory feature over the Indian Ocean is referred to as the Indian Ocean dipole (IOD) (Saji et al., 1999). The dis-tributions of sea-surface temperature (SST; Fig. S1, Sup-plement:
P. K. Patra et al.: Supression of monsoon rainfall by aerosols 2183
6 P. K. Patra et al.: Supression of monsoon rainfall by aerosols
−2 −1 0 1 2 3
Sea Surface Temperature Anomaly (SSTA, in
o C) 1980 1985 1990 1995 2000 Calendar Year −50 −25 0 25
Rainfall Anomaly over India (mm mon
−1 ) Rainfall (5−pt mean) −0.2 0 0.2 0.4 0.6 0.8
TOMS Aerosol Index (unitless)
AI (5−pt mean)
SSTA
Fig. 1. Month-mean timeseries of anomalies in TOMS measured Aerosol Index (AI; values greater than 0.4; area averaged: 70–90◦E,
10–35◦N) and IITM rainfall over India. The AI values are measured from Nimbus 7 and Earth Probe satellites for the periods November
1978–May 1993 and July 1996–August 2003, respectively. Since late 2001, Earth Probe TOMS instrument is experiencing wavelength-dependent calibration drift (http://toms.gsfc.nasa.gov); thus trends in AI are suspect after December 2001 but the relative shape can be trusted (shown as dashed-red line). The ENSO index based on Japan Meteorological Agency’s sea surface temperature (SST) anomalies are depicted in the background (grey shading; source: ftp://www.coaps.fsu.edu/pub). Area averaged monthly SST anomalies calculated for the equatorial Pacific Ocean (4o
N–4o
S and 150o
W–90o
W) are shown. A long-term average seasonal cycle is removed from the respective ISMR and AI timeseries to calculate the monthly anomalies. Five-month (5-pt) running mean of ISMR, AI and SST anomalies is implemented for the respective curves to smooth out the intraseasonal variations.
Atmos. Chem. Phys., 0000, 0001–9, 2005 www.atmos-chem-phys.org/acp/0000/0001/
Fig. 1. Month-mean timeseries of anomalies in TOMS measured Aerosol Index (AI; values greater than 0.4; area averaged: 70–90◦E, 10– 35◦N) and IITM rainfall over India. The AI values are measured from Nimbus 7 and Earth Probe satellites for the periods November 1978– May 1993 and July 1996–August 2003, respectively. Since late 2001, Earth Probe TOMS instrument is experiencing wavelength-dependent calibration drift (http://toms.gsfc.nasa.gov); thus trends in AI are suspect after December 2001 but the relative shape can be trusted (shown as dashed-red line). The ENSO index based on Japan Meteorological Agency’s sea surface temperature (SST) anomalies are depicted in the background (grey shading; source: ftp://www.coaps.fsu.edu/pub). Area averaged monthly SST anomalies calculated for the equatorial Pacific Ocean (4◦N–4◦S and 150◦W–90◦W) are shown. A long-term average seasonal cycle is removed from the respective ISMR and AI timeseries to calculate the monthly anomalies. Five-month (5-pt) running mean of ISMR, AI and SST anomalies is implemented for the respective curves to smooth out the intraseasonal variations.
5-2181-sp.pdf) suggest that the centres of surface warming (0.5–1.5◦C above average) were located around 80–90◦E and south of 5◦S during June–July 2002, and that tempera-tures over the Arabian Sea region were about the climatolog-ical average (∼28◦C). In June 2003, larger surface temper-atures (anomalies of up to +1.5◦C) were observed over the northern Arabian Sea. We suggest that this cooling anomaly over the northern Arabian Sea is a result of aerosol radiative forcing (higher AI and lower SST in 2002 and vice versa; ref. Fig. S2). Thus the IOD and aerosol forcing jointly caused the changes in the cross-equatorial SST gradients that could have modified the strength of the lateral monsoon circula-tion; i.e. weaker in 2002 and stronger in 2003. The Arabian Sea warming also supplied more water vapour to the ISMS in 2003 and greater rainfall was observed in July.
3.2 Monsoon rainfall and related aerosol parameters 3.2.1 Monthly anomalies and aerosol sources
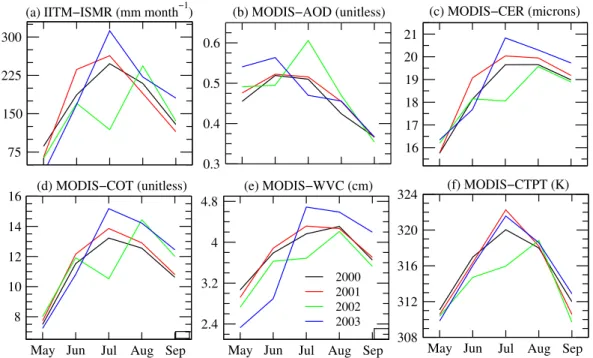
Figure 3 shows the interannual variation in ISMR during the May-September period along with several other physical-chemical parameters obtained from MODIS-Terra satellite
instruments in the period 2000–2003. In general, 2000 and 2001 represent fairly normal summer monsoon conditions (July rainfall deficit smaller than 10%), 2002 was a high deficit rainfall year, and 2003 was an excess rainfall year. The low (high) July rainfall corresponds well with more (less) AOD over India. However, the effects of aerosols on the radiation balance and cloud microphysics, to a large ex-tent, depend on their chemical properties. The analyses of daily TOMS-AI (not shown here) and chemistry-transport model (CTM) simulations of a CO-like tracer emitted from fires defined by monthly ATSR Global Fire Maps for the pe-riod 2000–2003 illustrate that the main source of aerosols over north-western India during the Indian summer is the Middle-East and north African region (Fig. S3). Figure S3 suggests that the aerosols (or biomass burning byproducts) of the Middle-East and north African origin are transported more efficiently to the Indian region during July 2002 com-pared to that in July 2003. This is caused mainly by the re-gional meteorology associated with dynamical oscillations changes and to a lesser extent by the change in pattern of aerosol emission (fire count distribution as the proxy). Aerosols of north African origin consist mainly of desert
2184 P. K. Patra et al.: Supression of monsoon rainfall by aerosols
P. K. Patra et al.: Supression of monsoon rainfall by aerosols 7
Fig. 2. Anomalies in the NOAA interpolated OLR (shaded) and surface wind vectors from the NCEP/NCAR reanalysis dataset. The
climatological mean are taken for the period 1979–2002 and then subtracted from June (left panels) and July (right panels) distributions of two distinct IOD years (2002: negative phase and 2003: positive phase) to calculate the anomalies.
www.atmos-chem-phys.org/acp/0000/0001/ Atmos. Chem. Phys., 0000, 0001–9, 2005
Fig. 2. Anomalies in the NOAA interpolated OLR (shaded) and surface wind vectors from the NCEP/NCAR reanalysis dataset. The climatological mean are taken for the period 1979–2002 and then subtracted from June (left panels) and July (right panels) distributions of two distinct IOD years (2002: negative phase and 2003: positive phase) to calculate the anomalies.
dust (no fires are detected by ATSR). Note that the observed AOD/AIs over India are typically higher in JJA months rel-ative to the drier seasons (e.g., May) indicating an external source of aerosols. This issue is addressed later in more de-tail using daily observations of rainfall and aerosols. 3.2.2 On cloud droplet growth and precipitation
It is further noted that aerosol parameters in July, the month most important for agriculture in India, differed significantly in 2002 and 2003. In July 2002, the ISMR was only about 44% of climatological average, the AOD was highest and had a greater component of biomass burning products, CER was smallest, and COT and WVC were lowest over the Indian re-gion. On the contrary, all the physical-chemical parameters in July 2003 were out of phase with those in 2002 (Fig. 3c–f). The aerosol parameters appear to be near their averages dur-ing 2000 and 2001. The reduction of cloud-droplet growth in July 2002 is suggested to be an effect of the aerosols on cloud microphysical properties. Rosenfeld et al. (2001) and An-dreae et al. (2004) have clearly demonstrated that aerosols of desert dust and biomass burning origin inhibit cloud droplet growth; they thereby cause an increase in the droplet
res-idence time, so that there is a lower probability of warm rain as the cloud droplets attain higher altitude. These re-sults elucidate the cloud microphysical impacts of continen-tal aerosols on the ISMS through the transverse monsoon circulation. Figure S4 clearly demonstrates that during July 2002 the maximum reductions in CER and ISMR occurred in the northwestern part of India, where the aerosols from the Middle-East and North Africa first enter the Indian summer monsoon domain.
In this context one may argue that water vapour availabil-ity might have played a greater role than the aerosol inhibi-tion of cloud droplet growth. However, recent analysis has suggested that liquid water content (LWC) within convective clouds is not the main control on increasing drop diameter (Andreae et al., 2004). They have clearly demonstrated that larger droplet sizes can be formed at lower LWC in cleaner environments. In fact our results indicate a similar situation. Though WVC were observed to be less in June 2003, we did not find a significant difference in rainfall compared to June 2002. On the other hand, from June to July in 2002, WVC increased slightly, CER decreased slightly, but ISMR decreased significantly. This suggests that IMSR is not very closely linked with water vapour availability.
P. K. Patra et al.: Supression of monsoon rainfall by aerosols 2185
8 P. K. Patra et al.: Supression of monsoon rainfall by aerosols
16 17 18 19 20 21 75 150 225 300
May Jun Jul Aug Sep 8 10 12 14 16 0.3 0.4 0.5 0.6 2000 2001 2002 2003 May Jun Jul Aug Sep 2.4
3.2 4 4.8
May Jun Jul Aug Sep 308
312 316 320 324
(a) IITM−ISMR (mm month−1) (b) MODIS−AOD (unitless) (c) MODIS−CER (microns)
(d) MODIS−COT (unitless) (e) MODIS−WVC (cm) (f) MODIS−CTPT (K)
Fig. 3. Monthly-mean time series for May-September months in the period 2000–2003 of (a) ISMR, regionally averaged values of
MODIS/Terra derived parameters: (b) aerosol optical depth (AOD), (c) combined phase cloud effective radius (CER), (d) cloud optical thickness (COT), (e) water vapour column (WVC) and (f) cloud top potential temperature (CTPT) are shown. The MODIS aerosol parame-ters are averaged over 10–35◦N, 70–90◦E region. Readers are referred to Fig. S4 for the patterns in CER and ISMR spatial distributions for
the period 2002–2004.
Atmos. Chem. Phys., 0000, 0001–9, 2005 www.atmos-chem-phys.org/acp/0000/0001/
Fig. 3. Monthly-mean time series for May-September months in the period 2000–2003 of (a) ISMR, regionally averaged values of MODIS/Terra derived parameters: (b) aerosol optical depth (AOD), (c) combined phase cloud effective radius (CER), (d) cloud optical thickness (COT), (e) water vapour column (WVC) and (f) cloud top potential temperature (CTPT) are shown. The MODIS aerosol parameters are averaged over 10–35◦N, 70–90◦E region. Readers are referred to Fig. S4 for the patterns in CER and ISMR spatial distributions for the period 2002–2004.
3.2.3 Possible effect of aerosol on radiation budget and monsoon dynamics
Next we shall focus on the role of dynamics on ISMR. The CTPT plots (Fig. 3f) suggest that heating of the middle tropo-sphere (650–500 hPa height) due to convective precipitation over India was lowest in 2002, and would further weaken the monsoon-Hadley circulation (a positive feedback process for sustenance of the ISMS). As discussed earlier, the convective precipitation amount depends on the strength of the south-to-north monsoon circulation (heating gradients) and warm rain cloud formation. The cloud top pressures were lower (i.e., lesser convection intensity) by about 100 hPa during July of 2002, compared to July of 2000, 2001 or 2003, over the In-dian domain. This indicates a larger role of convection for the maturity of the ISMS that produces the heaviest monthly-mean rainfall in July. In July 2002 anomalous surface winds were found to be northerly over the Arabian Sea (Fig. 1), a signature of a weaker monsoon circulation. During June– July 2002 a larger amount of absorbing aerosols were found over the northern Arabian Sea (Fig. S2), so that an anoma-lous cooling of the sea surface is expected (Fig. S1). This radiation balance condition, in addition to the negative IOD phase, is proposed as the mechanism for dynamical weaken-ing of the ISMS.
3.2.4 High frequency variation in aerosols, rainfall and other meteorological parameters: assertion of cause and effect
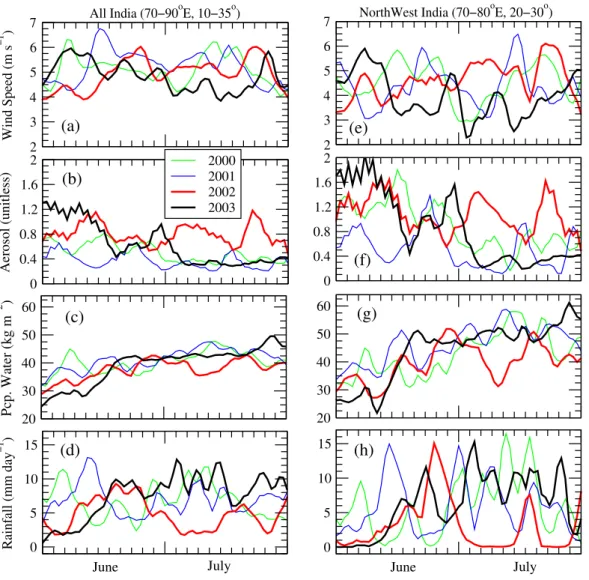
Lastly, we show the 3-day average variation in TRMM rain-fall, TOMS aerosol index, and NCEP/NCAR surface wind speed over All-India (70–90◦E, 10–35◦N) and the northwest
(NW) India (70–80◦E, 20–30◦N) region (Fig. 4). This is to
establish that the aerosol content over India during June and July was not directly linked to the rainfall amount, and is mainly transported through its western boundary. The over-all features in the plots for All-India and the NW-India are very similar, but the signals are much amplified over NW-India region. Note here that the aerosols from Africa-Arabia region first arrive in the NW-India region, and thus, larger variations are observed. It is well known that stronger sur-face winds help to produce aerosols in most environments (marine or land) (Parameswaran et al., 1995). Figure 4 also exhibits a some degree of correlation between wind speed and aerosol index. It should be clarified here that aerosols of marine origin are mostly sulphate and belong to the non-absorbing category in the definition of TOMS AI retrieval. In this study we have used only the absorbing aerosol index (positive values only), which mostly correspond to dust and smoke.
For further analysis we have used NCEP/NCAR winds for a few selected periods: Case 1. for stronger wind speeds
2186 P. K. Patra et al.: Supression of monsoon rainfall by aerosols
P. K. Patra et al.: Supression of monsoon rainfall by aerosols 9
0 5 10 15 Rainfall (mm day −1 ) 0 0.4 0.8 1.2 1.6 2 Aerosol (unitless) 2000 2001 2002 2003 0 5 10 15 0 0.4 0.8 1.2 1.6 2 2 3 4 5 6 7 Wind Speed (m s −1 ) 2 3 4 5 6 7 20 30 40 50 60 Pcp. Water (kg m −2 ) 20 30 40 50 60 NorthWest India (70−80oE, 20−30o)
June July June July
All India (70−90oE, 10−35o)
(g)
(a)
(b)
(c)
(f)
(e)
(d)
(h)
Fig. 4.Three-day average timeseries of wind speed, TOMS aerosol index, NCEP/NCAR precipitable water and Tropical Rainfall Measuring
Mission (TRMM) satellite rainfall over the Indian region (a, b, c, d) and north-west India (e, f, g, h) are shown for June and July months. The north-west Indian domain is assumed to be the gateway for the aerosol transport from the African-Arabian continents to the Indian domain. Tick marks are given every 3 days and major tick marks are at day 1 of month. Thick lines are used for 2002 and 2003 as those years are major focus of this study.
www.atmos-chem-phys.org/acp/0000/0001/ Atmos. Chem. Phys., 0000, 0001–9, 2005
Fig. 4. Three-day average timeseries of wind speed, TOMS aerosol index, NCEP/NCAR precipitable water and Tropical Rainfall Measuring
Mission (TRMM) satellite rainfall over the Indian region (a, b, c, d) and north-west India (e, f, g, h) are shown for June and July months. The north-west Indian domain is assumed to be the gateway for the aerosol transport from the African-Arabian continents to the Indian domain. Tick marks are given every 3 days and major tick marks are at day 1 of month. Thick lines are used for 2002 and 2003 as those years are major focus of this study.
and larger aerosol amount (14–16 July 2001 and 23–25 July 2002), and Case 2. for weaker wind speeds and lesser aerosol amount (2–4 July 2003 and 13–15 July 2003). This analysis suggest that very strong westerly winds prevailed over the NW of India (and its western side) during Case 1 periods at 850 hPa height (see Fig. S5). In July 2002 the winds speeds were typically higher on most days (Fig. 4e) over NW In-dia, and the aerosol content was greater over both NW India and All India regions. The strengthening of zonal circula-tion brings continental aerosol from Africa and the adjoining Arabian penninsular towards the NW-India region. It should be noted here that higher aerosol periods are more episodic than periods with stronger winds. For example, the aerosol index fell sharply after 25 July 2002 even though the winds were stronger (Fig. 4e, f).
It is also seen that on many occasions larger aerosol amounts and stronger wind speeds are coincident with less rainfall, particularly for the periods of Case 1. But no clear dependency of rainfall (Fig. 4d, h) and NCEP/NCAR reanal-ysed precipitable water amount in the atmosphere (Fig. 4c, g) can be established. For instance after 1 July 2002, the rainfall decreased dramatically (consistent with an increase in aerosol content presumably due to transport) but the pre-cipitable water amount stayed at a higher level till about 6 July 2002. The situation was similar for low rainfall amounts during 14–16 July 2001 where there was barely a sign of less precipitable water in the atmosphere when larger amounts of aerosol were present. These results suggest an apparent in-fluence of aerosols on cloud microphysics and a reduction in ISMR through inhibition of cloud droplet growth.
P. K. Patra et al.: Supression of monsoon rainfall by aerosols 2187 4 Conclusions and outlook
The above observations on atmospheric dynamics, chemi-cal compositions and radiation budgets, mainly during 2002 and 2003, lead us to suggest qualitatively that all three components interactively control the ISMR. The pathway for aerosol influence on July 2002 rainfall might have fol-lowed this sequence: 1) the prevailing dynamics (controlled by IOD/ENSO etc.) brought more aerosol to the northern Arabian Sea and NW India, 2) the thicker layer of absorb-ing aerosols produced SST coolabsorb-ing in the northern Arabian Sea, 3) the aerosols inhibited cloud-droplet growth and sup-pressed rainfall intensity. Negative IOD conditions in the equatorial Indian Ocean and cooler northern Arabian Sea weakened the south-to-north component of the monsoon cir-culation and thus there was less convective activity over In-dia. A quantitative estimate of their relative contributions can be attempted with the help of a general circulation model that includes cloud microphysics (e.g. Menon et al., 2002; Take-mura et al., 2005). TakeTake-mura et al. (2005) have clearly shown that from the pre-industrial period (year 1850) to the present day (year 2000), there has been a decrease in cloud-drop ef-fective radius as well as in precipitation due to an increase in aerosol loading over the Indian subcontinent. Their model results support our hypothesis of a reduction in ISMR due to aerosol-induced cloud microphysics. However, a more re-alistic representation of the interannual variability in aerosol distribution is necessary and will soon become possible as the characterization of aerosols become available over the In-dian monsoon domain such as those obtained using ground-based instruments (e.g. Babu et al., 2004) and from satel-lites. Our identification of an on aerosol-induced reduction of rainfall over India during the summer may provide critical information for monsoon rainfall prediction models. We also suggest an indirect role for dynamical oscillations, through changing the transport of aerosols into the Indian monsoon domain and in regional rainfall patterns, so that their total impact is larger than was thought previously.
Acknowledgements. P. K. Patra and S. K. Behera appreciate intense
discussion on ISMR prediction during the INDOCLIM symposium, which led us to this work. P. K. Patra acknowledges a series of dis-cussions with O. Wild at various stages of this work and invaluable help by correcting the language. We appreciate comments from K. Rupa Kumar on an early version of the manuscript. Thanks are also due to the MODIS, TOMS, TRMM, ATSR, NCEP/NCAR reanalysis data, and NOAA OLR data processing team members. Edited by: W. Conant
References
Akimoto, H.: Global Air Quality and Pollution, Science, 302, 1716–1719, 2003.
Andreae, M. O., Rosenfeld, D., Artaxo, P., Costa, A. A., Frank, G. P., Longo, K. M., and Silva-Dias, M. A. F.: Smoking Rain Clouds over the Amazon, Science, 303(5662), 1337–1342, 2004. Ashok, K., Guan, Z., and Yamagata, T.: Impact of the Indian Ocean
Dipole on the Relationship between the Indian Monsoon Rainfall and ENSO, Geophys. Res. Lett., 28(23), 4499–4502, 2001. Babu, S. S., Moorthy, K. K., and Satheesh, S. K.: Aerosol
black carbon over Arabian Sea during intermonsoon and sum-mer monsoon seasons, Geophys. Res. Lett., 31, L06104, doi:10.1029/2003GL018716, 2004.
Bjerkens, J.: Atmospheric teleconnections from the equatorial Pa-cific, Monthly Weather Review, 97, 163–172, 1969.
Gadgil, S., Srinivasan, J., Nanjundiah, R. S., Kumar, K. K., Munot, A. A., and Rupa Kumar, K.: On forecasting the Indian summer monsoon: the intriguing season of 2002, Current Science, 83, 394–403, 2002.
Gowariker, V., Thapliyal, V., Kulsheshtra, S. M., Mandal, G. S., Sen Roy, N., and Sikka, D. R.: A power regression model for long range forecast of southwest monsoon rainfall over India, Mausam, 42, 125–130, 1991.
Hastenrath, S.: Prediction of Indian Monsoon Rainfall: Further Ex-ploration, J. Climate, 1(3), 298–305, 1988.
Herman, J. R., Bhartia, P. K., Torres, O., Hsu, C., Seftor, C., and Celarier, E.: Global distribution of UV-absorbing aerosol from Nimbus 7/TOMS data, J. Geophys. Res., 102(D14), 16 911– 16 922, 1997.
IPCC, Climate Change 2001: The Scientific Basis, Contribution of Working Group I to the Third Assessment Report of the Inter-governmental Panel on Climate Change, edited by: Houghton, J. T., Ding, Y., Griggs, D. J., Noguer, M., van der Linden, P. J., Dai, X., Maskell, K., and Johnson, C. A., Cambridge University Press, Cambridge, UK, 881, 2001.
Kalnay, E., Kanamitsu, M., Kistler, R., et al.: The NCEP/NCAR 40-Year Reanalysis Project, Bull. Amer. Meteor. Soc., 77, 437–471, 1996.
King, M. D., Menzel, W. P., Kaufman, Y. J., Tanr´e, D., Gao, B. C., Platnick, S., Ackerman, S. A., Remer, L. A., Pincus, R., and Hubanks, P. A.: Cloud and Aerosol Properties, Precipitable Water, and Profiles of Temperature and Humidity from MODIS, IEEE Trans. Geosci. Remote Sens., 41, 442–458, 2003. Lighthill, M. J. and Pierce, R. P.: Monsoon Dynamics, Cambridge
University Press, 1981.
Narayanan, M. S., Rao, B. M., Shah, S., Prasad, V. S., and Bhat, G. S.: Role of atmospheric stability over the Arabian Sea and the unprecedented failure of monsoon 2002, Current Science, 86, 938–947, 2004.
Pant, G. B. and Rupakumar, K.: Climates of south Asia, John Wiley Sons, pp. 320, 1997.
Parameswaran, K., Vijayakumar, G., Krishna Murthy, B. V., Kr-ishna Moorthy, K.: Effect of Wind Speed on Mixing Region Aerosol Concentrations at a Tropical Coastal Station, J. Appl. Meteorol., 34, 1392–1397, 1995.
Parthasarathy, B., Munot, A. A., and Kothawale, D. R.: Regression model for estimation of Indian food grain production from Indian summer rainfall, Agric. Forest Meteorol., 42, 167–182, 1988.
2188 P. K. Patra et al.: Supression of monsoon rainfall by aerosols
Parthasarathy, B., Munot, A. A., and Kothawale, D. R.: All In-dia monthly and seasonal rainfall series: 1871–1993, Theor. and Appl. Climatol., 49, 217–224, 1995.
Rajeevan, M., Pai, D. S., Dikshit, S. K., and Kelkar, R. R.: IMD’s new operational models for long-range forecast of southwest monsoon rainfall over India and their verification for 2003, Cur-rent Science, 86, 422–431, 2004.
Rosenfeld, D., Rudich, Y., and Lahav, R.: Desert dust suppress-ing precipitation: A possible desertification feedback loop, Proc. Nat., Acad. Sci., 98(11), 5975–5980, 2001.
Saji, N. H., Goswami, B. N., Vinayachandran, P. N., and Yamagata, T.: A dipole mode in the tropical Indian Ocean, Nature, 401, 360–363, 1999.
Satheesh, S. K. and Ramanathan, V.: Large differences in tropical aerosol forcing at the top of the atmosphere and Earth’s surface, Nature, 405, 60–63, 2000.
Takemura, T., Nozawa, T., Emori, S., Nakajima, T. Y., and Naka-jima, T.: Simulation of climate response to aerosol direct and in-direct effects with aerosol transport-radiation model, J. Geophys. Res., 110, D02202, doi:10.1029/2004JD005029, 2005.
Torres, O., Bhartia, P. K., Herman, J. R., Sinyuk, A., and Holben, B.: A long term record of aerosol optical thickness from TOMS observations and comparison to AERONET measurements, J. Atmos. Sci., 59, 398–413, 2002.
Walker, G. T.: Correlation in seasonal variations of weather, II. Memoirs of the Indian Meteorological Department, 21 (Part 2), 22–45, 1910.
Webster, P., Maga˜na, V., Palmer, T., Shukla, J., Thomas, R., Yanai, M., and Yasunari, T.: Monsoons: Processes, predictability, and the prospects for prediction, J. Geophys. Res., 103(C7), 14 451– 14 510, 1998.