HAL Id: inserm-02892433
https://www.hal.inserm.fr/inserm-02892433
Submitted on 7 Jul 2020
HAL is a multi-disciplinary open access archive for the deposit and dissemination of sci-entific research documents, whether they are pub-lished or not. The documents may come from teaching and research institutions in France or abroad, or from public or private research centers.
L’archive ouverte pluridisciplinaire HAL, est destinée au dépôt et à la diffusion de documents scientifiques de niveau recherche, publiés ou non, émanant des établissements d’enseignement et de recherche français ou étrangers, des laboratoires publics ou privés.
glomerular filtration rate in deceased donor renal
transplant recipients
Luciano da Silva Selistre, Sandrine Lemoine, Allyriane Dantec, Fanny Buron,
Vandréa Carla de Souza, Mariana Bertoldo, Carlos Eduardo
Poli-De-Figueiredo, Thomas Rimmelé, Olivier Thaunat, Lionel Badet, et al.
To cite this version:
Luciano da Silva Selistre, Sandrine Lemoine, Allyriane Dantec, Fanny Buron, Vandréa Carla de Souza, et al.. Comparison of creatinine-based equations for estimating glomerular filtration rate in deceased donor renal transplant recipients. PLoS ONE, Public Library of Science, 2020, 15 (4), pp.e0231873. �10.1371/journal.pone.0231873�. �inserm-02892433�
RESEARCH ARTICLE
Comparison of creatinine-based equations for
estimating glomerular filtration rate in
deceased donor renal transplant recipients
Luciano da Silva SelistreID1,2,3*, Sandrine Lemoine1,4,5, Allyriane Dantec6, Fanny Buron6,
Vandre´a Carla de Souza1,2,3, Mariana Bertoldo2, Carlos Eduardo Poli-de-Figueiredo7, Thomas Rimmele´5,8, Olivier Thaunat4,6,9, Lionel Badet4,10, Emmanuel Morelon4,6,9, Antoine Sicard4,9, Laurence Dubourg1,4,11
1 Ne´phrologie, Dialyse, Hypertension et Exploration Fonctionnelle Re´nale, Groupement Hospitalier Edouard
Herriot, Hospices Civils de Lyon, Lyon, France, 2 Universidade de Caxias do Sul—Programa de Po´s-Graduac¸ão em Ciências da Sau´de, Caxias do Sul, Brazil, 3 Hospital Geral de Caxias do Sul, Caxias do Sul, Brazil, 4 Universite´ Lyon 1, Lyon, France, 5 CarMeN: Cardiovasculaire, Me´tabolisme, Diabe´ tologie & Nutrition-INSERM U1060/Lyon 1, Lyon, France, 6 Service de Transplantation, Ne´phrologie et Immunologie Clinique, Hoˆpital Edouard Herriot, Lyon, France, 7 Pontifı´cia Universidade Cato´ lica do Rio Grande do Sul, Porto Alegre, Brazil, 8 Service d’anesthe´ sie-re´animation, hoˆpital Edouard-Herriot, Lyon, France, 9 Unite´ INSERM U1111, Lyon, France, 10 Service d’Urologie et Transplantation, Hoˆpital Edouard Herriot, Lyon, France, 11 Laboratoire de Biologie Tissulaire et d’inge´nierie The´rapeutique (LBTI), UMR 5305 CNRS, Universite´ Claude Bernard Lyon 1, Lyon, France
*lsselist@ucs.br
Abstract
Background
Estimating glomerular filtration rate (GFR) is important for clinical management in kidney transplantation recipients (KTR). However, very few studies have evaluated the perfor-mance of the new GFR estimating equations (Lund-Malmo¨ Revised–LMR, and Full Age Spectrum–FAS) in KTR.
Methods
GFR was estimated (eGFR) using CKD-EPI, MDRD, LMR, and FAS equations and com-pared to GFR measurement (mGFR) by reference methods (inuline urinary and iohexol plasma clearance) in 395 deceased-donor KTR without corticosteroids. The equations per-formance was assessed using bias (mean difference of eGFR and mGFR), precision (stan-dard deviation of the difference), accuracy (concordance correlation coefficient—CCC), and agreements (total deviation index—TDI). The area under receiver operating characteristic curves (ROC) and the likelihood ratio for a positive result were calculated.
Results
In the total population, the performance of the CKD-EPI, MDRD and FAS equations was significantly lower than the LMR equation regarding the mean [95%CI] difference in bias (-2.0 [-4.0; -1.5] versus 9.0 [7.5; 10.0], 5.0 [3.5; 6.0] and 10.0 [8.5; 11.0] mL/min/1.73m2, P<0.005) and TDI (17.10 [16.41; 17.88], 25.91 [24.66; 27.16], 21.23 [19.48; 23.13] and
a1111111111 a1111111111 a1111111111 a1111111111 a1111111111 OPEN ACCESS
Citation: Selistre LdS, Lemoine S, Dantec A, Buron
F, de Souza VC, Bertoldo M, et al. (2020) Comparison of creatinine-based equations for estimating glomerular filtration rate in deceased donor renal transplant recipients. PLoS ONE 15(4): e0231873.https://doi.org/10.1371/journal. pone.0231873
Editor: Giuseppe Remuzzi, Istituto Di Ricerche
Farmacologiche Mario Negri, ITALY
Received: October 25, 2019 Accepted: March 26, 2020 Published: April 28, 2020
Copyright:© 2020 Selistre et al. This is an open access article distributed under the terms of the Creative Commons Attribution License, which permits unrestricted use, distribution, and reproduction in any medium, provided the original author and source are credited.
Data Availability Statement: The data may be
accessed through Dataverse, doi:10.7910/DVN/ SKSPSY.
Funding: The study had no specific public or
private financial support. In the study period, only the author L.S. benefited from a postdoctoral scholarship grant from the Brazilian government (CAPES Foundation, Ministry of Education of Brazil, grant number: 88881.156638/2017-01). The Brazilian funder had no role in study design, data
25.84 [24.16; 27.57], respectively). Concerning the CCC, all equation had poor agreement (<0.800) without statically difference between them. However, all equations had excellent area under the ROC curve (>0.900), and LMR equation had the best ability to correctly pre-dict KTR with mGFR<45 mL/min/1.73 m2(positive likelihood ratio: 8.87 [5.79; 13.52]).
Conclusion
Among a referral group of subjects KTR, LMR equation had the best mean bias and TDI, but with no significant superiority in other agreement tools. Caveat is required in the use and interpretation of PCr-based equations in this specific population.
1 Introduction
Accurate assessment of glomerular filtration rate (GFR) is important for the management of kidney transplant recipients (KTR).[1,2] In addition, lower GFR at 1 year after KTR is associ-ated with shorter allograft and patient survival [3–5] and 1-year post-KTR GFR is used as a prognosis factor.[5–7] Clinical practice guidelines therefore recommend monitoring kidney function to detect nephrotoxicity of immunosuppressive medications in order to identify early signs of rejection, to adjust drug dosage, and to estimate prognosis.[2,6]
Ideally, GFR is measured (mGFR) with an exogenous marker (inuline, iohexol, iothalamate, Cr EDTAetc.).[8] However, for technical reasons GFR is most often estimated (eGFR) using equations based on plama creatinine (PCr).(1, 2) Even though the performance of PCr equa-tions in chronic kidney disease (CKD) has been demonstrated, the best equation to estimate GFR after KTR is debated.[7,9,10] Indeed, the specific characteristics of KTR patients (immu-nosuppressive treatments, history of chronic kidney disease (CKD),decreased muscle mass etc.) can change the performance of PCr-based equations estimating GFR established in CKD patients.[7,11] Furthermore, the majority of 1-year post-KTR patients have a GFR below 60 mL/min/1.73m2.[9,11–13] Most of the time, GFR is estimated using the Chronic Kidney Dis-ease–Epidemiology Collaboration (CKD-EPI) or the Modification of Diet in Renal Disease Study (MDRD).[3,5,11,12,14–16] Recently, new PCr-based equations have been proposed to calculate eGFR in the general population, such as Lund-Malmo¨ Revised (LMR)[17] and Full Age Spectrum (FAS),[18] but their performance in the KTR population has yet to be evaluated.
The present study was conducted to assess the performance of the most commonly used PCr-based equations (CKD-EPI and MDRD) and the most recently published PCr-based equations (LMR and FAS) in a cohort of deceased-kidney-transplant recipient 1-year after graft.
2 Materials and methods
2.1 Study population
The study considered a cross-sectional retrospective sample of 395 patients with KTR from deceased donors in a regional center of Transplant (Clinical Immunology and
Transplanta-tion department, Edouard Herriot Hospital, Lyon, France). All patients were adults (� 18
years old) referred to undergo a routine GFR measurement one year after transplantation between June 2009 and June 2015. At that time the immunosuppression consisted of either tacrolimus in combination with mycophenolate sodium. Tacrolimus was C0monitored with a
therapeutic window of 5 to 10μg/L and mycophenolate sodium �1.9 mg/L. The exclusion
collection and analysis, decision to publish, or preparation of the manuscript.
Competing interests: No. The authors have
declared that no competing interests exist.
Abbreviations: AUC, area under the
receiver-operating curve; CCC, Concordance Correlation Coefficient; CI, confidence interval; CKD, chronic kidney disease; CKD-EPI, Chronic Kidney Disease– Epidemiology Collaboration equation; eGFR, estimated glomerular filtration rate; FAS, Full Age Spectrum; GFR, glomerular filtration rate; HPLC, High Performance Liquid Chromatography; IDMS, isotope-dilution mass spectrometry-calibrated; IQR, interquartile range; KTR, kidney transplantation recipients; LCMS, liquid chromatography mass spectrometry; LMR, Lund-Malmo¨ Revised; MDRD, Modification of Diet in Renal Disease Study equation; mGFR, measured glomerular filtration rate; PCr, plasma creatinine; PLR, likelihood ratio for a positive result; RMSE, root mean square error; ROC, receiver-operating curve.
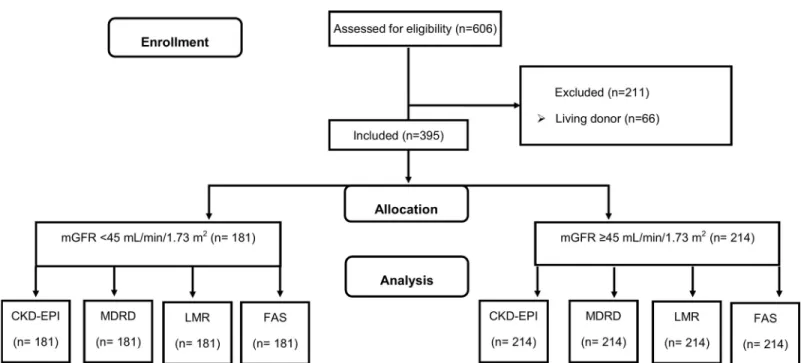
criteria were treatment by living donor, multiple transplantation (e.g. pancreas, liver), corticoid, cyclosporine A and trimethoprim treatments (Fig 1). All procedures were carried out in accor-dance with the ethical standards of the institutional and/or national research committee and with the 2013 Helsinki Declaration and its later amendments or with comparable ethical standards. Precisely, an appropriate informed consent was obtained from each participant or his/her legal representatives. The consent form included information on the procedure itself as well as on the possibility of later use of the data for research purposes. According to French law applicable at the time of the study, an observational study that did not change routine management of patients did not need to be declared or submitted to a research ethics board (Loi Huriet-Se´rusclat 88–1138, 20 December 1988 and its subsequent amendments, text available athttp://www.chu-toulouse.fr/ IMG/pdf/loihuriet.pdf). None of the transplant donors was from a vulnerable population and all donors or next of kin provided written informed consent that was freely given.
Reliability assessment and comparisons between the four eGFR equations (CKD-EPI, MDRD, LMR, and FAS) were carried out on different subgroup of mGFR levels: <45 and �45 mL/min/1.73m2.
2.2 Laboratory assessments
2.2.1 Measured GFR assessment. The mGFR was performed using standard methods
(urinary inulin or plama iohexol clearance). Briefly, urinary inulin clearance (GFRin) (Inutest 25%; Fresenius, Kabi, Austria) was performed with a continuous infusion of polyfructosan 40 mg/kg after a priming dose of 30 mg/kg. Water diuresis was induced by oral administration of 5 mL/kg of water followed by 3 mL/kg every 30 min combined with an intravenous infusion of 0.9% sodium chloride. This enabled the patients to spontaneously empty their bladder every 30 min. Three to four urine samples were collected, and a blood sample was drawn mid-way through each collection period. The clearance value, calculated by the usual UV/P formula, was the mean value of three to four clearance periods. Plasma and urine polyfructosan were
Fig 1. Flow chart of the study. GFR, glomerular filtration rate; CKD-EPI, chronic kidney disease epidemiology collaboration equation; MDRD, Modification of Diet in
Renal Disease Study; LMR, Lund-Malmo¨ revised equation; FAS: full age spectrum equation. https://doi.org/10.1371/journal.pone.0231873.g001
measured using the same enzymatic method, which has demonstrated very good specificity and reproducibility (within-run precision <1% and between-run precision <3.5%).[19]
Iohexol plasma clearance (GFRio) was performed according to a standard technique that used a single-bolus injection. An IV injection of 6 mL of iohexol (Omnipaque 300 mg/mL; GE Healthcare SAS, Ve´lizy-Villacoublay, France) was administered, and blood samples were drawn from the contra lateral arm after 120, 180, and 240 min. The GFRio was calculated from the slope of plasma concentrations using a 1-compartment model corrected using the Bro ¨ch-ner-Mortensen formula. The results were expressed per 1.73 m2according to the Dubois for-mula. The serum iohexol concentration was measured by High Performance Liquid
Chromatography (HPLC). External quality control was provided by Equalis (Uppsala, Swe-den) every 3 months.
In our service with a sample of 140 non-KTR patients (unpublished data), the adjustment equation by Passing-Bablok regression [20] to GFRio versus GFRin was: GFRio = 0.92 x GFRin + 4.50. The concordance correlation coefficient was 0.970 [IC 95%: 0.960; 0.980]. Therefore, we assume that the 2 techniques are similar.
2.2.2 Plasma creatinine measurement. All PCr measurements were performed using
enzymatic method traceable to the National Institute of Standards and Technology (IDMS, isotope-dilution mass spectrometry-calibrated). PCr is expressed in mg/dL.
2.3 Estimating GFR equations
All equations that are based on PCr-IDMS standardized methods were considered in the pres-ent study (Table 1).[17,18,21,22]
2.4 Statistical analyses
Bias (mean difference between eGFR and mGFR), precision (as the standard deviation [SD]) were by Deming Regression analysis. The accuracy was assessed using the root mean square error (RMSE) and the percentage of estimates within±30% of the mGFR (P30).
Table 1. Equations used to estimate glomerular filtration rate (mL/min/1.73m2).
Name GFR estimating equations (eGFR in mL/min/1.73 m2) CKD-EPI� Female; PCr � 0:7; eGFR ¼ 144xPCr 0:7 � �0:329 x ½0:993�Age Female; PCr > 0:7; eGFR ¼ 144xPCr 0:7 � �1:209 x ½0:993�Age Male; PCr � 0:9; eGFR ¼ 141 xPCr 0:9 � � 0:411 x ½0:993�Agex 1:159 if black�½ � Male; PCr > 0:9; eGFR ¼ 141 xPCr 0:9 � � 1:209 x ½0:993�Agex 1:159 if black�½ �
MDRD� eGFR = 175 x (PCr)−1.154x age−0.203x [0.742 if female] x [1.159 if black�]
LMR eGFR = ex−0.0158×Age+0.438×ln (Age)
Female &PCr < 1.7: X = 2.50 + 0.0121 × (1.7−PCr) Female&PCr � 1:7 : X ¼ 2:50 0:926 �ln PCr 1:7 � Male &PCr < 2.0: X = 2.56 + 0.00968 × (2.0−PCr) Male&PCr � 2:0 : X ¼ 2:56 0:926 �ln PCr 2:0 �
FAS 2 �Age � 40 : eGFR ¼ 107:3 xQ PCr
Age > 40 : eGFR ¼ 107:3 xQ PCrx 0:988
Age 40
with Q = 0.9 mg/dL in Male and 0.7 mg/dL in Female
Abbreviations: PCr: Plasma Creatinine; CKD-EPI: Chronic Kidney Disease–Epidemiology Collaboration; MDRD: Modification of Diet in Renal Disease Study; LMR: Lund-Malmo¨ Revised; FAS: Full Age Spectrum.
�according to French recommendation the correction coefficient in Black people should not be used in European
population[19]. To convert creatinine values toμmol/L, multiply by 88.4. https://doi.org/10.1371/journal.pone.0231873.t001
The Total Deviation Index (TDI), Bland-Altman analysis and the Concordance Correlation Coefficient (CCC) were used to assess agreement between each eGFR and mGFR. The total deviation index (TDI) is a measure that captures a large proportion of data within a boundary for allowed observer’s differences. The empirical TDI was calculated for a theoretical TDI of 10% and a coverage probability of 90%. For TDI, small values (nearing zero) imply high agree-ment. The ideal situation would be a TDI of <10%, meaning that 90% of eGFR values fall within±10% of mGFR, a much smaller margin of error.[9,23] The relationship between mGFR and eGFR were illustrated using a Deming regression and the Bland-Altman scatterplot (difference mean eGFR—mGFR versus mGFR) with regression lines to limits of agreement (2.5%; 97.5% LoAs). The CCC quantifies the agreement ranging that combines meaningful components of accuracy and precision from -1 to 1, with perfect agreement at 1. CCC has the following classification according to strength of agreement: >0.990 almost perfect, 0.950– 0.990 substantial, 0.900–0.949 moderate, and <0.900 poor. [9,23] We used logarithmic trans-formation by CCC because the heterogeneity of the difference increased with mGFR value.
The area under the receiver-operating curve (AUC) with logistic regression was used to determine the ability of the equations estimating GFR to discriminate between patients with mGFR <45mL/min/1.73 m2. We used the likelihood ratio for a positive result as supplemen-tary analysis of receiver-operating curve (ROC). The likelihood ratio for a positive result (PLR) is = sensitivity/ (1-specificity). A PLR >10.0 indicates that the test result has a large effect; PLR 5.0–10.0 indicates that the test has a moderate effect and PLR <5.0 indicates a small effect on the probability of detect disease.
The 95% confidence intervals (CIs) were calculated using the bootstrap method BCa (2,000 bootstraps). P30values were compared using Cochran Q with pairwise McNemar test. AUCs
were compared using bootstrapping method.
TheHolm-Bonferroni method was used to correct for multiple comparisons and strongly controls the family-wise error rate at level alpha. The nominalp-value used to conclude to a statistical significance was <0.005 to bias, P30and ROC area.
The analyses were performed with R for Windows, version 3.4.4 (R-Cran project,http:// cran.r-project.org/).
3 Results
3.1 Characteristics of the study population
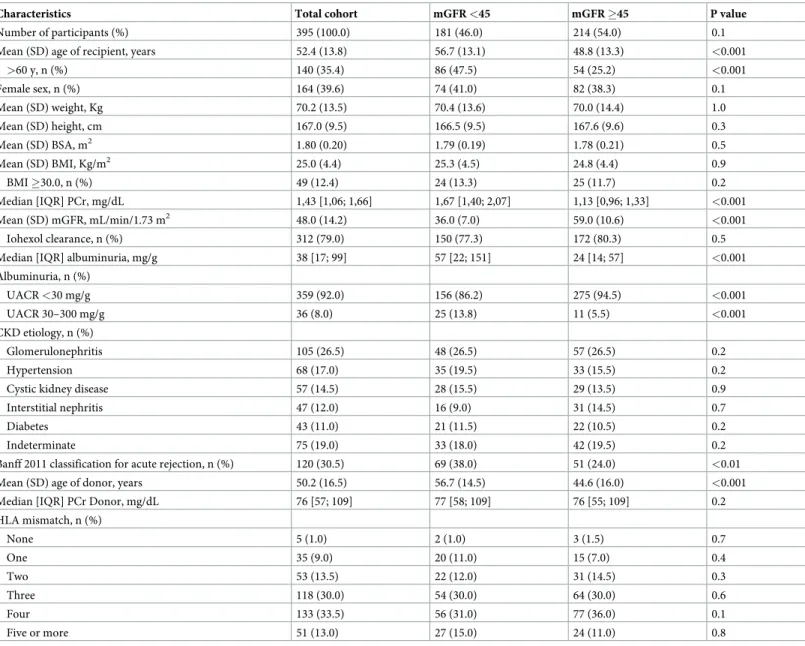
In the 395 KTR, the mean (SD) age was 52.4 (13.8) years and 39.6% of participants were women. The GFRio was used in 328 (79.2%) of the GFR measurements and mean of (SD) mGFR was 48.0 (15.1) mL/min/1.73 m2; and ranged from 13 to 108 mL/min/1.73 m2. Among all KTR 76.5% had 3 or more HLA mismatches with 120 (30.5%) had one or several acute rejection episodes (Table 2).
3.2 Performance according to equation
In the total cohort, the LMR equation performed better than CKD-EPI, MDRD, and FAS equations regarding the mean bias [95%CI] (-2.0 [-4.0; -1.5] versus 9.0 [7.5; 10.0], 5.0 [3.5; 6.0], and 10.0 [8.5; 11.0] mL/min/1.73 m2). The MDRD, CKD-EPI, and FAS equations overes-timated the mGFR, whereas the LMR equation underesoveres-timated mGFR in the total population and subgroups (Fig 2andTable 3).
LMR equation was better than CKD-EPI, MDRD and FAS regarding accuracy P30(85.5
[82.0; 89.0] vs. 70.0 [65.5; 75.0], 81.0 [77.0; 85.0] and 70.5 [65.5; 74.0] respectively, P<0.001, respectively) (Table 3). However, all equations had similar RMSE (Table 3).
In KTR with mGFR <45 mL/min/1.73 m2, the LMR equation was superior to CKD-EPI and FAS regarding mean bias [95%CI] (-2.0 [-3.0; -0.5] versus 4.5 [3.0; 6.0] and 7.0 [6.0; 8.5] mL/min/1.73 m2) and accuracy P30[95%CI] (82.0 [75.0; 87.0] vs. 70.5 [63.0; 76.0], and 66.5
[59.0; 72.5], P <0.005) (Table 3). However, LMR was similar MDRD equation in mean bias (2.5 [1.0; 4.0]) and P30(79.0 [72.0; 83.5]).
Results are similar whatever the method used (urinary inulin or plasmatic iohexol clear-ance) even if LMR performance is slightly better compared to MDRD with inulin clearance (S1–S3Tables).
Table 2. Characteristics of the kidney transplanted recipients.
Characteristics Total cohort mGFR <45 mGFR �45 P value
Number of participants (%) 395 (100.0) 181 (46.0) 214 (54.0) 0.1
Mean (SD) age of recipient, years 52.4 (13.8) 56.7 (13.1) 48.8 (13.3) <0.001
>60 y, n (%) 140 (35.4) 86 (47.5) 54 (25.2) <0.001 Female sex, n (%) 164 (39.6) 74 (41.0) 82 (38.3) 0.1 Mean (SD) weight, Kg 70.2 (13.5) 70.4 (13.6) 70.0 (14.4) 1.0 Mean (SD) height, cm 167.0 (9.5) 166.5 (9.5) 167.6 (9.6) 0.3 Mean (SD) BSA, m2 1.80 (0.20) 1.79 (0.19) 1.78 (0.21) 0.5 Mean (SD) BMI, Kg/m2 25.0 (4.4) 25.3 (4.5) 24.8 (4.4) 0.9 BMI �30.0, n (%) 49 (12.4) 24 (13.3) 25 (11.7) 0.2 Median [IQR] PCr, mg/dL 1,43 [1,06; 1,66] 1,67 [1,40; 2,07] 1,13 [0,96; 1,33] <0.001 Mean (SD) mGFR, mL/min/1.73 m2 48.0 (14.2) 36.0 (7.0) 59.0 (10.6) <0.001 Iohexol clearance, n (%) 312 (79.0) 150 (77.3) 172 (80.3) 0.5
Median [IQR] albuminuria, mg/g 38 [17; 99] 57 [22; 151] 24 [14; 57] <0.001 Albuminuria, n (%) UACR <30 mg/g 359 (92.0) 156 (86.2) 275 (94.5) <0.001 UACR 30–300 mg/g 36 (8.0) 25 (13.8) 11 (5.5) <0.001 CKD etiology, n (%) Glomerulonephritis 105 (26.5) 48 (26.5) 57 (26.5) 0.2 Hypertension 68 (17.0) 35 (19.5) 33 (15.5) 0.2
Cystic kidney disease 57 (14.5) 28 (15.5) 29 (13.5) 0.9
Interstitial nephritis 47 (12.0) 16 (9.0) 31 (14.5) 0.7
Diabetes 43 (11.0) 21 (11.5) 22 (10.5) 0.2
Indeterminate 75 (19.0) 33 (18.0) 42 (19.5) 0.2
Banff 2011 classification for acute rejection, n (%) 120 (30.5) 69 (38.0) 51 (24.0) <0.01 Mean (SD) age of donor, years 50.2 (16.5) 56.7 (14.5) 44.6 (16.0) <0.001
Median [IQR] PCr Donor, mg/dL 76 [57; 109] 77 [58; 109] 76 [55; 109] 0.2
HLA mismatch, n (%) None 5 (1.0) 2 (1.0) 3 (1.5) 0.7 One 35 (9.0) 20 (11.0) 15 (7.0) 0.4 Two 53 (13.5) 22 (12.0) 31 (14.5) 0.3 Three 118 (30.0) 54 (30.0) 64 (30.0) 0.6 Four 133 (33.5) 56 (31.0) 77 (36.0) 0.1 Five or more 51 (13.0) 27 (15.0) 24 (11.0) 0.8
mGFR, measured glomerular filtration rate in mL/min/1.73m2; SD, standard deviation; IQR, interquartile range; UACR, urinary albumin-creatinine ratio; HLA,
Human leukocyte antigen. To convert creatinine values toμmol/L, multiply by 88.4; to convert UACR values to mg/mmol divide by 10. https://doi.org/10.1371/journal.pone.0231873.t002
3.3 Agreement analysis
In the total population, the LMR equations had the best TDI [95%CI] 17.10 [16.41; 17.88] (Table 3). This indicates that 90% of eGFR showed an error ranging from−17.10 to +17.10% when compared with the mGFR. In KTR with mGFR <45 mL/min/1.73 m2, LMR and MDRD equations were similar concerning to TDI (Table 3).
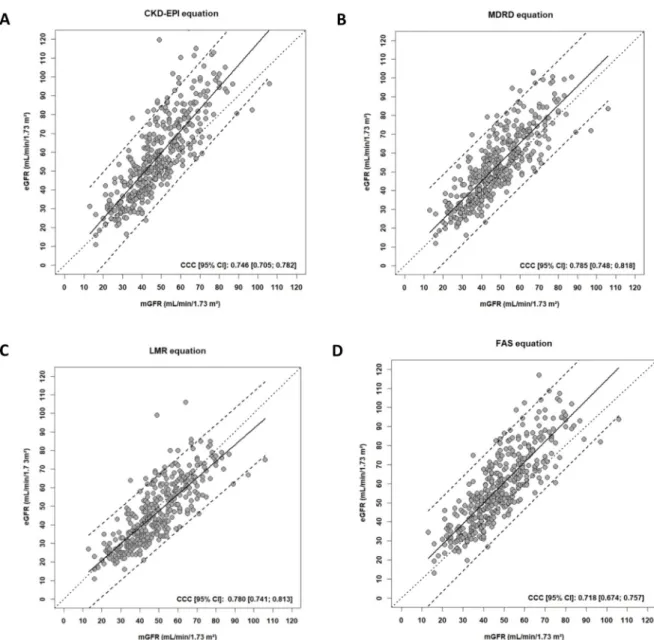
Concerning the CCC, all equation had poor agreement (<0.800) without statically differ-ence between them (Fig 3) (Table 3).
3.4 Receiver-operator characteristic curve analysis
There was no significant difference in the AUCs of the CKD-EPI, MDRD, LMR and FAS equa-tion (Table 4, p = 0.3) to mGFR <45 mL/min/1.73 m2. However, the LMR equation had the best positive likelihood ratio [95% CI]: 8.87 [5.79; 13.52] (Table 4andFig 4).
4. Discussion
The present study found that the new LMR equation is slightly but significantly better than other equations, especially in comparison to the KDIGO recommended equation (the CKD-EPI equation).
The CKD-EPI equation is recommended for estimating GFR in adults of any age in North America, Europe, and Australia.2The CKD-EPI equation was developed in 2009 in a North American and European population of 3,896 CKD (including non-CKD patients) with a wide age range (mean: 50 years) and a mean± SD mGFR (urinary iothalamate clearance) 68.0 ± 40
Fig 2. Bland and Altman plots showing the mean bias estimated GFR—measured GFR versus the measured GFR as reference standard in the cohort, using the different
equations: CKD-EPI (A), MDRD (B), LMR (C) and FAS (D). https://doi.org/10.1371/journal.pone.0231873.g002
mL/min/1.73 m2; but the proportion of KTR within the CKD-EPI internal validation datasets was only 4.0%.[2,22] In the present study, we found a similar performance of CKD-EPI to FAS, but inferior to MDRD and LMR irrespective of the level of mGFR.
The original MDRD study equation was developed in 1999 using 1,628 CKD patients (none were KTR) and urinary iothalamate clearance for mGFR.[21] A major limitation of this equa-tion in the general populaequa-tion is the underestimaequa-tion of GFR in patients with normal or sub-normal PCr concentration, which essentially translates to an overestimation of CKD
prevalence in patients with CKD stage I-II. Zahran et al. compared the performance of 14 PCr-based equations in KTR patients and reported heterogeneous results with mean bias varying from 3.3 to 25.3 mL/min/1.73 m2and P30accuracy from 32.5% to 70% when mGFR was < 60
mL/min/1.73m2.[24] These differences can be explained by sample size, demographic
Table 3. Bias, precision, and accuracy of the four equations estimating GFR.
CKD-EPI equation MDRD equation LMR equation FAS equation Total population (n = 395)
Mean bias, mL/min/1.73 m2 9.0 [7.5; 10.0]‡ 5.0 [3.5.0; 6.0]‡ -2.0 [-4.0; -1.5] 10.0 [8.5; 11.0]‡
SD 13.0 [11.7; 14.3] 12.0 [10.0; 14.1] 10.0 [9.2; 11.5] 12.8 [11.6; 16.2] 2.5%; 97.5% LoA, mL/min/1.73 m2 -16.5; 36.5 -19.0; 28.5 -22.0; 17.0 -15.0; 35.0 P30, % 70.0 [65.5; 75.0]‡ 81.0 [77.0; 85.0]‡ 85.5 [82.0; 89.0] 70.5 [65.5; 74.0]‡ Intercept 17.5 [15.0; 20.0] 18.0 [14.5; 22.5] 17.0 [14.5; 20.0] 16.5 [13.0; 21.5] Slope 0.54 [0.49; 0.58] 0.58 [0.48; 0.65] 0.55 [0.45; 0.62] 0.54 [0.45; 0.62] RMSE 0.175 [0.161; 0.193] 0.179 [0.165; 0.197] 0.179 [0.165; 0.197] 0.179 [0.165; 0.198] TDI 25.91 [24.66; 27.16] 21.23 [19.48; 23.13] 17.10 [16.41; 17.88] 25.84 [24.16; 27.57] CCC 0.746 [0.705; 0.782] 0.785 [0.748; 0.818] 0.780 [0.741; 0.813] 0.718 [0.674; 0.757] mGFR <45mL/min/1.73m2(n = 181)
Mean bias, mL/min/1.73 m2 4.5 [3.0; 6.0]‡ 2.5 [1.0; 4.0] -2.0 [-3.0; -0.5] 7.0 [6.0; 8.5]‡
SD 10.2 [9.0; 11.5] 6.5 [5.6; 7.8] 8.0 [7.3; 9.1] 9.4 [8.6; 10.5] 2.5%; 97.5% LoA, mL/min/1.73 m2 -15.0; 25.0 -15.5; 21.0 -19.0; 13.0 -11.5; 25.0 P30, % 70.5 [63.0; 76.0] ‡ 79.0 [72.0; 83.5] 82.0 [75.0; 87.0] 66.5 [59.0; 72.5]‡ Intercept 22.5 [19.5; 26.0] 22.0 [19.0; 25.5] 22.5 [19.5; 26.0] 21.0 [17.5; 24.0] Slope 0.33 [0.27; 0.40] 0.37 [0.29; 0.45] 0.42 [0.31; 0.51] 0.36 [0.29; 0.40] RMSE 0.173 [0.152; 0.203] 0.177 [0.155; 0.206] 0.177 [0.157; 0.208] 0.177 [0.155; 0.204] TDI 18.55 [16.20; 21.09] 15.80 [13.77; 17.95] 14.20 [12.91; 15.61] 19.30 [17.20; 21.44] CCC 0.550 [0.439; 0.629] 0.577 [0.449; 0.658] 0.535 [0.438; 0.620] 0.499 [0.406; 0.583] mGFR �45 mL/min/1.73m2(n = 214)
Mean bias mL/min/1.73 m2 12.5 [10.0; 14.0]‡ 6.5 [4.5; 8.0]‡ -3.0 [-4.0; -1.0] 12.5 [10.5; 15.0]‡
SD 14.2 [12.5; 16.0] 11.2 [8.4; 16.2] 11.6 [10.4; 13.8] 14.7 [12.1; 19.8] 2.5%; 97.5% LoA, mL/min/1.73 m2 -15.5; 40.0 -21.0; 34.0 -25.0; 20.0 -16.5; 41.5 P30, % 70.0 [63.0; 75.5]‡ 83.0 [77.0; 87.5]‡ 89.0 [83.5; 92.0] 73.0 [66; 78.0]‡ Intercept 35.0 [30.5; 40.0] 37.5 [31.5; 45.5] 35.5 [31.0; 41.0] 37.0 [29.5; 46.0] Slope 0.34 [0.26; 0.41] 0.33 [0.20; 0.43] 0.42 [0.31; 0.52] 0.30 [0.18; 0.42] RMSE 0.127 [0.115; 0.146] 0.130 [0.117; 0.150] 0.129 [0.117; 0.147] 0.131 [0.117; 0.150] TDI 31.18 [27.48; 34.80] 25.00 [20.00; 31.30] 18.85 [17.90; 19.86] 31.93 [26.45; 38.01] CCC 0.405 [0.325; 0.480] 0.494 [0.403; 0.575] 0.520 [0.432; 0.600] 0.383 [0.302; 0.459] Data are presented with 95% Confidence Intervals [95% CI]. Bias was defined as the mean difference between eGFR and mGFR. SD is the standard deviations of the difference between mGFR and eGFR. LoA: limits of agreement; P30: proportion of estimates 30% higher or lower than the mGFR; RMSE: root mean squared error for
the regression of eGFR on mGFR; CCC: concordance correlation coefficient. Confidence intervals were calculated by a bootstrap method BCa (2,000 bootstraps).
‡P < 0.005 favouring LMR;
characteristics, the various reference methods used for mGFR determination and non-stan-dardization of the PCr assay in some studies. Our population of KTR patients is comparable to those of other studies in terms of GFR level as the majority of reported KTR population have an eGFR<60 mL/min/1.73 m2after one year.[3,5,9,10,12,14,25–27]. In the present study, the mean mGFR one year after graft was close to the other KTR populations i.e. 48.0± 15.1 ml/min/1.73m2.[5,9–11,13] One study evaluated also the performance of MDRD in trans-planted patients of various organs (53% of KTR recipients) from 5 different clinical popula-tions and have reported a mean absolute bias of 10.6 (99.6% CI, 10.1–11.1) and a P30of 78.9%
Fig 3. Scatterplots showing, for each equation, the estimated GFR versus the measured GFR (in mL/min/1.73 m2) using the different equations CKD-EPI (A), MDRD (B), LMR (C) and FAS (D). The plain lines represent the line regression. The dashed lines represent the 95% predictive confidence limits. The dotted lines represent the perfect concordance. Abbreviations: mGFR, measured glomerular filtration rate; eGFR, estimated glomerular filtration rate; CCC, Concordance Correlation Coefficient, CKD-EPI, Chronic Kidney Disease Epidemiology Collaboration; MDRD, Modification of Diet in Renal Disease Study; LMR, Lund-Malmo¨ Revised; FAS: Full Age Spectrum; CI: confidence interval.
(99.6% CI, 76.9%-80.8%) which is close to the results obtained in the present study.[10] In addition, several previous studies reported superior performance of the MDRD equation com-pared to CKD-EPI in KTR.[10,11,13,27,28] The present study found that the performance of MDRD is slightly inferior to LMR equation, with a greater difference when inulin is the refer-ence method.
The LMR equation was developed in a Swedish Caucasian cohort including 850 individuals aged 18–95 years (median: 60 years) and using iohexol clearance plasma.[17] In recent publi-cation, the LMR equation showed the best performance in 263 KTR aged >60 years with a mGFR <60 mL/min/1.73m2.[26] In the present study, the LMR equation predicted GFR more precisely and accurately than MDRD, CKD-EPI, and FAS equations in the total KTR popula-tion. Several hypothesis could be given to explain this result: first, the possible difference of GFR determination method for the development of MDRD et LMR equations (urinary iotha-lamate clearance and plasma iohexol clearance, respectively) and secondly the fact that LMR equation was developed with the goal of improving estimations at low mGFR levels. [17]
The FAS equation has a simple structure compared with that of the MDRD, CKD-EPI, and LMR equations; it is based on standardization of PCr: PCr/Q, where Q is the median PCr of a healthy population to account for age and gender.[18] The equation had the same performance in children, adolescents, adults, and older persons in a population of 6,870 healthy and CKD patients (none were KTR) who had a mean mGFR (iohexol, iothalamate and inulin clearance) 67.2±13.3 mL/min/1.73m2. Among KTR herein, the FAS equation was inferior to all equa-tions probably due to the specific characteristics of the KTR population.
Finally, in the whole population and in all subgroups, none of the equations showed a P30
>90%, which is the KDOQI criteria of performance according to KDOQI recommendations [2] and all the equations had a CCC under 0.805,i.e. poor agreement demonstrating again that estimation of GFR with PCr based equations is inadequate and, in our opinion, mGFR using a reference method should be recommended in this specific population.
The strengths of the present study include the use of a population of KTR at one-year post-transplantation, the use of standardized assays for PCr; and the use of rigorous statistical meth-ods for diagnostic test evaluation using continuous variables. The study has, however, several limitations. First, although not collected, the source population is known to be predominantly European [11,25] and the results cannot be extended to other ethnic populations. Second, it was conducted in a single regional center. Third, the performance of eGFR equations in mGFR <30 or >90 mL/min/1.73 m2were not specifically examined because of the small num-ber of patients in these subgroups. Fourth, the use of PCr alone as endogenous marker (with-out cystatin C) has some well-known limitations in KTR.[6,13]
Table 4. Receiver-Operating Curve (ROC) analysis of equations estimating GFR to predict a mGFR <45mL/min/1.73m2(n = 191).
CKD-EPI equation MDRD equation LMR equation FAS equation
AUC 0.927 [0.901; 0.945] 0.924 [0.896; 0.947] 0.917 [0.892; 0.943] 0.927 [0.901; 0.945] Sensitivity 0.856 [0.803; 0.909] 0. 862 [0.810; 0.915] 0.778 [0.715; 0.841] 0.868 [0.817; 0.920] Specificity 0.851 [0.805; 0.897] 0.820 [0.770; 0.870] 0.912 [0.876; 0.949] 0.820 [0.770; 0.870] Positive predictive value 0.808 [0.750; 0.866] 0.778 [0.720; 0.838] 0.867 [0.812; 0.921] 0.780 [0.720; 0.840] Negative predictive value 0.890 [0.848; 0.931] 0.890 [0.848; 0.933] 0.849 [0.804; 0.894] 0.895 [0.853; 0.936] Positive likelihood ratio 5.70 [4.20; 7.90] 4.80 [3.61; 6.38] 8.87 [5.79; 13.52] 4.83 [3.64; 6.12] Negative likelihood ratio 0.17 [0.11; 0.25] 0.89 [0.85; 0.93] 0.24 [0.18; 0.32] 0.16 [0.11; 0.25]
Data are presented with 95% Confidence Intervals [95% CI]. AUC: the area under a receiver curve operating characteristic. Confidence intervals were calculated by a bootstrap method (2,000 bootstraps)
Fig 4. Receiver Operating Characteristic (ROC) analysis for the ability of the different GFR estimating formulas CKD-EPI, MDRD, LMR and FAS to detect mGFR< 45 mL/min/1.73 m2. Abbreviations: CKD-EPI, Chronic Kidney Disease–Epidemiology Collaboration; MDRD, Modification of Diet in Renal Disease Study;
LMR, Lund-Malmo¨ Revised; FAS: Full Age Spectrum; CI: confidence interval. https://doi.org/10.1371/journal.pone.0231873.g004
Conclusion
To our knowledge, the study is the first that compared FAS and LMR in kidney transplanta-tion. The present evaluation of four PCr-based equations suggests that the LMR has the best mean bias and TDI in 395 kidney transplant recipients, but with no significant superiority in other agreement tool. However, performance of all the studied formulas are quite poor in renal transplant patients compared to CKD population. Caveat is required when PCr-based equations is applied in this specific population. In our opinion, renal graft function requires a reference method of GFR measurement (eg. iohexol clearance).
Supporting information
S1 Table. Estimation of the bias (mean bias estimated–measure glomerular filtration rate) with equations according of the reference method Glomerular Filtration Rate (GFR) in the whole GFR category and in different GFR categories.
(DOCX)
S2 Table. Accuracy P30with equations according of the reference method method
Glomer-ular Filtration Rate (GFR) in the whole GFR category and in different GFR categories.
(DOCX)
S3 Table. The Total Deviation Index estimated (TDI) of the reference method Glomerular Filtration Rate (GFR) in the whole sample and in different GFR categories.
(DOC)
Author Contributions
Conceptualization: Luciano da Silva Selistre, Sandrine Lemoine, Allyriane Dantec, Vandre´a
Carla de Souza, Carlos Eduardo Poli-de-Figueiredo, Laurence Dubourg.
Data curation: Luciano da Silva Selistre, Allyriane Dantec, Vandre´a Carla de Souza, Olivier
Thaunat, Lionel Badet, Emmanuel Morelon, Antoine Sicard, Laurence Dubourg.
Formal analysis: Luciano da Silva Selistre, Vandre´a Carla de Souza, Mariana Bertoldo, Carlos
Eduardo Poli-de-Figueiredo, Thomas Rimmele´, Emmanuel Morelon, Laurence Dubourg.
Funding acquisition: Luciano da Silva Selistre, Emmanuel Morelon, Laurence Dubourg. Investigation: Luciano da Silva Selistre, Allyriane Dantec, Fanny Buron, Vandre´a Carla de
Souza, Lionel Badet, Emmanuel Morelon, Antoine Sicard, Laurence Dubourg.
Methodology: Luciano da Silva Selistre, Allyriane Dantec, Fanny Buron, Vandre´a Carla de
Souza, Carlos Eduardo Poli-de-Figueiredo, Olivier Thaunat, Antoine Sicard, Laurence Dubourg.
Project administration: Luciano da Silva Selistre, Vandre´a Carla de Souza, Emmanuel
More-lon, Antoine Sicard, Laurence Dubourg.
Resources: Luciano da Silva Selistre, Laurence Dubourg. Software: Luciano da Silva Selistre, Laurence Dubourg.
Supervision: Luciano da Silva Selistre, Sandrine Lemoine, Vandre´a Carla de Souza, Laurence
Dubourg.
Validation: Luciano da Silva Selistre, Mariana Bertoldo, Antoine Sicard, Laurence Dubourg. Visualization: Luciano da Silva Selistre, Laurence Dubourg.
Writing – original draft: Luciano da Silva Selistre, Vandre´a Carla de Souza, Laurence
Dubourg.
Writing – review & editing: Luciano da Silva Selistre, Vandre´a Carla de Souza, Laurence
Dubourg.
References
1. K/DOQI clinical practice guidelines for chronic kidney disease: evaluation, classification, and stratifica-tion. Am J Kidney Dis. 2002; 39(2 Suppl 1):S1–266. PMID:11904577
2. Group KDIGOKCW. KDIGO 2012 clinical practice guideline for the evaluation and management of chronic kidney disease. 2013; 3(1):1–150.
3. Salvadori M, Rosati A, Bock A, Chapman J, Dussol B, Fritsche L, et al. One-year posttransplant renal function is a strong predictor of long-term kidney function: results from the Neoral-MOST Observational Study. Transplant Proc. 2003; 35(8):2863–7.https://doi.org/10.1016/j.transproceed.2003.10.070
PMID:14697923
4. Kasiske BL, Israni AK, Snyder JJ, Skeans MA. The relationship between kidney function and long-term graft survival after kidney transplant. Am J Kidney Dis. 2011; 57(3):466–75.https://doi.org/10.1053/j. ajkd.2010.10.054PMID:21257243
5. Huang Y, Tilea A, Gillespie B, Shahinian V, Banerjee T, Grubbs V, et al. Understanding Trends in Kid-ney Function 1 Year after KidKid-ney Transplant in the United States. J Am Soc Nephrol. 2017; 28(8):2498– 510.https://doi.org/10.1681/ASN.2016050543PMID:28270413
6. Kidney Disease: Improving Global Outcomes Transplant Work G. KDIGO clinical practice guideline for the care of kidney transplant recipients. Am J Transplant. 2009; 9 Suppl 3:S1–155.
7. Knoll GA, Blydt-Hansen TD, Campbell P, Cantarovich M, Cole E, Fairhead T, et al. Canadian Society of Transplantation and Canadian Society of Nephrology commentary on the 2009 KDIGO clinical practice guideline for the care of kidney transplant recipients. Am J Kidney Dis. 2010; 56(2):219–46.https://doi. org/10.1053/j.ajkd.2010.05.004PMID:20659623
8. Soveri I, Berg UB, Bjork J, Elinder CG, Grubb A, Mejare I, et al. Measuring GFR: a systematic review. Am J Kidney Dis. 2014; 64(3):411–24.https://doi.org/10.1053/j.ajkd.2014.04.010PMID:24840668
9. Luis-Lima S, Marrero-Miranda D, Gonzalez-Rinne A, Torres A, Gonzalez-Posada JM, Rodriguez A, et al. Estimated Glomerular Filtration Rate in Renal Transplantation: The Nephrologist in the Mist. Transplantation. 2015; 99(12):2625–33.https://doi.org/10.1097/TP.0000000000000786PMID:
26247554
10. Shaffi K, Uhlig K, Perrone RD, Ruthazer R, Rule A, Lieske JC, et al. Performance of creatinine-based GFR estimating equations in solid-organ transplant recipients. Am J Kidney Dis. 2014; 63(6):1007–18.
https://doi.org/10.1053/j.ajkd.2014.01.436PMID:24703720
11. Buron F, Hadj-Aissa A, Dubourg L, Morelon E, Steghens JP, Ducher M, et al. Estimating glomerular fil-tration rate in kidney transplant recipients: performance over time of four creatinine-based formulas. Transplantation. 2011; 92(9):1005–11.https://doi.org/10.1097/TP.0b013e3182301602PMID:
22031008
12. Salvadori M, Rosati A, Bock A, Chapman J, Dussol B, Fritsche L, et al. Estimated one-year glomerular filtration rate is the best predictor of long-term graft function following renal transplant. Transplantation. 2006; 81(2):202–6.https://doi.org/10.1097/01.tp.0000188135.04259.2ePMID:16436963
13. Keddis MT, Amer H, Voskoboev N, Kremers WK, Rule AD, Lieske JC. Creatinine-Based and Cystatin C-Based GFR Estimating Equations and Their Non-GFR Determinants in Kidney Transplant Recipi-ents. Clin J Am Soc Nephrol. 2016; 11(9):1640–9.https://doi.org/10.2215/CJN.11741115PMID:
27340283
14. Stevens LA, Schmid CH, Greene T, Zhang YL, Beck GJ, Froissart M, et al. Comparative performance of the CKD Epidemiology Collaboration (CKD-EPI) and the Modification of Diet in Renal Disease (MDRD) Study equations for estimating GFR levels above 60 mL/min/1.73 m2. Am J Kidney Dis. 2010; 56(3):486–95.https://doi.org/10.1053/j.ajkd.2010.03.026PMID:20557989
15. White CA, Akbari A, Doucette S, Fergusson D, Knoll GA. Estimating glomerular filtration rate in kidney transplantation: is the new chronic kidney disease epidemiology collaboration equation any better? Clin Chem. 56(3):474–7.https://doi.org/10.1373/clinchem.2009.135111PMID:19959620
16. Murata K, Baumann NA, Saenger AK, Larson TS, Rule AD, Lieske JC. Relative performance of the MDRD and CKD-EPI equations for estimating glomerular filtration rate among patients with varied clini-cal presentations. Clin J Am Soc Nephrol. 2011; 6(8):1963–72.https://doi.org/10.2215/CJN.02300311
17. Bjork J, Grubb A, Sterner G, Nyman U. Revised equations for estimating glomerular filtration rate based on the Lund-Malmo Study cohort. Scand J Clin Lab Invest. 2011; 71(3):232–9.https://doi.org/10.3109/ 00365513.2011.557086PMID:21391777
18. Pottel H, Hoste L, Dubourg L, Ebert N, Schaeffner E, Eriksen BO, et al. An estimated glomerular filtra-tion rate equafiltra-tion for the full age spectrum. Nephrol Dial Transplant. 2016; 31(5):798–806.https://doi. org/10.1093/ndt/gfv454PMID:26932693
19. Dubourg L, Hadj-Aissa A, Ferrier B. Adaptation of an enzymatic polyfructosan assay to clinical practice. Anal Biochem. 2010; 405(2):266–8.https://doi.org/10.1016/j.ab.2010.06.016PMID:20541517
20. Passing H, Bablok. A new biometrical procedure for testing the equality of measurements from two dif-ferent analytical methods. Application of linear regression procedures for method comparison studies in clinical chemistry, Part I. J Clin Chem Clin Biochem. 1983; 21(11):709–20.https://doi.org/10.1515/cclm. 1983.21.11.709PMID:6655447
21. Levey AS, Bosch JP, Lewis JB, Greene T, Rogers N, Roth D. A more accurate method to estimate glo-merular filtration rate from serum creatinine: a new prediction equation. Modification of Diet in Renal Disease Study Group. Ann Intern Med. 1999; 130(6):461–70. https://doi.org/10.7326/0003-4819-130-6-199903160-00002PMID:10075613
22. Levey AS, Stevens LA, Schmid CH, Zhang YL, Castro AF 3rd, Feldman HI, et al. A new equation to esti-mate glomerular filtration rate. Ann Intern Med. 2009; 150(9):604–12. https://doi.org/10.7326/0003-4819-150-9-200905050-00006PMID:19414839
23. Porrini E, Ruggenenti P, Luis-Lima S, Carrara F, Jimenez A, de Vries APJ, et al. Estimated GFR: time for a critical appraisal. Nat Rev Nephrol. 2019; 15(3):177–90. https://doi.org/10.1038/s41581-018-0080-9PMID:30518813
24. Zahran A, Qureshi M, Shoker A. Comparison between creatinine and cystatin C-based GFR equations in renal transplantation. Nephrol Dial Transplant. 2007; 22(9):2659–68.https://doi.org/10.1093/ndt/ gfm243PMID:17470455
25. Fauvel JP, Hadj-Aissa A, Buron F, Morelon E, Ducher M. Performance of estimated glomerular filtration rates to monitor change in renal function in kidney transplant recipients. Nephrol Dial Transplant. 2013; 28(12):3096–100.https://doi.org/10.1093/ndt/gft047PMID:24064326
26. Heldal K, Midtvedt K, Hartmann A, Reisaeter AV, Heldal TF, Bergan S, et al. Estimated glomerular filtra-tion rate in stable older kidney transplant recipients-are present algorithms valid? A nafiltra-tional cross-sec-tional cohort study. Transpl Int. 2018; 31(6):629–38.https://doi.org/10.1111/tri.13137PMID:29453878
27. Masson I, Flamant M, Maillard N, Rule AD, Vrtovsnik F, Peraldi MN, et al. MDRD versus CKD-EPI equation to estimate glomerular filtration rate in kidney transplant recipients. Transplantation. 2013; 95 (10):1211–7.https://doi.org/10.1097/TP.0b013e318288caa6PMID:23511243
28. Earley A, Miskulin D, Lamb EJ, Levey AS, Uhlig K. Estimating equations for glomerular filtration rate in the era of creatinine standardization: a systematic review. Ann Intern Med. 2012; 156(11):785–95, W-270, W-1, W-2, W-3, W-4, W-5, W-6, W-7, W-8. https://doi.org/10.7326/0003-4819-156-6-201203200-00391PMID:22312131