Automated urinalysis: first experiences and a comparison
between the Iris iQ200 urine microscopy system, the Sysmex
UF-100 flow cytometer and manual microscopic particle
counting
Noushin Shayanfar, Ulrich Tobler, Arnold von Eckardstein and Lukas Bestmann*
Institute of Clinical Chemistry, University Hospital Zurich, Zurich, Switzerland
Abstract
Background: Automated analysis of insoluble urine components can reduce the workload of conventional microscopic examination of urine sediment and is possibly helpful for standardization. We compared the diagnostic performance of two automated urine sed-iment analyzers and combined dipstick/automated urine analysis with that of the traditional dipstick/ microscopy algorithm.
Methods: A total of 332 specimens were collected and analyzed for insoluble urine components by micro-scopy and automated analyzers, namely the Iris iQ200 (Iris Diagnostics) and the UF-100 flow cytometer (Sysmex).
Results: The coefficients of variation for day-to-day quality control of the iQ200 and UF-100 analyzers were 6.5% and 5.5%, respectively, for red blood cells. We reached accuracy ranging from 68% (bacteria) to 97% (yeast) for the iQ200 and from 42% (bacteria) to 93% (yeast) for the UF-100. The combination of dipstick and automated urine sediment analysis increased the sensitivity of screening to approxi-mately 98%.
Conclusions: We conclude that automated urine sed-iment analysis is sufficiently precise and improves the workflow in a routine laboratory. In addition, it allows sediment analysis of all urine samples and thereby helps to detect pathological samples that would have been missed in the conventional two-step procedure according to the European guidelines. Although it is not a substitute for microscopic sediment examina-tion, it can, when combined with dipstick testing, reduce the number of specimens submitted to microscopy. Visual microscopy is still required for some samples, namely, dysmorphic erythrocytes, yeasts, Trichomonas, oval fat bodies, differentiation of casts and certain crystals.
Clin Chem Lab Med 2007;45:1251–6.
*Corresponding author: Lukas Bestmann, Institute of Clinical Chemistry, University Hospital Zurich, Raemistrasse 100, 8091 Zurich, Switzerland Phone: q41-44-2552267, Fax: q41-44-2554590, E-mail: [email protected]
Keywords: automated analyzers; automated urine examination; flow cytometry; imaging system; urinal-ysis; urine sediment.
Introduction
Urine analyses are frequently performed on both hos-pitalized patients and outpatients to screen for dis-eases of the kidney and urinary tract, as well as for metabolic, cholestatic and hemolytic diseases (1–3). The traditional strategy recommended by the Euro-pean Urinalysis Guidelines (4) involves a two-step procedure, in which semi-quantitative dipstick tests are used in the first step to exclude urine samples without hemoglobin, leukocyte esterase activity, nitrite and protein from further analysis. In a second step, urine samples with indications for erythro-cyturia, leukoerythro-cyturia, bacteriuria or proteinuria are subjected to centrifugation to sediment insoluble components for further analysis by microscopy. The microscopic examination of urine for its cellular con-stituents is a time-consuming procedure requiring expert knowledge and is influenced by preanalytical and analytical processes such as centrifugation and discrepant interpretation of urine sediment structures by technicians, respectively (5). These limitations cause imprecision and inaccuracy (5, 6). Standardi-zation of urine analysis has been proposed in the 1995 National Committee for Clinical Laboratory standards (NCCLS) international guidelines and the 2000 Euro-pean Urinalysis Guidelines (4, 7).
Analyses of insoluble urine components on an automated urine microscopy analyzer (Iris iQ200; IRIS International, Inc., Chatsworth, CA, USA) or a flow cytometer (Sysmex UF-100; Sysmex, Kobe, Japan) are possibly helpful for standardization and quantifi-cation (8–11).
The iQ200 system automatically aspirates samples from tubes in racks. Particle images are collected as each sample flows through a planar flow cell in the object plane of a microscope. Stroboscopic illumina-tion freezes the moillumina-tion to ensure blur-free images on the charge-coupled device camera sensor. Individual particle images isolated from each of the 500 cap-tured frames are classified into 12 categories based on their size, shape, contrast and structure. The imag-es can be displayed on the screen for verification and manual editing, if necessary. Results for microscopic particles can be reported as particles per field of view (per high-power field; HPF) or per microliter. It is pos-sible to combine the iQ200 with an automated urine
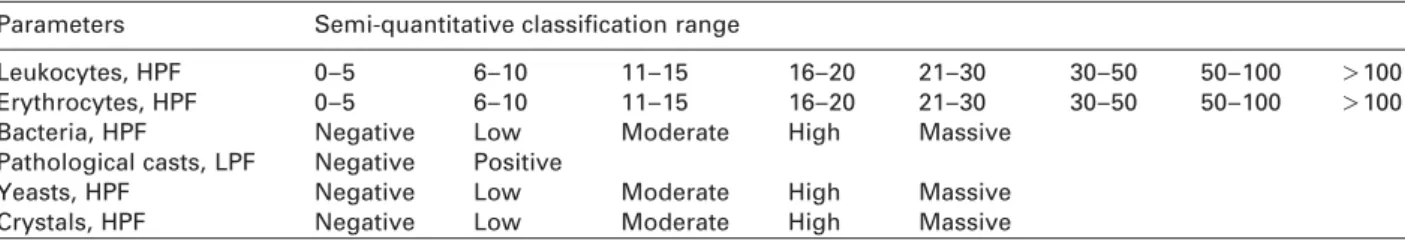
Table 1 Semi-quantitative range classification of urine particles. Parameters Semi-quantitative classification range
Leukocytes, HPF 0–5 6–10 11–15 16–20 21–30 30–50 50–100 )100
Erythrocytes, HPF 0–5 6–10 11–15 16–20 21–30 30–50 50–100 )100
Bacteria, HPF Negative Low Moderate High Massive
Pathological casts, LPF Negative Positive
Yeasts, HPF Negative Low Moderate High Massive
Crystals, HPF Negative Low Moderate High Massive
HPF, high-power field; LPF, low-power field.
test-strip analyzer such as the AUTION Max (Arkray, Kyoto, Japan).
The UF-100 system is a flow cytometer. Particles are first labeled with fluorophores and measured in a laser beam and classified according to their fluores-cence, size, impedance and forward scattered light. The results are displayed as scattergrams and histo-grams. Results can be presented in cells per microli-ter, as well as cells per field of view. The instrument may be combined with a Miditron or an Urisys system (both manufactured by Roche Diagnostics, Mann-heim, Germany) or other systems.
The aim of this study was to compare the diagnos-tic performance of the iQ200 and the UF-100 systems and combined dipstick/automated urine analysis with that of the traditional dipstick/microscopy algorithm.
Materials and methods
Urine specimens
A total of 332 fresh urine samples were selected randomly from various departments of our hospital (internal medicine, nephrology, urology, surgery, gynecology, etc.) and treated according to the NCCLS (7) and European Urinalysis Guide-lines (4). All urine samples were analyzed using biochemical tests, i.e. dipstick, and morphological methods, i.e. conven-tional microscopy, automated microscopy with the iQ200 system and flow cytometry with the UF-100 instrument. Dipstick urinalysis
Dipsticks were used to measure the following parameters: specific gravity, pH, white blood cells, red blood cells, nitrite, protein, glucose, ketone, urobilinogen, bilirubin, and blood. Combur dipsticks from Roche Diagnostics were used and interpreted on the Miditron M (Roche Diagnostics) if the sub-sequent morphological analyses were performed either by microscopy or on the UF-100. AUTION sticks from Arkray were used for analyses with the AUTION Max system if morphological analyses were performed on the iQ200. Standardized sediment microscopy
For conventional microscopy, sediments were obtained by centrifugation at 400=g for 5 min. All other procedures were performed on native urine samples. Microscopy was per-formed within 30 min after sedimentation of urine samples. One drop of the sediment was pipetted onto a microscope slide and covered with a cover slip (18 mm=18 mm). Micro-scopic inspection using a Leitz Laborlux 11 phase contrast microscope (Leitz GmbH, Wetzlar, Germany) was performed by two independent laboratory technicians at magnifications of =100 for casts and =400 for other parameters. The
fol-lowing parameters were identified in the sediment: red blood cells, white blood cells, epithelial cells, non-epithelial cells, bacteria, crystals, casts, and yeast. We examined the sediments from every urine sample by microscopy, indepen-dently of whether they showed pathological results upon dipstick analysis. We counted the particles per field and clas-sified the results semi-quantitatively within ranges, e.g., 0–5, 6–10, etc., or as negative or positive (Table 1) to yield results comparable with the conventional microscopic analyses (12). For deviating results (in two or more semi-quantitative categories), the final assignment was decided by a third examiner.
Automated urine microscopy analyzer
For analysis using the AUTION Max and iQ200 (software ver-sion 1.1, Iris) or the Miditron and UF-100 (software verver-sion 12, Sysmex) combination, 3–4 mL of native urine was placed in a glass tube and analyzed according to the manufacturers’ recommendations.
The iQ200 was set to report red blood cells, white blood cells and bacteria counts per HPF, and pathological casts, crystals and yeast in the semi-quantitative classes, e.g., neg-ative, low, moderate, etc.
The UF-100 reports the results of three parameters (red blood cells, white blood cells and bacteria) in both micro-liters and per HPF, and flags pathological casts, crystals and yeast at thresholds previously defined by the user.
To determine the coefficients of variation for the between-run imprecision for red blood cells, we measured positive controls instead of native urine samples for stability reasons (iQ200 positive control/UF-100 internal quality control) for 20 replicates.
Statistics
For statistical comparison we categorized quantitative data reported by the iQ200 and UF-100 systems according to the classes described for manual microscopy.
The results from the iQ200, the UF-100 and traditional microscopy were compared by x2test and Crosstabs using SPSS (statistical package for social science) for Windows, version 12.0.1 (SPSS Inc., Chicago, IL, USA). Sensitivity, specificity, negative and positive predictive values were cal-culated using Microsoft Excel spreadsheets. Statistical sig-nificance was considered at the level of p-0.05.
In the conventional routine setting, microscopy is not per-formed on every urine sample but only on those with pathological dipstick findings (4). Thus, we calculated the accuracy (Table 2) and the percentage pathological findings detectable by screening using either the conventional approach (i.e., dipstick alone) or one of the two combined dipstick/automated urine analysis approaches and compared these to the gold standard of microscopy (Table 3). We then calculated and compared the sensitivity and negative predic-tive values for the three screening strategies (Table 4).
Table 2 Accuracy of the iQ200 and UF-100 systems in com-parison with microscopic results.
Parameter Accuracy (95% CI), %
iQ200 UF-100 Leukocytes 89 (85.5–92.5) 84 (80–88) Erythrocytes 86 (82–90) 81 (77–85) Bacteria 68 (63–73) 42 (36.5–47.5) Pathological casts 91 (88–94) 86 (82–90) Yeasts 97 (95–99) 93 (90–96) Crystals 92 (89–95) 88 (84–92)
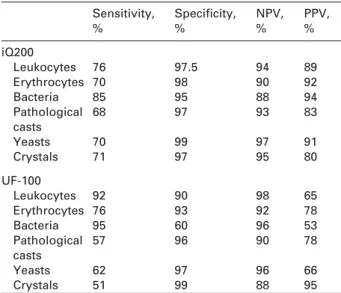
Table 4 Sensitivity and specificity of the systems calculated based on the cut-off values.
Sensitivity, % Specificity, % NPV, % PPV, % iQ200 Leukocytes 76 97.5 94 89 Erythrocytes 70 98 90 92 Bacteria 85 95 88 94 Pathological 68 97 93 83 casts Yeasts 70 99 97 91 Crystals 71 97 95 80 UF-100 Leukocytes 92 90 98 65 Erythrocytes 76 93 92 78 Bacteria 95 60 96 53 Pathological 57 96 90 78 casts Yeasts 62 97 96 66 Crystals 51 99 88 95
NPV, negative predictive value; PPV, positive predictive value.
Table 3 Comparison of the concordance rate between microscopy, the iQ200 system and the UF100 system without consid-ering the dipstick results.
Parameter Concordance, % p-Value
iQ200 and UF-100 iQ200 better UF-100 better as good as microscopy than UF-100 than iQ200
Leukocytes 85.5 9.0 5.5 0.11 Erythrocytes 83 11 6.0 0.045 Bacteria 51 39 10 -0.001 Pathological casts 90 7.0 3.0 0.022 Yeasts 94 5.0 1.0 0.004 Crystals 90 7.0 3.0 0.026 Results
Some 13% of the urine samples examined by the iQ200 and 8% examined by the UF-100 system had to be diluted because of a failure in the measuring pro-cedure, such as amorphous structures in the iQ200 and very high particle numbers in the UF-100 system. Precision
Between-run imprecision for red blood cells was measured. The coefficients of variation from day to day were 6.5% at a red blood cell count of 1000/mL and 5.5% at a count of 180/mL for the iQ200 and UF-100, respectively.
Accuracy
We examined 332 urinary samples. Accuracy was assessed in comparison with microscopic results; deviation of one or more semi-quantitative classes was considered as discrepant. For all parameters the iQ200 showed higher rates of concordance with microscopy than the UF-100 system (Table 2). With the exception of leukocytes, all differences were sta-tistically significant (Table 3).
Sensitivity, specificity, negative and positive predictive values
Sensitivity and specificity for detecting abnormal lev-els of parameters based on cutoff values were assessed (Table 4). We report the results as positive when they exceeded the cutoff values, which are defined as )5 leukocytes in the HPF, )5 erythrocytes in the HPF, more than ‘‘a few’’ bacteria in the HPF, )0 pathological casts in the low-power field (LPF), and )0 yeasts and crystals in the HPF.
In all calculations, microscopy was used as the reference method.
Sensitivity and negative predictive values of screening
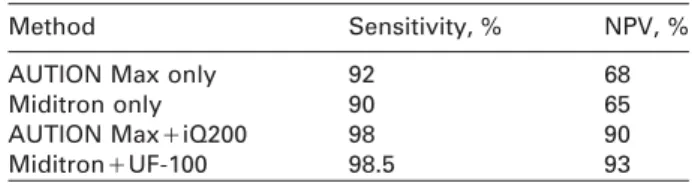
The combined screening approaches considerably improved the sensitivity and negative predictive val-ues by 8% and 28%, respectively. We did not find sig-nificant differences between the AUTION Max/iQ200 and Miditron/UF-100 combinations (Table 5).
Discussion
Urine screening for infections or other diseases of the kidney and urinary tract are of great importance in the clinical laboratory. According to the European guide-lines, the traditional strategy involves a two-step-pro-cedure, in which semi-quantitative dipstick tests are used in the first step to exclude urine samples without hemoglobin, leukocyte esterase activity, nitrite and protein from further analysis. In the second step, urine samples with indications for erythrocyturia, leu-kocyturia, bacteriuria or proteinuria are subjected to centrifugation to sediment insoluble components for further analysis by microscopy. This first step should
Table 5 Comparison of the two-step algorithm: sensitivity and negative predictive value for dipstick results alone and in combination with automated sediment analysis.
Method Sensitivity, % NPV, %
AUTION Max only 92 68
Miditron only 90 65
AUTION MaxqiQ200 98 90
MiditronqUF-100 98.5 93
NPV, negative predictive value.
generate very few false-negative results and should have a high negative predictive value. However, screening by dipstick alone carries the risk of missing infections and other urinary diseases (13–16). In this study we confirmed the low sensitivity and negative predictive value of this traditional approach and found that screening by dipstick combined with auto-mated urine analysis strongly reduced the rate of false-negative results. Similar results have been pub-lished previously (17, 18). The quality of the AUTION Max/iQ200 and Miditron/UF-100 combinations did not differ much.
Conventional microscopic analysis of urine sedi-ment, although considered to be the reference meth-od, involves several methodological steps such as centrifugation and discarding that lead to loss and destruction of cells and result in imprecision and inac-curacy. Automation may be helpful in solving these problems and improves the accuracy and precision of urine sediment analysis. Several studies compared automated image-based analysis systems and/or flow cytometer-based systems with manual microscopy (6, 19–27), and most recognized the accuracy and preci-sion of automated systems (28–32), as well as their feasibility as routine screening tools (8, 10, 17, 18, 33, 34).
Both systems, the iQ200 and UF-100, open new opportunities for improvement in the standardization of urinary analysis and confer substantial advantages over the classical method of microscopic examina-tion, because they allow the precise determination of absolute cell numbers per field or volume. They can be directly used as standard methods, or at least as important tools for standardization (11). For this study we did not use this advantage so that results would be comparable with the conventional microscopic technique. The main error-prone steps such as cen-trifugation and manual preparation are omitted and therefore sample analysis is completed in a very short turnaround time (9, 30); the hands-on time, including picture or scattergram interpretation, is less than 30 s on average. In our laboratory, which performs approximately 25,000 urinalyses per year, this strat-egy reduced the workload by approximately 30%.
Despite this advancement, both systems also have some limitations in the accurate classification of sed-iment components, which are discussed in more detail below.
Leukocytes
Our results show that the sensitivity of the UF-100 for detecting leukocytes is higher than that of the iQ200
owing to the analytical technology. The UF-100 labels DNA with fluorophores. Even if a leukocyte is mor-phologically damaged, the DNA is still present and can be analyzed, since it is very robust. In contrast, the iQ200 photographs the morphological structures and does not count damaged leukocytes. The iQ200 counts distorted and disrupted cells as artifacts (32). The UF-100, however, yields more false-positive results for leukocytes compared to the iQ200. In par-ticular, naked epithelial cells or transitional cells can be misclassified as leukocytes (27, 30). The total accu-racy rates for the iQ200 tended to be higher than those of the UF-100. However, the difference was not statistically significant.
Erythrocytes
Both systems show limited quality in the identifica-tion of erythrocytes. The iQ200 yields low erythrocyte counts if abnormal erythrocytes such as ghosts and dysmorphic cells are present. In some cases, false high erythrocyte counts occurred due to misclassifi-cation of yeast. Similar findings have been reported by Wah et al. (32). A warning system as implemented in the UF-100 is missing in the iQ200 system. Unfor-tunately, the UF-100 recognizes and flags only part of the falsely classified erythrocytes for microscopy.
The UF-100 distinguishes erythrocytes on the basis of cellular diameter and reports erythrocyte size dis-tribution. This can help to differentiate glomerular and non-glomerular hematuria. The UF-100, however, does not recognize dysmorphic erythrocytes with altered shape such as acanthocytes, which have been identified as a characteristic marker for glomerular bleeding (35).
Furthermore, samples flagged for dysmorphia could contain a certain portion of normal but small erythrocytes (36). Therefore, urine samples from patients suspected of suffering from nephritis must be analyzed by manual microscopy (26). Our results are consistent with findings of other studies showing that the UF-100 has greater deficits when analyzing sam-ples with high numbers of crystals, yeast and sperm cells known to overlap with the erythrocyte gate in the scattergram (27, 30, 33).
Bacteria
Most of the problems occurred in analyzing micro-organisms. Obviously, the data library of the iQ200 with software version 1.1 is not comprehensive enough to assign microorganisms correctly. Morpho-logical structures such as rods are still difficult to clas-sify. One possible reason is found in the limited software, for which fuzzy logic is missing. Rotation of three-dimensional structures would help to discrimi-nate spherical particles such as cells and yeast from cones such as casts or some microorganisms. This library is periodically extended with every software update, so that an improvement in the recognition of microorganisms can be expected. Nevertheless, the iQ200 system has higher applicability in classifying bacteria compared to the UF-100, but this is due to manual re-classification of bacteria that are
consid-ered to be ‘‘artifacts’’ in the list. We observed over-estimation of bacteriuria by the UF-100, probably due to misidentification of amorphous debris or other small particles such as bacteria. This poor specificity of the bacterial count by the UF-100 was reported pre-viously (30).
Pathological casts
The capability of the iQ200 for detecting casts was generally good. Granular and other types of casts cannot always be distinguished by the system. How-ever, it is possible to classify the particles by visual inspection of the screen retrospectively. Furthermore, according to the manufacturer’s recommendations, we routinely reinspect the artifact field to discover possible pathological casts if the iQ200 detects hya-line casts.
In our study the UF-100 showed lower sensitivity in detecting pathological casts than the iQ200. False-positive results were sometimes caused by the pres-ence of mucus and high numbers of hyaline casts. In addition, pathological casts cannot be differentiated sufficiently. The identification of pathological casts requires confirmation by microscopic review, as already pointed out by others (26, 27, 30, 33). Such particles are flagged by the UF-100 system.
Yeasts
The results of yeast analysis obtained after reviewing saved images on the iQ200 were in fair agreement with manual microscopy. Similar results have been published previously (9). The UF-100 frequently mis-classified erythrocytes as yeasts.
Crystals
The iQ200 is more reliable in the detection of crystals than the UF-100 system. Some false-positive results were observed due to misidentification of dysmorphic erythrocytes as crystals by the iQ200, albeit in only a few cases.
Oxalate crystals may mimic erythrocytes during the scanning process and evoke false-positive results by the UF-100. Therefore, careful manual microscopic reinspection is recommended (11, 31, 37). Unlike the UF-100, the iQ200 system recognizes the different morphology of crystals, which can be used for subdifferentiation.
Trichomonas and oval fat bodies
Owing to the low frequency of samples containing
Trichomonas and oval fat bodies, we have no data for
statistical analysis.
The iQ200 system allows the operator to accept, delete or reclassify displayed images. Such retrospec-tive assignment is not possible for the UF-100 system. We propose manual reviewing of saved images in the iQ200. Non-classifiable elements are put into the section ‘‘artifacts’’ or in the updated software version indicated as ‘‘non-classifiable’’. In this field, the user is strongly recommended to evaluate every picture to identify possible pathological casts, bacteria or yeasts
that have been missed by the intended section. It is very important to classify any of the structures in the ‘‘artifacts’’ field to obtain a correct grading. Otherwise the ratios, i.e., the number of particles reported either per field or per volume, are calculated wrongly.
Conclusions
We conclude that automated urine sediment analysis is sufficiently precise and improves the work flow in a routine laboratory significantly. In addition, it allows sediment analysis of all urine samples and thus helps in identifying pathological samples that would have been missed in the two-step procedure. Although it is not a substitute for microscopic sediment examina-tion, it can, when combined with dipstick testing, reduce the number of specimens submitted to microscopy. Visual microscopy will still be required for some samples, namely, dysmorphic erythrocytes, yeasts, Trichomonas, oval fat bodies, differentiation of casts and certain crystals.
Acknowledgements
We express our gratitude to Axon Lab for their grant support of the iQ200 system. We would like to thank the Department of Nephrology, University Hospital of Zurich and the mem-bers of the Institute of Clinical Chemistry for their ongoing support and contributions during our testing phase.
References
1. Wuthrich RP, Serra A. wThe red urinex. Ther Umsch 2006;63:595–600.
2. Huussen J, Koene RA, Hilbrands LB. The (fixed) urinary sediment, a simple and useful diagnostic tool in patients with haematuria. Neth J Med 2004;62:4–9.
3. Ono Y, Sugimoto K, Goto M, Kimura M, Kasai T, Shoji M, et al. wHematuria and acanthocyturia in patients with diabetesx. Rinsho Byori 2005;53:993–8.
4. European Urinalysis Guidelines. Scand J Clin Lab Invest Suppl 2000;231:1–86.
5. Winkel P, Statland BE, Jorgensen K. Urine microscopy, an ill-defined method, examined by a multifactorial tech-nique. Clin Chem 1974;20:436–9.
6. Carlson DA, Statland BE. Automated urinalysis. Clin Lab Med 1988;8:449–61.
7. Urinalysis and collection, transportation and preserva-tion of urine specimens; approved guideline: NCCLS document GP 16-A. Wayne, PA: NCCLS, 1995.
8. Alves L, Ballester F, Camps J, Joven J. Preliminary eval-uation of the Iris IQ 200 automated urine analyser. Clin Chem Lab Med 2005;43:967–70.
9. Lamchiagdhase P, Preechaborisutkul K, Lomsomboon P, Srisuchart P, Tantiniti P, Khan-u-Ra N, et al. Urine sedi-ment examination: a comparison between the manual method and the iQ200 automated urine microscopy ana-lyzer. Clin Chim Acta 2005;358:167–74.
10. Okada H, Sakai Y, Kawabata G, Fujisawa M, Arakawa S, Hamaguchi Y, et al. Automated urinalysis. Evaluation of the Sysmex UF-50. Am J Clin Pathol 2001;115:605–10. 11. Hannemann-Pohl K, Kampf SC. Automation of urine
sed-iment examination: a comparison of the Sysmex UF-100 automated flow cytometer with routine manual
diagno-sis (microscopy, test strips, and bacterial culture). Clin Chem Lab Med 1999;37:753–64.
12. Thiel G. Examination of the urine in general practice. Schweiz Rundsch Med Prax 1977;23:689–702.
13. Shaw ST Jr, Poon SY, Wong ET. ‘‘Routine urinalysis’’. Is the dipstick enough? J Am Med Assoc 1985;253:1596– 600.
14. Laine P, Toivonen E, Eklund K, Hohenthal U, Siren S, Maki T. Rapid dipstick urinalysis in the internal medicine clinic: what is missed? J Intern Med 1997;242:271–3. 15. Deville WL, Yzermans JC, van Duijn NP, Bezemer PD,
van der Windt DA, Bouter LM. The urine dipstick test useful to rule out infections. A meta-analysis of the accu-racy. BMC Urol 2004;4:4.
16. Gangaram R, Ojwang PJ, Moodley J, Maharaj D. The accuracy of urine dipsticks as a screening test for pro-teinuria in hypertensive disorders of pregnancy. Hyper-tens Pregnancy 2005;24:117–23.
17. Lun A, Ziebig R, Priem F, Filler G, Sinha P. Routine work-flow for use of urine strips and urine work-flow cytometer UF-100 in the hospital laboratory. Clin Chem 1999;45:1305– 7.
18. Regeniter A, Haenni V, Risch L, Kochli HP, Colombo JP, Frei R, et al. Urine analysis performed by flow cytometry: reference range determination and comparison to mor-phological findings, dipstick chemistry and bacterial cul-ture results – a multicenter study. Clin Nephrol 2001; 55:384–92.
19. Deindoerfer FH, Gangwer JR, Laird CW, Ringold RR. ‘‘The Yellow IRIS’’ urinalysis workstation – the first com-mercial application of ‘‘automated intelligent microsco-py’’. Clin Chem 1985;31:1491–9.
20. Wargotz ES, Hyde JE, Karcher DS, Hitlan JP, Wilkinson DS. Urine sediment analysis by the Yellow IRIS auto-mated urinalysis workstation. Am J Clin Pathol 1987; 88:746–8.
21. Yasui Y, Tatsumi N, Koezuka T, Okamura M, Yamagami S. Comparison of three methods for analysis of urinary sediments. Osaka City Med J 1996;42:77–92.
22. Kouri TT, Kahkonen U, Malminiemi K, Vuento R, Rowan RM. Evaluation of Sysmex UF-100 urine flow cytometer vs chamber counting of supravitally stained specimens and conventional bacterial cultures. Am J Clin Pathol 1999;112:25–35.
23. Toffaletti J, Dotson MA, Shearman P, Koontz A. Com-parison of 2 automated systems for urine chemistry and urine sediment analysis. Lab Hematol 1999;5:123–9.
24. Roggeman S, Zaman Z. Safely reducing manual urine microscopy analyses by combining urine flow cytometer and strip results. Am J Clin Pathol 2001;116:872–8. 25. Apeland T, Mestad O, Hetland O. Assessment of
hae-maturia: automated urine flowmetry vs microscopy. Nephrol Dial Transplant 2001;16:1615–9.
26. Gai M, Piccoli GB, Segoloni GP, Lanfranco G. Micro-scopic urinalysis and automated flow cytometry in a nephrology laboratory. Clin Chem 2003;49:1559–60. 27. Ottiger C, Huber AR. Quantitative urine particle analysis:
integrative approach for the optimal combination of automation with UF-100 and microscopic review with KOVA cell chamber. Clin Chem 2003;49:617–23. 28. Roe CE, Carlson DA, Daigneault RW, Statland BE.
Eval-uation of the Yellow IRIS. An automated method for uri-nalysis. Am J Clin Pathol 1986;86:661–5.
29. Ben-Ezra J, Bork L, McPherson RA. Evaluation of the Sysmex UF-100 automated urinalysis analyzer. Clin Chem 1998;44:92–5.
30. Fenili D, Pirovano B. The automation of sediment uri-nalysis using a new urine flow cytometer (UF-100). Clin Chem Lab Med 1998;36:909–17.
31. Delanghe JR, Kouri TT, Huber AR, Hannemann-Pohl K, Guder WG, Lun A, et al. The role of automated urine particle flow cytometry in clinical practice. Clin Chim Acta 2000;301:1–18.
32. Wah DT, Wises PK, Butch AW. Analytic performance of the iQ200 automated urine microscopy analyzer and comparison with manual counts using Fuchs-Rosenthal cell chambers. Am J Clin Pathol 2005;123:290–6. 33. Langlois MR, Delanghe JR, Steyaert SR, Everaert KC, De
Buyzere ML. Automated flow cytometry compared with an automated dipstick reader for urinalysis. Clin Chem 1999;45:118–22.
34. Hughes C, Roebuck MJ. Evaluation of the IRIS 939 UDx flow microscope as a screening system for urinary tract infection. J Clin Pathol 2003;56:844–9.
35. Kohler H, Wandel E, Brunck B. Acanthocyturia – a char-acteristic marker for glomerular bleeding. Kidney Int 1991;40:115–20.
36. Ottiger C, Regeniter A, Kochli HP, Huber AR. wStandard-ized counting of particles in the urine: a comparison between flow cytometry, cell chamber counting and tra-ditional sediment analysisx. Schweiz Rundsch Med Prax 2004;93:15–21.
37. Yasui Y, Tatsumi N, Park K, Koezuka T. Urinary sediment analyzed by flow cytometry. Cytometry 1995;22:75–9. Received December 17, 2006, accepted May 4, 2007