Publisher’s version / Version de l'éditeur:
Langmuir, 23, 12, pp. 6482-6485, 2007-05-03
READ THESE TERMS AND CONDITIONS CAREFULLY BEFORE USING THIS WEBSITE. https://nrc-publications.canada.ca/eng/copyright
Vous avez des questions? Nous pouvons vous aider. Pour communiquer directement avec un auteur, consultez la première page de la revue dans laquelle son article a été publié afin de trouver ses coordonnées. Si vous n’arrivez pas à les repérer, communiquez avec nous à [email protected].
Questions? Contact the NRC Publications Archive team at
[email protected]. If you wish to email the authors directly, please see the first page of the publication for their contact information.
NRC Publications Archive
Archives des publications du CNRC
This publication could be one of several versions: author’s original, accepted manuscript or the publisher’s version. / La version de cette publication peut être l’une des suivantes : la version prépublication de l’auteur, la version acceptée du manuscrit ou la version de l’éditeur.
For the publisher’s version, please access the DOI link below./ Pour consulter la version de l’éditeur, utilisez le lien DOI ci-dessous.
https://doi.org/10.1021/la700701x
Access and use of this website and the material on it are subject to the Terms and Conditions set forth at
Spectroscopically encoded microspheres for antigen biosensing
Raez, Jose; Blais, David; Zhang, Ying; Alvarez-Puebla, Ramon A.;
Bravo-Vasquez, Juan P.; Pezacki, John P.; Fenniri, Hicham
https://publications-cnrc.canada.ca/fra/droits
L’accès à ce site Web et l’utilisation de son contenu sont assujettis aux conditions présentées dans le site LISEZ CES CONDITIONS ATTENTIVEMENT AVANT D’UTILISER CE SITE WEB.
NRC Publications Record / Notice d'Archives des publications de CNRC:
https://nrc-publications.canada.ca/eng/view/object/?id=9df0b63c-98eb-41b9-aa96-d3e4dc2fc6d1 https://publications-cnrc.canada.ca/fra/voir/objet/?id=9df0b63c-98eb-41b9-aa96-d3e4dc2fc6d1Spectroscopically Encoded Microspheres for Antigen Biosensing
Jose Raez,
†David R. Blais,
‡Ying Zhang,
†Ramon A. Alvarez-Puebla,
†Juan P. Bravo-Vasquez,
†John P. Pezacki,*
,‡,§and Hicham Fenniri*
,†,|National Institute for Nanotechnology, 11421 Saskatchewan DriVe, Edmonton, Alberta, Canada T6G 2M9, Steacie Institute for Molecular Sciences, 100 Sussex DriVe, Ottawa, Ontario, Canada K1A 0R6, Department of Chemistry, UniVersity of Ottawa, 10 Marie-Curie, Ottawa, Ontario, Canada K1N 6N5, and
Department of Chemistry, UniVersity of Alberta, 11227 Saskatchewan DriVe, Edmonton, Alberta, Canada T6G 2G2
ReceiVed March 10, 2007. In Final Form: April 21, 2007
Here, we demonstrate the potential of barcoded resins (BCRs) as a reliable platform for immunoassays. Four BCRs were synthesized by dispersion polymerization of 4-methylstyrene, t-butylstyrene, 2,4-dimethylstyrene, and 2,5-dimethylstyrene. Methacrylic acid was included in the polymerization step to provide an anchor point for antibody conjugation. In addition to identifying the BCRs through their unique spectrum in an immunoassay experiment, Raman scattering spectroscopy confirmed the immunoreactivity of the bead-conjugated antibody by detecting 150 ng/mL (∼150 pg/bead) of fluorescently labeled rabbit IgG antigen. The simplicity, versatility, and effectiveness of this platform demonstrate its potential for high-throughput multiplexed bioassays.
Rapid and sensitive techniques to detect antigens and bio-molecules are central to human health, from determining the precise diagnostic and the proper therapeutic treatments to preventing and controlling pandemics and bioterrorism. Most of the existing detection assays rely on specific molecular recognition events such as antibody-antigen, DNA-DNA, or receptor-ligand interactions.1 However, current technologies such as
enzyme-linked immunosorbent assay (ELISA), printed micro-arrays, and serologic testing are costly and labor intensive. To overcome these limitations, simple and cost-effective analytical techniques with multiplexing capabilities are needed.
Bead-based arrays are rapidly gaining prominence as an assay platform for biorecognition, as they address some of the limitations posed by conventional assay methods. For instance, advantages offered by bead-based arrays include (a) amenability to high-throughput screening and multiplexing; (b) larger surface area for receptor conjugation relative to 2D substrates; (c) better accessibility of the analytes to the entire sample volume for interaction with the bead-conjugated receptors; and (d) greater versatility in sample analysis and data acquisition. Bead-based arrays could be grouped into categories based on bead size (nanoparticles2-4 or microparticles5) and encoding method
(external labeling or self-encoding). External labeling requires the addition of codifiers to the microplatform, such as fluor-escent markers,6,7dyes,8photonic crystals,9or semiconductor
quantum dots.10-12This method is time-consuming, costly, and
is, in some cases, inherently limited to a small number of unique codifications. Conversely, the self-encoding approach benefits from the chemical/physical properties of the materials used in the synthesis of the microparticles, such as shape,13 vapor
permeability,14and spectroscopic properties.15-18
We have recently reported on a new class of resins prepared with built-in infrared and Raman spectroscopic barcodes (Figure 1).15-18This approach introduces a new paradigm for
biodiagnostics and immunoassays, as the beads are not just a platform for analyte-receptor interaction, but they also hold their chemical history in the form of a vibrational fingerprint. This approach confers several advantages for bead identifica-tion: (a) classification is a one-step process,15-18thus
signifi-cantly reducing sample handling, processing time, and cost, (b) Raman scattering spectra are not influenced by water and physiological media, which are necessary for biomolecular recognition, and (c) Raman scattering provides not only the vibrational modes of the molecule under study but also its electronic emission spectrum (fluorescence). This effect is usually an obstacle in the normal practice of Raman scattering
spec-* To whom correspondence should be addressed. Fax: 613-941-8447 (J.P.P.); 780-641-1601 (H.F.). E-mail: [email protected] (J.P.P.); [email protected] (H.F.).
†National Institute for Nanotechnology. ‡Steacie Institute for Molecular Sciences. §University of Ottawa.
|University of Alberta.
(1) Edelstein, R. L.; Tamanaha, C. R.; Sheehan, P. E.; Miller, M. M.; Baselt, D. R.; Whitman, L. J.; Colton, R. J. Biosens. Bioelectron. 2000, 14, 805-813. (2) Bruchez, M.; Moronne, M.; Gin, P.; Weiss, S.; Alivisatos, A. P. Science 1998, 281, 2013-2016.
(3) Nicewarner-Pena, S. R.; Freeman, R. G.; Reiss, B. D.; He, L.; Pena, D. J.; Walton, I. D.; Cromer, R.; Keating, C. D.; Natan, M. J. Science 2001, 294, 137-141.
(4) Nam, J. M.; Park, S. J.; Mirkin, C. A. J. Am. Chem. Soc. 2002, 124, 3820-3821.
(5) Finkel, N. H.; Lou, X. H.; Wang, C. Y.; He, L. Anal. Chem. 2004, 76, 353A-359A.
(6) De Silva, A. P.; James, M. R.; McKinney, B. O. F.; Pears, D. A.; Weir, S. M. Nat. Mater. 2006, 5, 787-790.
(7) Battersby, B. J.; Bryant, D.; Meutermans, W.; Matthews, D.; Smythe, M. L.; Trau, M. J. Am. Chem. Soc. 2000, 122, 2138-2139.
(8) Zhao, X. W.; Liu, Z. B.; Yang, H.; Nagai, K.; Zhao, Y. H.; Gu, Z. Z. Chem.
Mater. 2006, 18, 2443-2449.
(9) Cunin, F.; Schmedake, T. A.; Link, J. R.; Li, Y. Y.; Koh, J.; Bhatia, S. N.; Sailor, M. J. Nat. Mater. 2002, 1, 39-41.
(10) Han, M. Y.; Gao, X. H.; Su, J. Z.; Nie, S. Nat. Biotechnol. 2001, 19, 631-635.
(11) Battaglia, D.; Blackman, B.; Peng, X. G. J. Am. Chem. Soc. 2005, 127, 10889-10897.
(12) Eastman, P. S.; Ruan, W. M.; Doctolero, M.; Nuttall, R.; De Feo, G.; Park, J. S.; Chu, J. S. F.; Cooke, P.; Gray, J. W.; Li, S.; Chen, F. Q. F. Nano Lett. 2006, 6, 1059-1064.
(13) Vaino, A. R.; Janda, K. D. Proc. Natl. Acad. Sci. U.S.A. 2000, 97, 7692-7696.
(14) Dickinson, T. A.; Michael, K. L.; Kauer, J. S.; Walt, D. R. Anal. Chem. 1999, 71, 2192-2198.
(15) Fenniri, H.; Ding, L. H.; Ribbe, A. E.; Zyrianov, Y. J. Am. Chem. Soc. 2001, 123, 8151-8152.
(16) Fenniri, H.; Chun, S.; Ding, L. H.; Zyrianov, Y.; Hallenga, K. J. Am.
Chem. Soc. 2003, 125, 10546-10560.
(17) Fenniri, H.; Terreau, O.; Chun, S. K.; Oh, S. J.; Finney, W. F.; Morris, M. D. J. Comb. Chem. 2006, 8, 192-198.
(18) Fenniri, H.; Hedderich, H. G.; Haber, K. S.; Achkar, J.; Taylor, B.; Ben-Amotz, D. Angew. Chem., Int. Ed. 2000, 39, 4483-4485.
10.1021/la700701x CCC: $37.00 © 2007 American Chemical Society Published on Web 05/03/2007
troscopy.19 In this study, however, we demonstrate that the
fluorescence emission and Raman scattering could be recorded simultaneously to expedite the classification process, thus further reducing the time required for sample analysis.
This study focuses on demonstrating the feasibility of antibody-antigen immunoassay recognition on the barcoded resins (BCRs). To this end, (a) four carboxylated BCRs were synthesized, (b) the BCRs were conjugated to Cy3-labeled anti-rabbit IgG (referred to as Ab1), (c) the Cy3-Ab-BCR conjugates were shown to selectively bind their antigen Cy2-labeled rabbit IgG (referred to as Ag1), (d) the spectroscopic barcodes were shown to be conserved after each step of the BCR derivatization
(19) Long, D. A. The Raman Effect; John Wiley & Sons Ltd.: Chichester, 2002.
Figure 1. Schematic representation of carboxylated BCR synthesis, immunoassay method, and Raman spectra of the BCRs. (A) Styrene co-monomers, each with a unique vibrational fingerprint. (B) Methacrylic acid (MA) was used as a co-monomer to generate the carboxyl groups on the bead for covalently linking the Cy3-anti-rabbit IgG antibody (Ab1) via EDC coupling. The immunoreactivity of the antibody conjugated to the bead was verified by its specificity toward its Cy2-rabbit IgG antigen (Ag1). (C) Raman spectra of poly(methacrylic acid) (pMA), poly(4-methylstyrene) (p4MS), and their copolymer poly(4MS-co-MA) (BCR1; 10:1;λex)780 nm). (D) Unique Raman spectra of four different BCRs acquired with two different laser lines (532 nm, green and 780 nm, red). Abbreviations: BCR2, poly(4BS-co-MA); BCR3,
poly(2,4DMS-co-MA); BCR4, poly(2,5DMS-co-MA).
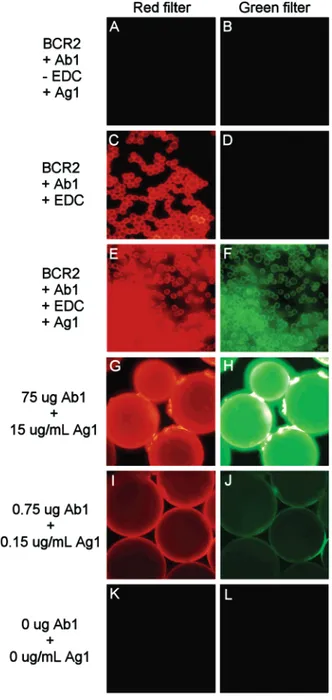
Figure 2. Effect of EDC and antibody/antigen concentration on the fluorescence signal of BCR2. The coupling between BCR2 and Ab1 was demonstrated in the absence (A and B) and presence (C and D) of EDC. Immunocomplex formation between Ab1-BCR2 and Ag1 (E and F). BCR2 (150 mg) was conjugated with 75µg (G), 0.75 µg (I), and 0µg (K) of Cy3-anti-rabbit IgG antibody (Ab1), and then it was exposed to 15µg/mL (H), 0.15 µg/mL (J), and 0 µg/mL (L) of Cy2-rabbit IgG antigen (Ag1).
process, and (e) the ability to record the Raman barcode and the fluorescence signature of the Ab-Ag pair in a single operation was established.
The BCRs were prepared in a one-step suspension polym-erization reaction by combining styrene-based co-monomers to generate unique Raman spectral barcodes and methacrylic acid (MA) to introduce the carboxyl functionality for biomolecule conjugation (Figure 1A and B). The Raman spectral analyses of the styrene homopolymers and corresponding MA copolymers showed very good spectral correlation, which was not affected by the vibrational modes of MA. For instance, the spectra of poly(4-methylstyrene) and its 10:1 statistical copolymer poly-(4-methylstyrene-co-methacrylic acid) were essentially super-imposable (Figure 1C). The BCRs investigated consisted of four divinylbenzene cross-linked copolymers: (a) BCR1, poly(4-methylstyrene-co-methylacrylic acid); (b) BCR2, poly(4-t-butylstyrene-co-methacrylic acid); (c) BCR3, poly(2,4-dimeth-ylstyrene-co-methacrylic acid); and (d) BCR4, poly(2,5-dimethylstyrene-co-methacrylic acid), which were shown by Raman spectroscopy to produce unique vibrational spectra (Figure 1D). As anticipated, the Raman spectra of the copolymers, collected upon excitation with 532 and 780 nm laser lines, were similar (Figure 1D), since both lines are located far away from
the electronic absorption bands of the copolymers (no resonance contribution was expected).20
Covalent conjugation of Ab1 to the BCRs was confirmed by fluorescence microscopy, where Ab1 fluorescence could clearly be observed (Figure 2C and D). The covalent nature of the bond between the Ab1 and the bead was verified in a control conjugation experiment lacking the coupling agent EDC (Figure 2A and B). The absence of residual fluorescence in the latter control experiment also confirms the effectiveness of the blocking step in preventing the nonspecific adsorption of antibodies and antigens to the bead surface, and it rules out any interference of the BCRs with the fluorescence signal. Following the conjugation of Ab1 to BCR2 (Figure 2C), its activity was confirmed via its binding affinity toward its antigen Ag1 (Figure 2E and F). These findings suggest that anti-rabbit IgG immobilized on the BCRs still demonstrates good immunoreactivity. The affinity of the BCR-conjugated antibody for its antigen was further challenged not only by decreasing 100 times the amount of antibody conjugated to the bead (0.75µg per 0.15 g of BCR or ∼5 pg/bead), but also by exposing the beads to a 100-fold reduced concentration of antigen (0.15µg/mL or ∼150 pg/bead) (Figure 2G-J).21Despite
(20) Carvalho, A. J. F.; Ferreira, M.; Balogh, D. T.; Oliveira, O. N.; Faria, R. M. J. Phys. Chem. B 2004, 108, 7033-7039.
Figure 3. (A) Electronic absorption and emission spectra of Cy3 (upper spectra) and Cy2 (lower spectra) dyes. Excitation laser lines at 532 nm (green arrow) and at 780 nm (red arrow) are shown. (B) From top to bottom are the electronic emission spectra of Ab1 and Ag1, the Raman spectra of BCR2 before and after conjugation with Ab1 (75µg), and exposure to Ag1 (15 µg/mL). (C) From top to bottom are the Raman spectra acquired with the 780 nm laser line of BCR2 before and after conjugation with Ab1, and exposure to Ag1. (D) Optical image of a mixture of BCR1, BCR3, BCR4, and Ab1-BCR2 after exposure to Ag1. (E) Raman mapping at 500 cm-1(λ
ex)532 nm) showing the fluorescent Ab1-BCR2 conjugates. (F) Raman classification of all the BCRs (λex)780 nm).
these changes, Ab1 and Ag1 fluorescence emission was still readily detectable (Figure 2I and J).
Prior to conjugation with Ab1 and exposure to Ag1, the Raman spectra recorded with the 532 and 780 nm laser lines were essentially superimposable (Figure 1D). However, the absorption spectra of Ag1 and Ab1 showed that the 532 nm laser line would overlap with their electronic absorption bands (Figure 3A, black spectra), therefore inducing fluorescence emission. Indeed, after conjugation with Ab1 and exposure to Ag1, excitation with the visible laser line (532 nm) resulted in spectra that were dominated by fluorescence emission (Figure 3B). In stark contrast with these results, no fluorescence was induced when the Raman spectra were obtained with the near-infrared laser line (780 nm) since the electronic absorption bands of the fluorescently labeled Ab1/Ag1 were far away from the excitation line used (Figure 3A). For illustration, the Raman spectra of BCR2 before and after conjugation with Ab1, and binding with Ag1 (Figure 3C) showed no fluorescence. BCR2 could therefore be readily identified by comparing its 780 nm spectrum (Figure 3C) with that of an authentic sample (Figure 1D). Furthermore, the presence of Ab1 and Ag1 on the surface of BCR2 did not interfere with the spectroscopic barcode (Figure 3C). These results demonstrate that fluorescence emission and Raman scattering of the BCRs can be examined independently with the appropriate laser lines using the same optical setup.
To test for selectivity, a simulated bead immunoassay was performed. The Ab1-BCR2 conjugate was mixed with three antibody-free BCRs (BCR1, BCR3, and BCR4), exposed to Ag1, and then imaged by fluorescence and Raman mapping. Fluorescence mapping at 532 nm revealed the beads bound to the immunocomplex (Figure 3E). Subsequent Raman mapping at 780 nm and bead classification (Omnic 7.5, Thermo Electron Co.) confirmed the identities of all the BCRs (Figure 3F). For
each 2D map, 690 individual spectra were collected, with a total acquisition time of ∼4.5 h (30 min for fluorescence imaging in low resolution mode plus 4 h for Raman imaging in high resolution mode). To expedite this classification step and to allow for the screening and identification of hundreds of beads within minutes, the Raman mapping could be limited to the fluorescent beads only (scan time of 20 s). Alternative Raman mapping systems could also be used to dramatically reduce the acquisition time.17
In summary, the unique vibrational properties of styrene derivatives were utilized to generate four new BCRs for antigen biosensing. As previously shown, the number of barcoded resins could reach several hundreds using a small library of styrene co-monomers.15-18Our results demonstrated the efficiency of
Ab conjugation and on-bead Ag recognition at a very low concentration (150 ng/mL, ∼150 pg/bead). The antigen detection limit was found to be comparable to those of conventional ELISA kits, and it could be further improved into the low nanogram per milliliter to the high picogram per milliliter range by using carrier-free antibodies.21Raman scattering spectroscopy was used to
detect the presence of bound fluorescent antibody and antigen to the beads, in addition to classifying the BCRs based on their Raman barcodes. The simplicity, versatility, and rapid analysis of the BCRs could potentially enable a wide range of new applications, including antigen and nucleic acid multiplex arrays, multiplexed flow cytometry,22and high-throughput biomedical
screening.
Acknowledgment. We thank NRC’s Genomics and Health
Initiative, the National Institute for Nanotechnology, the Steacie Institute for Molecular Science, the University of Alberta, the University of Ottawa, and the National Institutes of Health (NIH EB03824) for supporting this program.
Supporting Information Available: Experimental section. This information is available free of charge via the Internet at http://pubs.acs.org.
LA700701X (21) The 5 pg of antibody conjugated to each bead was estimated based on
the number of beads per gram (∼106), the amount of beads used in the conjugation
experiment (0.15 g), and the amount of Ab1 used for conjugation (0.75µg). The 150 pg of Ag1 detected per bead was estimated based on the number of beads per gram (∼106), the amount of BCR-Ab1 conjugate used in the assay (1 mg),
and the amount of Ag1 (0.15µg/mL) exposed to BCR-Ab1. The conjugation of the antibody to the BCRs could be further improved by using purified monoclonal antibodies lacking carrier proteins. For this study, the supplier supplemented the Ab1 with bovine serum albumin in a ratio of 1:10 to increase the stability and half-life of the reconstituted antibodies at room temperature.
(22) (a) Nolan, J. P.; Mandy, F. Cytometry, Part A 2006, 69A, 318-325. (b) van der Heyde, H. C.; Burns, J. M.; Weidanz, W. P.; Horn, J.; Gramaglia, I.; Nolan, J. P. Cytometry, Part A 2007, 71A, 242-250.