Publisher’s version / Version de l'éditeur:
International Journal of Maritime Engineering, 151, A1, pp. 19-34, 2009-01-01
READ THESE TERMS AND CONDITIONS CAREFULLY BEFORE USING THIS WEBSITE.
https://nrc-publications.canada.ca/eng/copyright
Vous avez des questions? Nous pouvons vous aider. Pour communiquer directement avec un auteur, consultez la
première page de la revue dans laquelle son article a été publié afin de trouver ses coordonnées. Si vous n’arrivez pas à les repérer, communiquez avec nous à [email protected].
Questions? Contact the NRC Publications Archive team at
[email protected]. If you wish to email the authors directly, please see the first page of the publication for their contact information.
NRC Publications Archive
Archives des publications du CNRC
This publication could be one of several versions: author’s original, accepted manuscript or the publisher’s version. / La version de cette publication peut être l’une des suivantes : la version prépublication de l’auteur, la version acceptée du manuscrit ou la version de l’éditeur.
Access and use of this website and the material on it are subject to the Terms and Conditions set forth at
Study of podded propulsors with varied bub angle and configurations
Islam, M. F.; Veitch, B.; Liu, P.; Akinturk, A.
https://publications-cnrc.canada.ca/fra/droits
L’accès à ce site Web et l’utilisation de son contenu sont assujettis aux conditions présentées dans le site LISEZ CES CONDITIONS ATTENTIVEMENT AVANT D’UTILISER CE SITE WEB.
NRC Publications Record / Notice d'Archives des publications de CNRC:
https://nrc-publications.canada.ca/eng/view/object/?id=2ad6c0ec-f5e3-45ac-9c46-47a5099dbc5a https://publications-cnrc.canada.ca/fra/voir/objet/?id=2ad6c0ec-f5e3-45ac-9c46-47a5099dbc5aNational Research Council Canada Institute for Ocean Technology Conseil national de recherches Canada Institut des technologies oc ´eaniques
IR-2009-15
Institute Report
Study of podded propulsors with varied bub angle and
configurations
Islam, M.; Veitch, B.; Liu, P.; Akinturk, A.,
Islam, M.; Veitch, B.; Liu, P.; Akinturk, A., 2009. Study of podded propulsors with varied bub angle and configurations. International Journal of Maritime Engineering, 151 (A1) : 19-34.
STUDY OF PODDED PROPULSORS WITH VARIED HUB ANGLES AND
CONFIGURATIONS
M F Islam, Oceanic Consulting Corporation, Canada, B Veitch, Memorial University of Newfoundland, Canada, P Liu,
Institute of Ocean Technology, National Research Council Canada, and A Akinturk, Institute of Ocean Technology, National Research Council Canada.
SUMMARY
This paper presents an experimental study on the effects of tapered hub on the propulsive characteristics of puller and pusher podded propulsors in straight course and static azimuthing conditions while operating in open water. The propulsive performance of two model pod units having the same pod-strut shape and propeller blade geometry with different hub shapes were measured using a custom designed pod dynamometer. The dynamometer system consisted of a six-component global dynamometer and a three-component pod dynamometer. The measurements consisted of the forces and moments of the units in the three co-ordinate directions and thrust and torque of the propellers for a range of advance coefficients from 0 to 1.2 combined with the range of static azimuthing angles from +30° to –30° in 15° increments in pusher and puller configurations. The variations in the propulsive performance due to the change in hub geometry in straight ahead conditions were examined first, followed by a study on the effects in different static azimuthing angles. Comparison of the results of the two pod units illustrated that in both pusher and puller configurations, the effect of hub taper angle is more significant at lower advance coefficients while the effects increased with increasing azimuthing angle.
Keywords: Podded propulsor; hub taper angle; pusher and puller configurations; propulsive performance; global forces and
moments; open water condition. 1. INTRODUCTION
Podded propulsion systems have gained widespread application as the main propulsion system for cruise, ferry and other purposes of ships by exhibiting technical and economical advantages over traditional propulsion systems. The inflow condition encountered by these propulsors varies with the change of azimuthing angles and configurations (i.e. push and pull) and requires a separate study. Some of the specific hydrodynamic issues that require further investigation include questions regarding the effects of propeller hub taper angle and pod-strut configurations on podded propulsor’s performance at straight course and azimuthing conditions. The current work focuses on these issues.
To the authors’ knowledge, there has not been any published work, which investigated the effect of hub geometry on podded propulsor’s performance in azimuthing conditions. Reported research associated with the hydrodynamic behaviour of podded propulsors in azimuthing conditions is also limited [1]. Szantyr ([2] and [3]) published one of the first sets of systematic experimental data on podded propulsors as the main propulsion unit at static azimuthing angles. The study was limited to azimuthing angles of ±15°. Grygorowicz and Szantyr [4] presented open-water measurements of podded propulsors both in puller and pusher configurations from tests in a circulating water channel. Heinke [5] reported on comprehensive and systematic model test results, with a 4- and 5-bladed propeller fitted to a generic pod housing in
pull- and push-modes. Stettler [6] investigated steady and unsteady dynamic manoeuvring forces associated with an azimuthing podded propulsor, and also provided supporting theoretical insight toward understanding their mechanisms and prediction. Woodward [7] identified a few new methods for modelling the hydrodynamic reaction for both the ship hull and pod drive. Reichel [8] presented the preliminary part of comprehensive manoeuvring open water tests of a gas carrier model primarily focusing on open water experiments with an azimuthing podded propulsor. Wang [9] performed a study to understand propeller-ice interaction phenomena and developed a numerical method to predict the interaction ice loads at different azimuthing conditions.
The geometry of the pod-strut body of a podded propulsor necessitates the propeller to have a tapered (conical) hub to allow for a smooth transition between the propeller hub and the pod-strut body (see Figure 1). The change in the hub geometry, as compared to a conventional screw propeller with a cylindrical hub, was found to have an influence on the propulsive characteristics both in “propeller only case” and “propeller with pod-strut body or pod unit case” ([10], [11], [12], [13], [14] and [15]). These studies were carried out primarily in straight-ahead open water conditions. As a continuation of the previous work carried out by the authors’ group, tests were conducted to examine the effect of hub taper angle at various azimuthing conditions and both in push and pull configurations. The current study presents comparisons of open water propulsive performance of two model pod units having the same
pod-strut-propeller geometry but different hub shapes in puller and pusher configurations and at various static azimuthing angles.
Figure 1. Podded propulsion system: puller and pusher types and the definition of hub taper angle.
2. PROPELLER AND POD MODELS
In the current study, two model pod units – named Pod 01 and Pod 02 were used. The pod models had the same geometrical particulars except the fore (propeller) ends, which had different taper angles, to provide a smooth transition between the propeller hub and the pod units. The geometric particulars of the pod-strut model were defined using the parameters depicted in Figure 2. The values for the model propulsor were selected to provide an average representation of in-service, full-scale single screw podded propulsors. The particulars of the pod-strut body tested are shown in Table 1. Figure 3 shows the rendered and physical model of the two units.
Figure 2. Geometric parameters used to define pod-strut geometry.
Table 1. Geometric particulars of the pod-strut models.
Pod 01 Pod 02
Propeller Diameter, DProp 270 mm 270 mm
Pod Diameter, DPod 139 mm 139 mm
Pod Length, LPod 410 mm 410 mm
Strut Height, SHeight 300 mm 300 mm
Strut Chord Length 225 mm 225 mm Strut Distance, SDist 100 mm 100 mm
Strut Width 60 mm 60 mm
Fore Taper Length 85 mm 85 mm
Fore Taper Angle 15° 20°
Aft Taper Length 110 mm 110 mm
Aft Taper Angle 25° 25°
Figure 3b. Rendered and physical model of the two pods fitted with propellers: left – Pod 01 and right – Pod02. Four model propellers were used with these two pod units in pusher and puller configurations: two for each configuration to suit the different hub taper angles. The propellers had the same blade sections. The basic geometrical particulars of the propellers are given in Table 2. For the details of the propeller geometry in this study see Liu [16].
The four propellers had hub taper angles of 15° (right handed pusher configuration, Push+15°), 20° (right handed pusher configuration, Push+20°), -15° (left handed puller configuration, Pull-15°), -20° (right handed puller configuration, Pull-20°). Figure 4 shows a photograph and a rendered view of the model propellers.
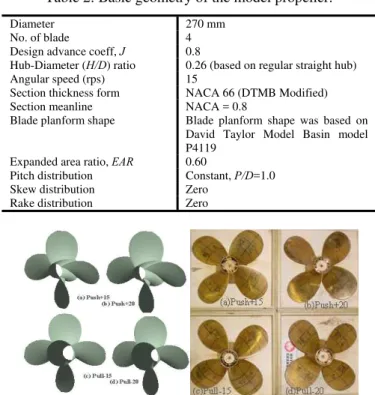
Table 2: Basic geometry of the model propeller.
Diameter 270 mm
No. of blade 4
Design advance coeff, J 0.8
Hub-Diameter (H/D) ratio 0.26 (based on regular straight hub) Angular speed (rps) 15
Section thickness form NACA 66 (DTMB Modified) Section meanline NACA = 0.8
Blade planform shape Blade planform shape was based on David Taylor Model Basin model P4119
Expanded area ratio, EAR 0.60 Pitch distribution Constant, P/D=1.0 Skew distribution Zero
Rake distribution Zero
Figure 4. Four model propellers (Left hand side - rendered model; Right hand side - physical model): a, b, c, d are the
propellers with hub taper angles of +15° (push), +20° (pull), -15° (pull), -20° (pull), respectively.
3. EXPERIMENTAL SET UP AND TEST CONDITIONS
Open water tests of the model pod units in straight course and at static azimuth angles were performed in accordance with the ITTC recommended procedure, Podded Propulsor Tests and Extrapolation, 7.5-02-03-01.3 [17], and the description provided by Mewis [18]. A custom-designed dynamometer system [19] was used to measure propeller thrust, torque, and unit forces in the three orthogonal coordinate directions. With the exception of torque, all forces were measured with off the shelf load cells. Torque was measured using strain gauges. In the instrumentation, a boat shaped body called a wave shroud was attached to the frame of the test equipment. The bottom of the shroud was mounted 3 mm to 5 mm above the water surface to suppress waves caused by the strut piercing the surface. The center of the propeller shaft was 1.5DProp below the
water surface. The part of the shaft above the strut (the shaft that was connected the pod unit to the main drive) went through the shroud. Water temperature, carriage speed, VA, and the rotational speed of the propeller shaft, n,
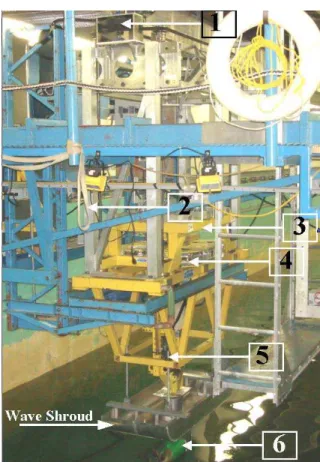
were measured. Figure 5 shows the experimental apparatus as installed in the Ocean Engineering Research Centre (OERC) towing tank. A further description of the dynamometer system can be found in [19].
The propulsor was steered to different static azimuthing conditions by rotating the entire lower part of the instrumentation (instrumented pod unit and the main drive as shown in Figure 5). The pod units were tested in the puller configuration with the two model pod units with the respective propellers designed for pull mode, Pull-15 and
Pull-20. The entire instrumentation was then set up in the
reverse position to convert it to pusher configuration. The
Pull-15 and Pull-20 propellers were also replaced with the Push+15 and Push+20 propellers with hub shape designed
for push configuration. Table 3 shows the test matrix for the static azimuthing tests conducted using the two model pod units. Both of the pods were tested at the same test points to ensure a systematic test of the pod series and to facilitate the analysis process.
Table 3. Test matrix for systematic static azimuthing podded propulsors’ tests.
Pod Name Azimuthing Angle (°) Shaft speed, n (rps) Carriage Speed, VA (m/s) Pod 01
Pusher Mode Pod 02
-30, -20, -15, -10, -5, 0, 5,10, 15, 20, 30 11 (determined using the Reynolds Number test) 0.0, 0.2, 0.4, 0.6, 0.8, 1.0, 1.2, 1.4, 1.6, 1.8, 2.0,2.2, 2.4, 2.6, 2.8, 3.0, 3.2 Pod 01
Puller Mode Pod 02
-30, -20, -15, -10, -5, 0, 5,10, 15, 20, 30 11 0.0, 0.2, 0.4, 0.6, 0.8, 1.0, 1.2, 1.4, 1.6, 1.8, 2.0,2.2, 2.4, 2.6, 2.8, 3.0, 3.2
Figure 5. Major components of the experimental apparatus used in the podded propulsor tests: The apparatus installed
in the towing tank.
In the current tests with the pod units in azimuthing conditions, the Reynolds Number based on propeller blade chord length at 0.7R ranged approximately from 6.39E+05 to 7.28E+05, the Reynolds Number based on pod length ranged approximately from 5.5E+05 to 1.5E+06 and the
Reynolds Number based on strut chord length ranged
approximately from 2.6E+05 to 8.0E+05.
4. RESULTS AND DISCUSSIONS
In the current study, the pod dynamometer system measures propeller and pod forces and moments, namely: propeller shaft thrust (TProp), propeller shaft torque (Q), unit
axial/longitudinal force (FX) and moment (MX), unit
side/transverse force (FY) and moment (MY), and unit
vertical force (FZ) and moment (MZ).
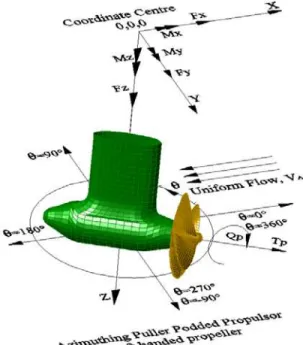
The global dynamometer was calibrated using the method described by Hess et al. [20] and Galway [21]. The definition of the forces, moments and co-ordinates that were used to analyze the data and present the results are shown in Figure 6. The centre of the coordinate system situated vertically 1.68 m above the pod centre, which is the intersection of the horizontal axis through the centre of the propeller shaft and the vertical axis passing through the centre of the strut. The propeller thrust and torque were
measured at the propeller end of the shaft. The propeller and unit forces and moments are presented in the form of traditional non-dimensional coefficients as defined in Table 4.
Figure 6. Definitions of forces, moments, coordinate of the puller and pusher azimuthing podded propulsors. Table 4. Data reduction equations and definitions of different parameters used to present the experimental data.
Performance Characteristics Data Reduction
Equation
KTProp – propeller thrust coefficient 2 4 Prop/ n D
T ρ
KTUnit– unit thrust coefficient,
or longitudinal force coefficient, KFX
4 2 Unit/ n D T ρ 4 2 / n D FX ρ or
10KQ – propeller torque coefficient 10Q/ρn2D5
J – propeller advance coefficient V nD
A/
ηProp – propeller efficiency
(
)
Q
T K
K J/2π× Prop/
ηUnit – unit efficiency
(
)
Q
T K
K J/2π× Unit/
KFZ – transverse force coefficient F / n2D4
Y ρ
KFZ– vertical force coefficient F / n2D4
Z ρ
KMX– moment coefficient about x axis M / n2D5
X ρ
KMY– moment coefficient about y axis M / n2D5
Y ρ
KMZ– moment coefficient around z axis
(steering moment) 5 2 / n D MZ ρ Where, TProp - propeller thrust Q - propeller torque
n – propeller rotational speed TUnit - unit thrust
D – propeller diameter ρ – water density VA - propeller advance speed, in the direction of carriage motion
F X, Y, Z - components of the hydrodynamic force on the pod
M X, Y, Z - components of the hydrodynamic moment on the pod
It should be noted that propeller advance coefficient, J is defined by projecting the propeller advance speed, VA in
the direction of carriage motion (in the direction of X in the inertia frame), not in the direction of propeller axis. The propeller thrust, TProp is defined in the direction of the
propeller axis, and FX is the projected force on X-axis in
the inertial frame.
4.1. EFFECTS ON PROPULSIVE PERFORMANCE
In this section, the effects of hub angle on propeller thrust, torque and efficiency, and unit thrust and efficiency are evaluated for puller and pusher configurations. In each configuration, the performance coefficients of the two units were measured and compared in straight course and ±15° and ±30° azimuthing conditions. An analysis of variance (ANOVA) test done using Design Expert® is presented. The purpose of this test was to determine the factors that were significant for the variations in performance coefficients, e.g. thrust and torque coefficients. The results are given in Table 5 for both push and pull configurations. In the table, A is Hub angle, B is Azimuth angle, and C is Advance coefficient (J). Any combination of the letters are for combined effects, for example, AC represents the combined effects of Hub angle and Advance coefficient, J. Values of “Prob > F” less than 0.05 indicate terms are significant. According to the table, the effects of hub angle on KTProp, KTUnit and 10KQ seem statistically significant for
both push and pull configurations. The rest of this section gives a detailed account of the effects.
4.1.1. PULLER CONFIGURATION
The propeller thrust coefficient, KTProp, torque coefficients,
10KQ, propeller efficiency, ηProp, unit thrust coefficient,
KTUnit, and unit efficiency, ηUnit of the two units plotted
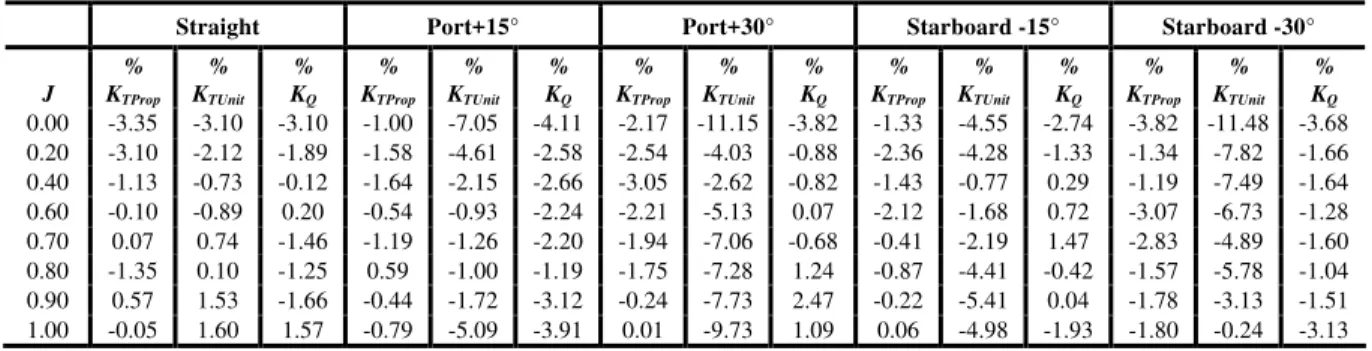
against propeller advance coefficient, J in straight-ahead conditions and at azimuthing conditions of +15° (port), +30° (port), -15° (starboard), -30° (starboard) angles are presented in Figures 7 to 11. Table 6 shows comparison of the performance of the two propulsors, that is the one with 15° hub angle (Pod01) and the other with 20° hub angle (Pod02), at different operating conditions in puller configuration. In the table the positive numbers mean the performance characteristics of Pod01 are higher than those of Pod02 and visa versa. All numbers are percentages based on Pod01. The values in the table are calculated using the following formulation:
100
%
0 . 0 1 2 1−
×
=
= J P P PQ
Q
Q
q
………….………..…….(1)where, Q is the performance parameter under
consideration, subscripts P1 and P2 represent Pod 01 and Pod 02, respectively, J=0.0 means the value of the parameter at the bollard pull. Symbol %q stands for the difference between the two pods as a percentage of the first one.
It is observed in Figure 7 and Table 6 in straight-ahead condition, increasing the hub angle generally increased both propeller thrust and torque for all advance coefficient values but with diminishing effects at higher advance coefficients. At moderate advance coefficient values of 0.4 to 0.8, no clear trend was observed, which may be attributed to uncertainty in the measurements.
In azimuthing conditions (Figures 8 to 11 and Table 6), both in positive (port) and negative (starboard) azimuthing
angles, increasing the hub angle generally increased both propeller thrust and torque. In all cases, the maximum increases were observed in bollard pull and low advance coefficient conditions (advance coefficient, J < 0.4). As the advance coefficient was increased the effects decreased. The increase in thrust and toque, especially at low advance coefficient can be attributed to the drastic change in the blade root pressure distribution as explained in [10]. It is possible that this effect increased with increasing azimuthing angle.
Table 5. Some of the Analysis of Variance results from Design Expert®
KTProp KTUnit 10KQ
Factor
Pusher Puller Pusher Puller Pusher Puller
Model < 0.0001 < 0.0001 < 0.0001 < 0.0001 < 0.0001 < 0.0001 A < 0.0001 < 0.0001 < 0.0001 < 0.0001 < 0.0001 < 0.0001 B < 0.0001 < 0.0001 < 0.0001 < 0.0001 < 0.0001 < 0.0001 C < 0.0001 < 0.0001 < 0.0001 < 0.0001 < 0.0001 < 0.0001 AB < 0.0001 0.0320 < 0.0001 < 0.0001 < 0.0001 < 0.0001 AC < 0.0001 < 0.0001 < 0.0001 0.0734 < 0.0001 < 0.0001 BC < 0.0001 < 0.0001 < 0.0001 < 0.0001 < 0.0001 < 0.0001 ABC < 0.0001 0.0097 < 0.0001 < 0.0001 < 0.0001 < 0.0001
From Figure 7 and Table 6, it is observed that in straight-ahead condition, increasing the hub angle increased the unit thrust for advance coefficient values up to 0.6 but as the advance coefficient was increased further, the unit thrust was decreased with the increase of hub angle. However, at all azimuthing conditions, Pod02 had higher unit thrust than Pod01 at all advance coefficient values. The effects are summarized in Table 7. The expected lower unit thrust and efficiency as compared to the propeller thrust and efficiency, respectively was observed at all advance coefficients. The difference between the propeller thrust and the unit thrust increased with increasing azimuthing angles, which can be attributed to the increasing drag on the pod unit. The difference was approximately same for both pod units.
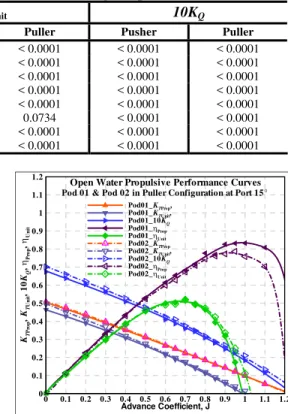
Advance Coefficient, J KT Pr o p , KT Un it ,1 0 KQ , ηPro p , ηUn it 0 0.1 0.2 0.3 0.4 0.5 0.6 0.7 0.8 0.9 1 1.1 1.2 0 0.1 0.2 0.3 0.4 0.5 0.6 0.7 0.8 0.9 1 1.1 1.2 Pod01_KTProp, Pod01_KTUnit, Pod01_10KQ Pod01_ηProp Pod01_ηUnit Pod02_KTProp Pod02_KTUnit, Pod02_10KQ Pod02_ηProp Pod02_ηUnit
Open Water Propulsive Performance Curves
Pod 01 & Pod 02 in Puller Configuration at Port 15°
Figure 8. Propeller and unit performance of the two pod units in +15° (port side) azimuthing angle and in puller
configuration. Advance Coefficient, J KT Pr o p , KT Un it ,1 0 KQ , ηPr o p , ηUn it 0 0.1 0.2 0.3 0.4 0.5 0.6 0.7 0.8 0.9 1 1.1 1.2 0 0.1 0.2 0.3 0.4 0.5 0.6 0.7 0.8 0.9 1 1.1 1.2 Pod01_KTProp, Pod01_KTUnit, Pod01_10KQ Pod01_ηProp Pod01_ηUnit Pod02_KTProp Pod02_KTUnit, Pod02_10KQ Pod02_ηProp Pod02_ηUnit
Open Water Propulsive Performance Curves
Pod 01 & Pod 02 in Puller Configuration at Straight Course
Advance Coefficient, J KT Pr o p , KT Un it ,1 0 KQ , ηPro p , ηUn it 0 0.1 0.2 0.3 0.4 0.5 0.6 0.7 0.8 0.9 1 1.1 1.2 0 0.1 0.2 0.3 0.4 0.5 0.6 0.7 0.8 0.9 1 1.1 1.2 Pod01_KTProp, Pod01_KTUnit, Pod01_10KQ Pod01_ηProp Pod01_ηUnit Pod02_KTProp Pod02_KTUnit, Pod02_10KQ Pod02_ηProp Pod02_ηUnit
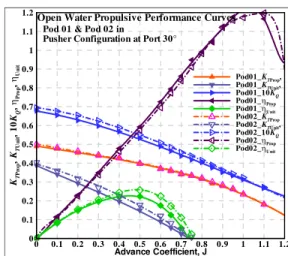
Open Water Propulsive Performance Curves
Pod 01 & Pod 02 in Puller Configuration at Port 30°
Figure 7. Propeller and unit performance of the two pod units in straight-ahead condition and in puller
configuration.
Figure 9. Propeller and unit performance of the two pod units in +30° (port side) azimuthing angle and in puller
Advance Coefficient, J KT Pr o p , KT Un it ,1 0 KQ , ηPro p , ηUn it 0 0.1 0.2 0.3 0.4 0.5 0.6 0.7 0.8 0.9 1 1.1 1.2 0 0.1 0.2 0.3 0.4 0.5 0.6 0.7 0.8 0.9 1 1.1 1.2 Pod01_KTProp, Pod01_KTUnit, Pod01_10KQ Pod01_ηProp Pod01_ηUnit Pod02_KTProp Pod02_KTUnit, Pod02_10KQ Pod02_ηProp Pod02_ηUnit
Open Water Propulsive Performance Curves
Pod 01 & Pod 02 in Puller Configuration at Starboard 15°
Figure 10. Propeller performance of the two pod units in -15° (starboard side) azimuthing angle and in puller
configuration. Advance Coefficient, J KT Pr o p , KT Un it ,1 0 KQ , ηPro p , ηUn it 0 0.1 0.2 0.3 0.4 0.5 0.6 0.7 0.8 0.9 1 1.1 1.2 0 0.1 0.2 0.3 0.4 0.5 0.6 0.7 0.8 0.9 1 1.1 1.2 Pod01_KTProp, Pod01_KTUnit, Pod01_10KQ Pod01_ηProp Pod01_ηUnit Pod02_KTProp Pod02_KTUnit, Pod02_10KQ Pod02_ηProp Pod02_ηUnit
Open Water Propulsive Performance Curves
Pod 01 & Pod 02 in Puller Configuration at Starboard 30°
Figure 11. Propeller performance of the two pod units in -30° (starboard side) azimuthing angle and in puller
configuration.
Table 6. Comparison of propeller thrust and torque coefficients in straight course and azimuthing conditions in puller configuration. Percentage differences were calculated based on the characteristics of Pod01.
Straight Port+15° Port+30° Starboard -15° Starboard -30°
J % KTProp % KTUnit % KQ % KTProp % KTUnit % KQ % KTProp % KTUnit % KQ % KTProp % KTUnit % KQ % KTProp % KTUnit % KQ 0.00 -3.35 -3.10 -3.10 -1.00 -7.05 -4.11 -2.17 -11.15 -3.82 -1.33 -4.55 -2.74 -3.82 -11.48 -3.68 0.20 -3.10 -2.12 -1.89 -1.58 -4.61 -2.58 -2.54 -4.03 -0.88 -2.36 -4.28 -1.33 -1.34 -7.82 -1.66 0.40 -1.13 -0.73 -0.12 -1.64 -2.15 -2.66 -3.05 -2.62 -0.82 -1.43 -0.77 0.29 -1.19 -7.49 -1.64 0.60 -0.10 -0.89 0.20 -0.54 -0.93 -2.24 -2.21 -5.13 0.07 -2.12 -1.68 0.72 -3.07 -6.73 -1.28 0.70 0.07 0.74 -1.46 -1.19 -1.26 -2.20 -1.94 -7.06 -0.68 -0.41 -2.19 1.47 -2.83 -4.89 -1.60 0.80 -1.35 0.10 -1.25 0.59 -1.00 -1.19 -1.75 -7.28 1.24 -0.87 -4.41 -0.42 -1.57 -5.78 -1.04 0.90 0.57 1.53 -1.66 -0.44 -1.72 -3.12 -0.24 -7.73 2.47 -0.22 -5.41 0.04 -1.78 -3.13 -1.51 1.00 -0.05 1.60 1.57 -0.79 -5.09 -3.91 0.01 -9.73 1.09 0.06 -4.98 -1.93 -1.80 -0.24 -3.13
Table 7. Summary of the effects of hub taper angle on propeller thrust and torque and unit thrust at different azimuthing conditions in puller configuration.
Change of geometry and test conditions Resultant effects
Hub Taper Angle
Azimuthing Conditions
Advance
Coefficient, J Propeller Thrust, KTProp Propeller Torque, KQ Unit Thrust, KTUnit
Increase Straight-ahead Increase Increase (inconsistency at
J=0.8 and J=1.0) Increase for most part
Increase for J <=0.6; decrease at higher Js Increase Port 15° Increase Increase (for all Js but
around J=0.8) Increase (all Js) Increase (all Js) Increase Port 30° Increase Increase (all Js) Increase for J <=0.7;
decrease at higher Js Increase (all Js) Increase Starboard -15° Increase decrease at higher Js Increase (J<=0.9); Increase for all Js but 0.4 < J <0.8 Increase (all Js) Increase Starboard -30° Increase Increase (all Js) Increase (all Js) Increase (all Js)
4.1.2. PUSHER CONFIGURATION:
Similar to the study performed in puller configuration, a study was done in pusher configuration with the same pod-strut bodies attached to the propellers Push+15° and
Push+20°. Figures 12 to 16 present propeller and unit
performance characteristics of the two units in pusher configuration plotted against propeller advance coefficient,
J in straight-ahead conditions and at azimuthing angles of
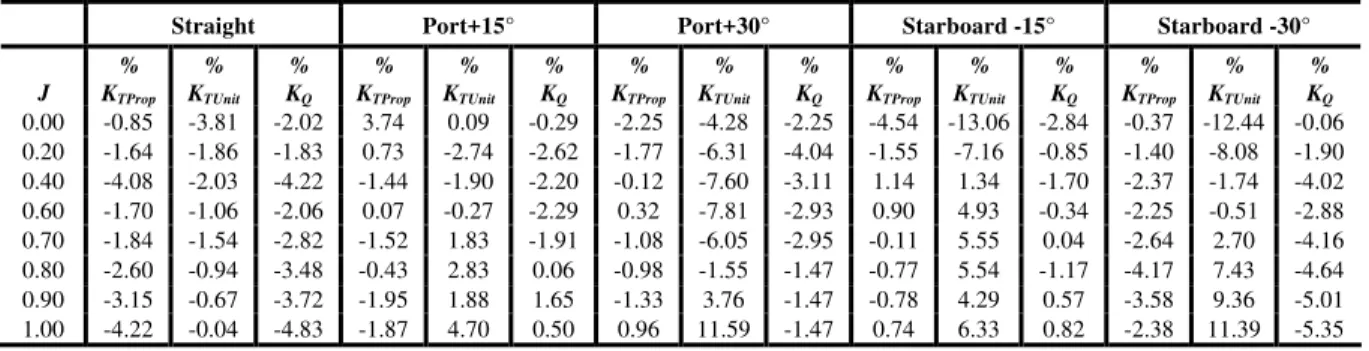
+15° (port), +30° (port), -15° (starboard), -30° (starboard). Table 8 shows the differences in the performance of the
two propulsors at different operating conditions.
Unlike puller configuration, in straight-ahead pusher configuration, the propeller with higher hub angle had higher thrust and torque as compared to the propeller with smaller hub angle at all advance coefficients. Also, the difference in performance increased as the advance coefficient increased (Figure 12 and Table 8). The effects of hub angle with the change of advance coefficient and azimuthing angles are summarized in Table 9. This effect can primarily be attributed to the change of blade root
section for different hub angle. More pronounced effect of hub angle was observed as the azimuthing angle was increased.
In straight-ahead condition, increasing the hub angle increased the unit thrust for all advance coefficient values and the effect decreased as the advance coefficient increased. However, at positive azimuthing conditions, the unit with larger hub angle produced higher unit thrust than the unit with smaller hub angle at low and moderate advance coefficient values, but lower at higher advance coefficients. At negative azimuthing angles, the unit with larger hub angle produced higher unit thrust than the unit with smaller hub angle at low advance coefficient values but lower at moderate and higher advance coefficients. The difference in the effect of azimuthing angle in the positive and negative directions was primarily because of the strong interaction between the strut wake and the propeller direction of rotation. This effect was also observed in [5] and [6]. Tables 8 and 9 summarize the effects mentioned above. Advance Coefficient, J KT Pr o p , KT Un it ,1 0 KQ , ηPro p , ηUn it 0 0.1 0.2 0.3 0.4 0.5 0.6 0.7 0.8 0.9 1 1.1 1.2 0 0.1 0.2 0.3 0.4 0.5 0.6 0.7 0.8 0.9 1 1.1 1.2 Pod01_KTProp, Pod01_KTUnit, Pod01_10KQ Pod01_ηProp Pod01_ηUnit Pod02_KTProp Pod02_KTUnit, Pod02_10KQ Pod02_ηProp Pod02_ηUnit
Open Water Propulsive Performance Curves
Pod 01 & Pod 02 in Pusher Configuration at Straight Course
Figure 12. Propeller and unit performance of the two pod units in straight-ahead condition and in pusher
configuration. Advance Coefficient, J KT Pr o p , KT Un it ,1 0 KQ , ηPro p , ηUn it 0 0.1 0.2 0.3 0.4 0.5 0.6 0.7 0.8 0.9 1 1.1 1.2 0 0.1 0.2 0.3 0.4 0.5 0.6 0.7 0.8 0.9 1 1.1 1.2 Pod01_KTProp, Pod01_KTUnit, Pod01_10KQ Pod01_ηProp Pod01_ηUnit Pod02_KTProp Pod02_KTUnit, Pod02_10KQ Pod02_ηProp Pod02_ηUnit
Open Water Propulsive Performance Curves
Pod 01 & Pod 02 in Pusher Configuration at Port 15°
Figure 13. Propeller and unit performance of the two pod units in +15° (port side) azimuthing angle and in pusher
configuration. Advance Coefficient, J KT Pr o p , KT Un it ,1 0 KQ , ηPr o p , ηUn it 0 0.1 0.2 0.3 0.4 0.5 0.6 0.7 0.8 0.9 1 1.1 1.2 0 0.1 0.2 0.3 0.4 0.5 0.6 0.7 0.8 0.9 1 1.1 1.2 Pod01_KTProp, Pod01_KTUnit, Pod01_10KQ Pod01_ηProp Pod01_ηUnit Pod02_KTProp Pod02_KTUnit, Pod02_10KQ Pod02_ηProp Pod02_ηUnit
Open Water Propulsive Performance Curves
Pod 01 & Pod 02 in
Pusher Configuration at Port 30°
Figure 14. Propeller and unit performance of the two pod units in +30° (port side) azimuthing angle and in pusher
configuration. Advance Coefficient, J KT Pr o p , KT Un it ,1 0 KQ , ηPro p , ηUn it 0 0.1 0.2 0.3 0.4 0.5 0.6 0.7 0.8 0.9 1 1.1 1.2 0 0.1 0.2 0.3 0.4 0.5 0.6 0.7 0.8 0.9 1 1.1 1.2 Pod01_KTProp, Pod01_KTUnit, Pod01_10KQ Pod01_ηProp Pod01_ηUnit Pod02_KTProp Pod02_KTUnit, Pod02_10KQ Pod02_ηProp Pod02_ηUnit
Open Water Propulsive Performance Curves
Pod 01 & Pod 02 in Pusher Configuration at Starboard 15°
Figure 15. Propeller and unit performance of the two pod units in -15° (starboard side) azimuthing angle and in
pusher configuration. Advance Coefficient, J KT Pr o p , KT Un it ,1 0 KQ , ηPro p , ηUn it 0 0.1 0.2 0.3 0.4 0.5 0.6 0.7 0.8 0.9 1 1.1 1.2 0 0.1 0.2 0.3 0.4 0.5 0.6 0.7 0.8 0.9 1 1.1 1.2 Pod01_KTProp, Pod01_KTUnit, Pod01_10KQ Pod01_ηProp Pod01_ηUnit Pod02_KTProp Pod02_KTUnit, Pod02_10KQ Pod02_ηProp Pod02_ηUnit
Open Water Propulsive Performance Curves
Pod 01 & Pod 02 in Pusher Configuration at Starboard 30°
Figure 16. Propeller performance of the two pod units in -30° (starboard side) azimuthing angle and in pusher
Table 8. Comparison of propeller thrust and torque coefficients in straight course and azimuthing conditions in pusher configuration. Percentage differences were calculated based on the characteristics of Pod01.
Straight Port+15° Port+30° Starboard -15° Starboard -30°
J % KTProp % KTUnit % KQ % KTProp % KTUnit % KQ % KTProp % KTUnit % KQ % KTProp % KTUnit % KQ % KTProp % KTUnit % KQ 0.00 -0.85 -3.81 -2.02 3.74 0.09 -0.29 -2.25 -4.28 -2.25 -4.54 -13.06 -2.84 -0.37 -12.44 -0.06 0.20 -1.64 -1.86 -1.83 0.73 -2.74 -2.62 -1.77 -6.31 -4.04 -1.55 -7.16 -0.85 -1.40 -8.08 -1.90 0.40 -4.08 -2.03 -4.22 -1.44 -1.90 -2.20 -0.12 -7.60 -3.11 1.14 1.34 -1.70 -2.37 -1.74 -4.02 0.60 -1.70 -1.06 -2.06 0.07 -0.27 -2.29 0.32 -7.81 -2.93 0.90 4.93 -0.34 -2.25 -0.51 -2.88 0.70 -1.84 -1.54 -2.82 -1.52 1.83 -1.91 -1.08 -6.05 -2.95 -0.11 5.55 0.04 -2.64 2.70 -4.16 0.80 -2.60 -0.94 -3.48 -0.43 2.83 0.06 -0.98 -1.55 -1.47 -0.77 5.54 -1.17 -4.17 7.43 -4.64 0.90 -3.15 -0.67 -3.72 -1.95 1.88 1.65 -1.33 3.76 -1.47 -0.78 4.29 0.57 -3.58 9.36 -5.01 1.00 -4.22 -0.04 -4.83 -1.87 4.70 0.50 0.96 11.59 -1.47 0.74 6.33 0.82 -2.38 11.39 -5.35
Table 9. Summary of the effects of hub taper angle on propeller thrust and torque and unit thrust at different azimuthing conditions in puller configuration.
Change of Geometry and Test Conditions Resultant Effects
Hub Taper Angle
Azimuthing Conditions
Advance
Coefficient, J Propeller Thrust, KTProp Propeller Torque, KQ Unit Thrust, KTUnit
Increase Straight-ahead Increase Increase (all Js) Increase (all Js) Increase (all Js)
Increase Port 15° Increase
Decrease (J<=0.3); Increase (J>=0.4); (inconsistency at J=0.6) Increase (J<0.8); Decrease (J>=0.8) Increase (J<=0.6); Decrease (J>=0.7); (inconsistency at J=0.0) Increase Port 30° Increase
Increase (all Js); (inconsistency at J=0.6 and
1.0)
Increase (all Js) Increase (J<=0.8); Decrease (J>0.8) Increase Starboard -15° Increase
Increase (all Js); (inconsistency at J=0.4 and 0.6) Increase (J<=0.8); Decrease (J>=0.9); (inconsistency at J=0.7) Increase (J<=0.4); Decrease (J>0.4); Increase Starboard -30° Increase Increase (all Js) Increase (all Js) Increase (J<=0.6); Decrease (J>0.6);
4.2. EFFECTS ON UNIT FORCES AND MOMENTS
In this section, the effect of hub angle on unit transverse and vertical forces and unit axial, transverse and steering moments are evaluated for different azimuthing conditions. At each azimuthing angle, the performance coefficients of the two units were measured and compared both in puller and pusher configurations.
4.2.1. PULLER CONFIGURATION
The transverse force coefficient, KFY, vertical force
coefficient, KFZ, axial moment coefficient, KMX, transverse
moment coefficient, KMY, and steering moment coefficient,
KMZ, of the two units plotted against propeller advance
coefficient, J in straight-ahead conditions and at azimuthing conditions of +15° (port), +30° (port), -15° (starboard), -30° (starboard) angles are presented in Figures 17 to 21. Table 10 and 11 show the differences in the forces and moments between the two units at different operating conditions. Equation 2 was used to calculate the percentage differences. All numbers are percentages based on Pod01.
100
%
1 2 1−
×
=
P P PQ
Q
Q
q
………….………..…….(2)where, %q is the value of the difference in the forces and moments differences provided in the table in percentage,
QP1 is the values of forces and moments of the Pull-15°
unit, and QP2 is the values of forces and moments of the
Pull-20° unit.
As shown in Figure 17 and Table 10, for both units, the propulsor produced an increase in transverse force with both positive and negative azimuth angles but in opposite directions with the increase of advance coefficient, J. The contribution of the propeller wash and strut interactions to the transverse force is expected to be small compared to thrust and “drag and lift” forces. At straight-ahead condition, the unit, Pod01 (attached to a left handed propeller) showed negative transverse force and the unit, Pod02 (attached to a right handed propeller) showed positive transverse force for all advance coefficient values. In general, at all azimuthing conditions, the Pod02 unit produced higher transverse forces as compared with the Pod01 unit. However, the differences were higher at negative azimuthing conditions. Thus, the difference in transverse force was not only due to the change in hub angle but also for the change in the direction of rotation of the propeller.
Advance Coefficient,J T ra n sve rse F o rc e C o e ff ic ie n t, KF Y 0 0.1 0.2 0.3 0.4 0.5 0.6 0.7 0.8 0.9 1 1.1 1.2 -0.6 -0.4 -0.2 0 0.2 0.4 0.6 0.8 1 Pod01_St Pod01_15Port Pod01_30Port Pod01_15Stbd Pod01_30Stbd Pod02_St Pod02_15Port Pod02_30Port Pod02_15Stbd Pod02_30Stbd
Transverse Force Coefficient,KFY
Pod 01 & Pod 02 in Puller Config.
Figure 17. Transverse force coefficient curves of the two pod units at different azimuthing angles and in puller
configuration.
Figure 18 and Table 9 show the change of vertical force coefficients with advance coefficient and azimuth angles in puller configuration for Pod01 and Pod 02. For a given azimuth angle, the vertical force increased with an increase in advance coefficient, and reaches a maximum at advance coefficients of 0.6 and higher. In opposite azimuthing conditions, the sign of the force changed. Both pod units showed a similar tendency. In general, the pod unit with larger hub angle produced higher vertical forces than the pod unit with a smaller hub angle for all azimuthing conditions. Advance Coefficient,J V e rt ic a l F o rc e C o e ff ic ie n t, KF Z 0 0.1 0.2 0.3 0.4 0.5 0.6 0.7 0.8 0.9 1 1.1 1.2 -0.2 -0.1 0 0.1 0.2 0.3 0.4 0.5 Pod01_St Pod01_15Port Pod01_30Port Pod01_15Stbd Pod01_30Stbd Pod02_St Pod02_15Port Pod02_30Port Pod02_15Stbd Pod02_30Stbd
Vertical Force Coefficient,KFZ
Pod 01 & Pod 02 in Puller Config.
Figure 18. Vertical force coefficient curves of the two pod units at different azimuthing angles and in puller
configuration.
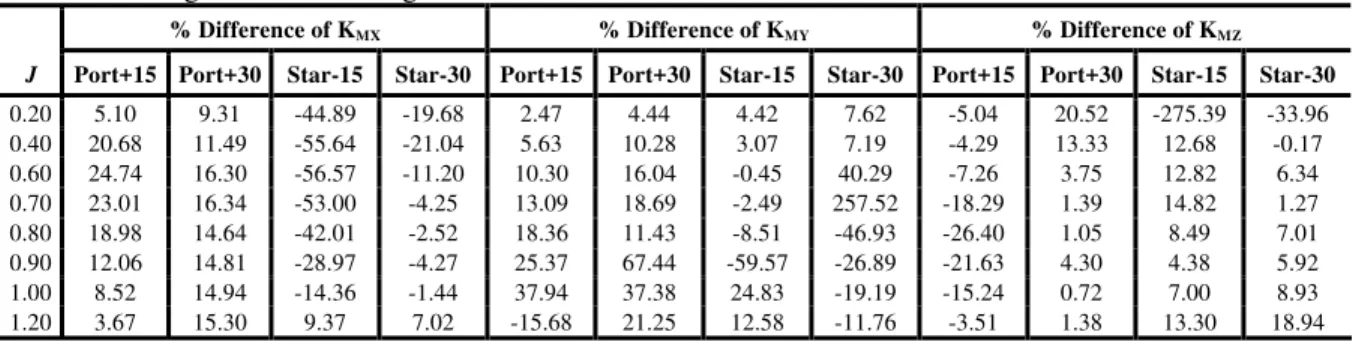
Figure 19 and Table 11 show that axial moment increased with increasing advance coefficients for both positive and negative azimuth angles, but in opposite directions. At straight-ahead condition, the Pod01 unit (attached to a left handed propeller) showed positive axial moment and the
unit, Pod02 (attached to a right handed propeller) produced a negative axial moment for advance coefficient values less than 1.1. At positive azimuthing condition, Pod01 produced higher axial moment and at negative azimuthing conditions, the Pod02 unit produced higher axial moment than Pod01. Advance Coefficient,J A x ia l M om en t C o e ffi c ien t, KM X 0 0.1 0.2 0.3 0.4 0.5 0.6 0.7 0.8 0.9 1 1.1 1.2 -4 -3 -2 -1 0 1 2 3 4 5 6 7 Pod01_St Pod01_15Port Pod01_30Port Pod01_15Stbd Pod01_30Stbd Pod02_St Pod02_15Port Pod02_30Port Pod02_15Stbd Pod02_30Stbd
Axial Moment Coefficient,KMX
Pod 01 & Pod 02 in Puller Config.
Figure 19. Axial moment coefficient curves of the two pod units at different azimuthing angles and in puller
configuration.
Figure 20 and Table 11 show that transverse moment decreased with advance coefficient for both positive and negative azimuth angles but the rate was higher for negative azimuthing angles. At positive azimuthing angles, Pod01 had higher unit transverse moment than Pod02. However, at negative azimuthing angles, there was no clear trend. Advance Coefficient,J T ra n sve rse M o m e n t C o e ff ic ie n t, KM Y 0 0.1 0.2 0.3 0.4 0.5 0.6 0.7 0.8 0.9 1 1.1 1.2 -3 -2 -1 0 1 2 3 4 Pod01_St Pod01_15Port Pod01_30Port Pod01_15Stbd Pod01_30Stbd Pod02_St Pod02_15Port Pod02_30Port Pod02_15Stbd Pod02_30Stbd
Transverse Moment Coefficient,KMY
Pod 01 & Pod 02 in Puller Config.
Figure 20. Transverse moment coefficient curves of the two pod units at different azimuthing angles and in puller
configuration.
Figure 21 and Table 11 show the change of steering moment coefficients with advance coefficient and azimuth angle in puller configuration for Pod01 and Pod02. The
steering moment (vertical moment about z-axis) increased in magnitude with increasing advance coefficients for a given azimuth angle. However, the sign of the steering moment was opposite to the sign of the azimuth angle. In the straight-ahead condition, the steering moment for Pod01 unit was higher than Pod02 unit for all advance coefficient values. At higher azimuthing angles, no clear effect of hub angle on steering moment was observed.
The transverse force coefficient, KFY, vertical force
coefficient, KFZ, axial moment coefficient, KMX, transverse
moment coefficient, KMY, and steering moment coefficient,
KMZ, of the two units plotted against propeller advance
coefficients, J in straight-ahead conditions and at azimuthing conditions of +15° (port), +30° (port), -15° (starboard), -30° (starboard) angles are presented in Figures 22 to 26. Tables 12 and 13 show the differences in the forces and moments of the two units at different operating conditions. Equation 2 was used to calculate the percentage differences. Advance Coefficient,J S tee ri n g M o m en t C o ef fi ci en t, KM Z 0 0.1 0.2 0.3 0.4 0.5 0.6 0.7 0.8 0.9 1 1.1 1.2 -0.4 -0.3 -0.2 -0.1 0 0.1 0.2 0.3 0.4 Pod01_St Pod01_15Port Pod01_30Port Pod01_15Stbd Pod01_30Stbd Pod02_St Pod02_15Port Pod02_30Port Pod02_15Stbd Pod02_30Stbd
Steering Moment Coefficient,KMZ
Pod 01 & Pod 02 in Puller Config.
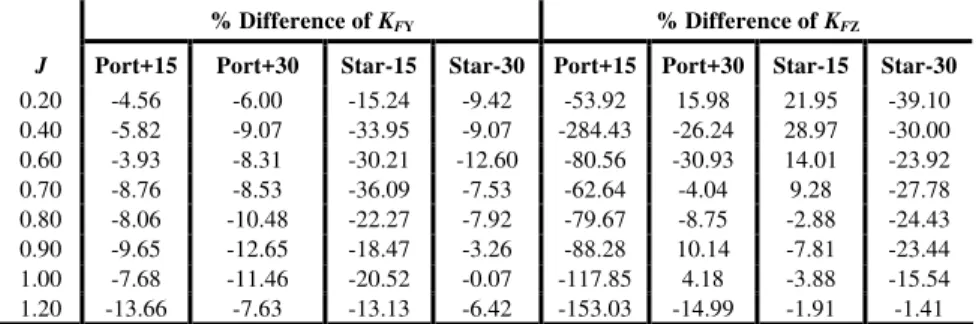
For both units, the propulsor showed an increase of transverse force with both positive and negative azimuth angles but in opposite directions with the increase of advance coefficient, J (see Figure 22 and Table 12). At straight-ahead condition, both units had near zero transverse force for all advance coefficients. In all azimuthing conditions and advance coefficient values, Pod02 with the larger hub angle produced higher transverse force than the Pod01 unit.
Figure 23 and Table 12 show the change of vertical force coefficients with advance coefficient and azimuth angles in pusher configurations for the two units. The nature of the vertical force with the change of advance coefficient for pusher configuration was different than the puller configurations, especially in negative azimuthing conditions.
Figure 21. Steering moment coefficient curves of the two pod units at different azimuthing angles and in puller
configuration. 4.3.2. PUSHER CONFIGURATION
Table 10. Comparison of unit side and vertical force coefficients in azimuthing conditions in puller configuration. Percentage differences were calculated based on the characteristics of Pod01.
% Difference of FFY % Difference of FFZ
J Port+15 Port+30 Star-15 Star-30 Port+15 Port+30 Star-15 Star-30
0.20 -5.99 -40.03 -55.03 -48.22 -23.83 -5.80 -56.20 -33.08 0.40 2.11 -26.37 -63.84 -52.70 -24.84 -25.50 -68.18 -9.10 0.60 3.41 -18.34 -63.81 -34.95 -12.15 -20.56 -99.93 -16.51 0.70 2.38 -10.86 -72.58 -27.23 -20.53 -16.78 -37.70 -10.74 0.80 -2.34 -6.93 -72.87 -22.97 -16.33 -16.54 -7.79 6.04 0.90 -6.76 -7.86 -77.30 -16.32 -14.01 -22.53 67.78 20.74 1.00 -6.02 -8.18 -68.25 -15.36 -13.17 -23.86 256.71 38.91 1.20 -17.54 -15.08 -47.99 -16.31 -9.33 -16.71 -97.16 -10.23
Table 11. Comparison of unit axial, transverse and steering moment coefficients in azimuthing conditions in puller configuration. Percentage differences were calculated based on the characteristics of Pod01.
% Difference of KMX % Difference of KMY % Difference of KMZ
J Port+15 Port+30 Star-15 Star-30 Port+15 Port+30 Star-15 Star-30 Port+15 Port+30 Star-15 Star-30
0.20 5.10 9.31 -44.89 -19.68 2.47 4.44 4.42 7.62 -5.04 20.52 -275.39 -33.96 0.40 20.68 11.49 -55.64 -21.04 5.63 10.28 3.07 7.19 -4.29 13.33 12.68 -0.17 0.60 24.74 16.30 -56.57 -11.20 10.30 16.04 -0.45 40.29 -7.26 3.75 12.82 6.34 0.70 23.01 16.34 -53.00 -4.25 13.09 18.69 -2.49 257.52 -18.29 1.39 14.82 1.27 0.80 18.98 14.64 -42.01 -2.52 18.36 11.43 -8.51 -46.93 -26.40 1.05 8.49 7.01 0.90 12.06 14.81 -28.97 -4.27 25.37 67.44 -59.57 -26.89 -21.63 4.30 4.38 5.92 1.00 8.52 14.94 -14.36 -1.44 37.94 37.38 24.83 -19.19 -15.24 0.72 7.00 8.93 1.20 3.67 15.30 9.37 7.02 -15.68 21.25 12.58 -11.76 -3.51 1.38 13.30 18.94
Advance Coefficient,J T ra n sve rse F o rc e C o e ff ic ie n t, KF Y 0 0.1 0.2 0.3 0.4 0.5 0.6 0.7 0.8 0.9 1 1.1 1.2 -0.7 -0.6 -0.5 -0.4 -0.3 -0.2 -0.1 0 0.1 0.2 0.3 0.4 0.5 0.6 0.7 0.8 0.9 1 Pod01_St Pod01_15Port Pod01_30Port Pod01_15Stbd Pod01_30Stbd Pod02_St Pod02_15Port Pod02_30Port Pod02_15Stbd Pod02_30Stbd
Transverse Force Coefficient,KFY
Pod 01 & Pod 02 in Pusher Config.
Figure 22. Transverse force coefficient curves of the two pod units at different azimuthing angles and in pusher
configuration. Advance Coefficient,J V e rt ic a l F o rc e C o e ff ic ie n t, KF Z 0 0.1 0.2 0.3 0.4 0.5 0.6 0.7 0.8 0.9 1 1.1 1.2 -0.6 -0.5 -0.4 -0.3 -0.2 -0.1 0 0.1 0.2 0.3 0.4 Pod01_St Pod01_15Port Pod01_30Port Pod01_15Stbd Pod01_30Stbd Pod02_St Pod02_15Port Pod02_30Port Pod02_15Stbd Pod02_30Stbd
Vertical Force Coefficient,KFZ
Pod 01 & Pod 02 in Pusher Config.
Figure 23. Vertical force coefficient curves of the two pod units at different azimuthing angles and in pusher
configuration. Advance Coefficient,J A x ia l M om en t C o e ffi cien t, KM X 0 0.1 0.2 0.3 0.4 0.5 0.6 0.7 0.8 0.9 1 1.1 1.2 -5 -4 -3 -2 -1 0 1 2 3 4 5 6 Pod01_St Pod01_15Port Pod01_30Port Pod01_15Stbd Pod01_30Stbd Pod02_St Pod02_15Port Pod02_30Port Pod02_15Stbd Pod02_30Stbd
Axial Moment Coefficient,KMX
Pod 01 & Pod 02 in Pusher Config.
Figure 24. Axial moment coefficient curves of the two pod units at different azimuthing angles and in pusher
configuration.
Figure 24 and Table 13 show that for both units, the propulsor showed an increase of axial moment with both positive and negative azimuth angles but in opposite directions with the increase of advance coefficient, J. At straight-ahead condition, advance coefficient did not have an effect on the axial moment for either unit. Similar to puller configuration, at positive azimuthing condition, Pod01 produced higher axial moment than Pod02 and at negative azimuthing conditions, Pod02 unit produced higher axial moment than Pod01.
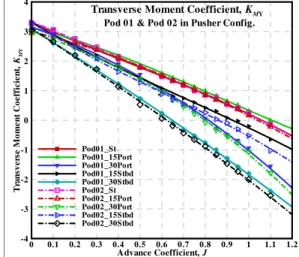
Transverse moment coefficient decreases with increase in advance coefficient for a given azimuth angle for both Pod01 and Pod02 as shown in Figure 25 and Table 13. However, the rate of decrease is higher for negative azimuthing angles. At positive azimuthing angles, Pod01 had higher transverse moment than Pod02 unit, whereas for negative azimuthing angles there was no clear trend.
Advance Coefficient,J T ra n sve rse M o m e n t C o e ff ic ie n t, KM Y 0 0.1 0.2 0.3 0.4 0.5 0.6 0.7 0.8 0.9 1 1.1 1.2 -4 -3 -2 -1 0 1 2 3 4 Pod01_St Pod01_15Port Pod01_30Port Pod01_15Stbd Pod01_30Stbd Pod02_St Pod02_15Port Pod02_30Port Pod02_15Stbd Pod02_30Stbd
Transverse Moment Coefficient,KMY
Pod 01 & Pod 02 in Pusher Config.
Figure 25. Transverse moment coefficient curves of the two pod units at different azimuthing angles and in pusher
configuration.
Figure 26 and Table 13 show the variation of steering moment coefficients with advance coefficient and azimuth angles in pusher configurations for the two units. According to the figure and the table, the steering moment (vertical moment about z-axis) increased with advance coefficients in magnitude for both positive and negative azimuthing angles. Regardless of the sign of the azimuthing angle, Pod02 unit (larger hub angle) had higher steering moments.
Overall, for both of Pod01 and Pod02, the magnitudes of transverse force, axial, transverse and steering moment coefficients were higher in the pusher configuration than those coefficients in the puller configuration for the azimuthing angles and the advance coefficients considered.
Advance Coefficient,J S tee ri n g M o m en t C o ef fi ci en t, KM Z 0 0.1 0.2 0.3 0.4 0.5 0.6 0.7 0.8 0.9 1 1.1 1.2 -0.4 -0.3 -0.2 -0.1 0 0.1 0.2 0.3 0.4 Pod01_St Pod01_15Port Pod01_30Port Pod01_15Stbd Pod01_30Stbd Pod02_St Pod02_15Port Pod02_30Port Pod02_15Stbd Pod02_30Stbd
Steering Moment Coefficient,KMZ
Pod 01 & Pod 02 in Pusher Config. The overall uncertainty in the non-dimensional
performance coefficients of the podded propulsors requires a proper identification of all the variables contained within the data reduction expressions (equations 3-8). The experimental approaches used to obtain the data for each of the variables in the expressions were influenced by a variety of elemental sources of error. These elemental sources were estimated and combined using the root-sum-square (RSS) method to obtain the bias and precision limits for each of the variables. The bias errors consist of many elemental sources of error, which depend on the approaches followed to measure the variables. However, for the precision error estimates of most variables, only one source of error (repeatability) was considered significant. In order to calculate the uncertainty due to calibration of the six-component dynamometer measurement, it requires determining how the uncertainty in the calibration data propagate into each element of the interaction matrix and into the measured forces and moments [20].
Figure 26. Steering moment coefficient curves of the two pod units at different azimuthing angles and in pusher
configuration. 5. UNCERTAINTY ANALYSIS
The error estimates used in the determination of the bias and precision errors in this study were considered to be 95% coverage estimates. The bias uncertainty and the precision uncertainty were combined using the root-sum-square (RSS) method to provide estimates of overall uncertainty levels in these variables.
A brief discussion of the levels of uncertainty in the above results is given below. To assess the uncertainty in each set of experiments and to identify the major factors influencing these results, a thorough uncertainty analysis was conducted ([22] and [23]). The techniques used were based on adaptations of uncertainty analysis techniques outlined in ITTC recommended Procedure [24], Bose and Luznik [25], Coleman and Steele [26] and Hess et al. [20].
Table 12. Comparison of unit side and vertical force coefficients in azimuthing conditions in pusher configuration. Percentage differences were calculated based on the characteristics of Pod01.
% Difference of KFY % Difference of KFZ
J Port+15 Port+30 Star-15 Star-30 Port+15 Port+30 Star-15 Star-30
0.20 -4.56 -6.00 -15.24 -9.42 -53.92 15.98 21.95 -39.10 0.40 -5.82 -9.07 -33.95 -9.07 -284.43 -26.24 28.97 -30.00 0.60 -3.93 -8.31 -30.21 -12.60 -80.56 -30.93 14.01 -23.92 0.70 -8.76 -8.53 -36.09 -7.53 -62.64 -4.04 9.28 -27.78 0.80 -8.06 -10.48 -22.27 -7.92 -79.67 -8.75 -2.88 -24.43 0.90 -9.65 -12.65 -18.47 -3.26 -88.28 10.14 -7.81 -23.44 1.00 -7.68 -11.46 -20.52 -0.07 -117.85 4.18 -3.88 -15.54 1.20 -13.66 -7.63 -13.13 -6.42 -153.03 -14.99 -1.91 -1.41
Table 13. Comparison of unit axial, transverse and steering moment coefficients in azimuthing conditions in pusher configuration. Percentage differences were calculated based on the characteristics of Pod01.
% Difference of KMX % Difference of KMY % Difference of KMZ
J Port+15 Port+30 Star-15 Star-30 Port+15 Port+30 Star-15 Star-30 Port+15 Port+30 Star-15 Star-30
0.20 2.86 -2.57 -17.65 -0.83 4.32 5.29 2.34 0.33 6.17 -5.82 -12.38 -3.51 0.40 -6.01 -2.83 -29.53 -4.46 2.96 5.05 8.69 7.66 -5.73 -15.32 -9.89 -6.48 0.60 -6.60 -1.55 -33.00 -14.38 5.10 -0.50 17.49 74.22 -6.75 -16.03 -18.25 -14.46 0.70 -5.38 -5.14 -31.15 -20.27 7.75 15.62 25.83 -38.41 -4.82 -10.96 -17.10 -7.77 0.80 -9.08 -5.36 -24.08 -17.12 14.53 223.76 38.90 -15.33 -7.14 -8.46 -15.92 -7.04 0.90 -7.12 -10.69 -20.36 -24.15 13.26 -12.08 206.32 -13.89 -9.28 -6.52 -18.90 -4.18 1.00 -9.43 -11.18 -19.57 -18.36 45.63 -14.40 -157.99 -10.95 -12.98 -6.70 -19.09 -5.23 1.20 -20.90 -12.72 -10.11 -22.74 -127.63 -8.70 -40.10 -10.62 -15.45 -9.14 -18.20 -6.38
The final step in the methodology of uncertainty analysis was to determine how uncertainties in each of the variables propagate through the data reduction equations. Using the approaches described in [25] and [26], the uncertainty expressions for each set of experiments were developed as shown in equation 3 to 8, where U denotes the uncertainties in the corresponding coefficients denoted by the subscripts. Note that in the derivation of the following expressions, the cross-correlated bias limits were ignored [25]. Strictly they should have been included, but they would have in the current case reduced the total uncertainty.
In the expressions for the podded propulsors’ tests, it should be noted that for both thrust and torque coefficient uncertainties, the tare thrust and frictional torque were imbedded in the corresponding measurements. Since the tare thrust and frictional torque were part of the same data stream as the thrust and torque readings, they were not treated as independent contributors of error to the corresponding coefficients, but rather as a bias error on the static-zero value of the thrust and the torque measurements. The resulting error estimates for the podded propulsor tests are given in Table 14 below:
2 2 2 2 Pr Prop 2 Prop 16 4 Prop ⎟ ⎠ ⎞ ⎜ ⎝ ⎛ + ⎟ ⎠ ⎞ ⎜ ⎝ ⎛ + ⎟⎟ ⎠ ⎞ ⎜⎜ ⎝ ⎛ + ⎟ ⎟ ⎠ ⎞ ⎜ ⎜ ⎝ ⎛ = ⎟ ⎟ ⎠ ⎞ ⎜ ⎜ ⎝ ⎛ D U n U U T U K U D n op T T KT ρ ρ ….. (3) 2 2 2 2 2 25 4 ⎟ ⎠ ⎞ ⎜ ⎝ ⎛ + ⎟ ⎠ ⎞ ⎜ ⎝ ⎛ + ⎟⎟ ⎠ ⎞ ⎜⎜ ⎝ ⎛ + ⎟⎟ ⎠ ⎞ ⎜⎜ ⎝ ⎛ = ⎟ ⎟ ⎠ ⎞ ⎜ ⎜ ⎝ ⎛ D U n U U Q U K U D n Q Q KQ ρ ρ ………. (4) 2 2 2 2 Unit Unit 2 Unit 16 4 ⎟ ⎠ ⎞ ⎜ ⎝ ⎛ + ⎟ ⎠ ⎞ ⎜ ⎝ ⎛ + ⎟⎟ ⎠ ⎞ ⎜⎜ ⎝ ⎛ ρ + ⎟⎟ ⎠ ⎞ ⎜⎜ ⎝ ⎛ = ⎟⎟ ⎠ ⎞ ⎜⎜ ⎝ ⎛ ρ D U n U U T U K U D n T T KTUnit .(5) 2 2 2 2 2 16 4 ⎟ ⎠ ⎞ ⎜ ⎝ ⎛ + ⎟ ⎠ ⎞ ⎜ ⎝ ⎛ + ⎟⎟ ⎠ ⎞ ⎜⎜ ⎝ ⎛ ρ + ⎟⎟ ⎠ ⎞ ⎜⎜ ⎝ ⎛ = ⎟⎟ ⎠ ⎞ ⎜⎜ ⎝ ⎛ ρ D U n U U F U K U n D Y FY FY FY ……(6) 2 2 2 2 2 25 4 ⎟ ⎠ ⎞ ⎜ ⎝ ⎛ + ⎟ ⎠ ⎞ ⎜ ⎝ ⎛ + ⎟⎟ ⎠ ⎞ ⎜⎜ ⎝ ⎛ ρ + ⎟⎟ ⎠ ⎞ ⎜⎜ ⎝ ⎛ = ⎟⎟ ⎠ ⎞ ⎜⎜ ⎝ ⎛ ρ D U n U U M U K U n D Z MZ MZ KMZ … .(7) 2 2 2 2 ⎟ ⎠ ⎞ ⎜ ⎝ ⎛ + ⎟ ⎠ ⎞ ⎜ ⎝ ⎛ + ⎟⎟ ⎠ ⎞ ⎜⎜ ⎝ ⎛ = ⎟ ⎠ ⎞ ⎜ ⎝ ⎛ D U n U V U J U n D A V J A ……….. (8)
Applying the uncertainty limits to the performance curves of the average Pod01 in the puller configuration and at 30° port azimuthing angle, in the form of error bars results in a plot as shown in Figure 27. From the figure, it is observed that the curves fitted to the data lie inside the error bars. Therefore, the fitted curves provide a good representation of the trends indicated by the results.
* * * * * * * * * * * * Advance Coefficient,J KT Pr o p , KT Un it ,1 0 KQ , KF Y , KM Z 0 0.1 0.2 0.3 0.4 0.5 0.6 0.7 0.8 0.9 1 1.1 1.2 -0.6 -0.5 -0.4 -0.3 -0.2 -0.1 0 0.1 0.2 0.3 0.4 0.5 0.6 0.7 KTPod KTUnit 10KQ KFY KMZ * Open Water Propulsive Performance Curves with Error Bars
Pod 01: 30Port Azimuthing Angle in Puller Configuration
Figure 27. Propulsive performance of pod 1 in puller configuration with error bars.
Table 14. Overall uncertainties in advance coefficients, propeller thrust and torque coefficients and unit thrust coefficients.
J J (+/-) J Error % (+/-) KTProp (+/-) KTProp Error % (+/-) KQ (+/-) KQ Error % (+/-) KTUnit (+/-) KTUnit Error % (+/-) KFY (+/-) KFY Error % (+/-) KZX (+/-) KZX Error % (+/-)
0.00 - - 6.0E-03 1.19 8.8E-04 1.29 4.7E-03 1.12 -3.7E-03 1.97 -3.1E-03 4.56 0.10 5.2E-03 5.20 5.8E-03 1.24 8.1E-04 1.24 4.4E-03 1.15 -3.7E-03 1.61 -3.4E-03 2.77 0.20 5.3E-03 2.63 5.6E-03 1.26 8.1E-04 1.31 4.4E-03 1.27 -4.1E-03 1.59 -3.8E-03 2.08 0.30 5.4E-03 1.79 5.3E-03 1.31 7.3E-04 1.24 3.9E-03 1.29 -4.1E-03 1.34 -4.1E-03 1.55 0.40 5.5E-03 1.38 5.1E-03 1.37 8.2E-04 1.48 3.7E-03 1.51 -4.5E-03 1.34 -4.9E-03 1.46 0.50 5.7E-03 1.14 4.9E-03 1.41 6.8E-04 1.31 3.2E-03 1.77 -4.7E-03 1.29 -5.2E-03 1.23 0.60 5.9E-03 0.99 4.6E-03 1.51 7.5E-04 1.56 3.0E-03 2.51 -5.0E-03 1.26 -5.9E-03 1.22 0.70 6.2E-03 0.88 4.4E-03 1.61 6.9E-04 1.57 3.1E-03 5.07 -5.1E-03 1.18 -6.2E-03 1.12 0.80 6.5E-03 0.81 4.3E-03 1.75 5.7E-04 1.42 -2.6E-03 7.81 -5.7E-03 1.21 -7.1E-03 1.09 0.90 6.8E-03 0.75 4.1E-03 1.89 6.4E-04 1.70 -3.1E-03 3.34 -5.7E-03 1.14 -8.2E-03 1.07 1.00 7.1E-03 0.71 4.0E-03 2.14 6.8E-04 2.11 -3.3E-03 2.94 -6.1E-03 1.16 -9.4E-03 1.07 1.10 7.4E-03 0.68 3.9E-03 2.47 5.7E-04 1.98 -3.5E-03 2.80 -6.0E-03 1.14 -9.9E-03 1.04 1.20 7.8E-03 0.65 3.7E-03 3.05 4.8E-04 2.05 -4.2E-03 1.33 -6.1E-03 1.15 -1.1E-02 1.03
5. CONCLUDING REMARKS
A comparative study on the propulsive performance of towed model pod units with the same pod-strut geometry
and propeller geometry, but different hub shape was performed. The tests were conducted at different static azimuthing conditions both in puller and pusher configurations. The data used for the study was obtained