Bioenergetic deficits in Huntington’s disease
iPSC-derived neural cells and rescue with glycolytic metabolites
The MIT Faculty has made this article openly available.
Please share
how this access benefits you. Your story matters.
Citation
Kedaigle, Amanda J. et al. “Bioenergetic deficits in Huntington’s
disease iPSC-derived neural cells and rescue with glycolytic
metabolites.” Human Molecular Genetics 00 (2019): 1-15 © 2019
The Author(s)
As Published
10.1093/hmg/ddy430
Publisher
Oxford University Press (OUP)
Version
Final published version
Citable link
https://hdl.handle.net/1721.1/124768
Terms of Use
Creative Commons Attribution NonCommercial License 4.0
†Amanda J. Kedaigle, http://orcid.org/0000-0001-6156-5046
Received: June 26, 2018. Revised: December 9, 2018. Accepted: December 11, 2018 © The Author(s) 2019. Published by Oxford University Press.
This is an Open Access article distributed under the terms of the Creative Commons Attribution Non-Commercial License (http://creativecommons.org/ licenses/by-nc/4.0/), which permits non-commercial re-use, distribution, and reproduction in any medium, provided the original work is properly cited. For commercial re-use, please contact journals.permissions@oup.com
1
Human Molecular Genetics, 2019, Vol. 00, No. 00 1–15
doi: 10.1093/hmg/ddy430
Advance Access Publication Date: 07 March 2019 General Article
G E N E R A L A R T I C L E
Bioenergetic deficits in Huntington’s disease
iPSC-derived neural cells and rescue with glycolytic
metabolites
The HD iPSC Consortium
consisting of
Group 1: Amanda J. Kedaigle
1,†
, Ernest Fraenkel
1
,
Group 2: Ranjit S. Atwal
2
, Min Wu
2
, James F. Gusella
2
, Marcy E. MacDonald
2
,
Group 3: Julia A. Kaye
3
, Steven Finkbeiner
3
,
Group 4: Virginia B. Mattis
4
, Colton M. Tom
4
, Clive Svendsen
4
,
Group 5: Alvin R. King
5
, Yumay Chen
5
, Jennifer T. Stocksdale
5
, Ryan G Lim
5
,
Malcolm Casale
5
, Ping H. Wang
5
, Leslie M. Thompson
5
,
Group 6: Sergey S. Akimov
6
, Tamara Ratovitski
6
, Nicolas Arbez
6
and
Christopher A. Ross
6,
*
1
Computational and Systems Biology Graduate Program and Department of Biological Engineering,
Massachusetts Institute of Technology, Cambridge, MA 02142, USA,
2Center for Genomic Medicine,
Massachusetts General Hospital, Simches Research Building, 185 Cambridge Street, Boston, MA 02114, USA,
3
Gladstone Institutes and the Taube/Koret Center of Neurodegenerative Disease Research, Roddenberry Stem
Cell Research Program, Departments of Neurology and Physiology, University of California, San Francisco, CA
94143, USA,
4The Board of Governors Regenerative Medicine Institute and Department of Biomedical Sciences,
Cedars-Sinai Medical Center, Los Angeles, CA 90048, USA,
5Department of Psychiatry and Human Behavior,
Department of Neurobiology and Behavior, Department of Medicine, Sue and Bill Gross Stem Cell Center and
UCI MIND, University of California, Irvine, CA 92697, USA and
6Division of Neurobiology, Departments of
Psychiatry, Neurology, Pharmacology, and Neuroscience, Johns Hopkins University School of Medicine, 600
North Wolfe Street, CMSC 8-121, Baltimore, MA 21287, USA
*To whom correspondence should be addressed at: Division of Neurobiology, Departments of Psychiatry, Neurology, Pharmacology, and Neuroscience, Johns Hopkins University School of Medicine, 600 North Wolfe Street, CMSC 8-121, Baltimore, MA 21287, USA. Tel: 410-614-0011; Fax: 410-614-0013; Email: caross@jhu.edu
2 Human Molecular Genetics, 2019, Vol. 00, No. 00
Abstract
Altered cellular metabolism is believed to be an important contributor to pathogenesis of the neurodegenerative disorder Huntington’s disease (HD). Research has primarily focused on mitochondrial toxicity, which can cause death of the vulnerable striatal neurons, but other aspects of metabolism have also been implicated. Most previous studies have been carried out using postmortem human brain or non-human cells. Here, we studied bioenergetics in an induced pluripotent stem cell-based model of the disease. We found decreased adenosine triphosphate (ATP) levels in HD cells compared to controls across differentiation stages and protocols. Proteomics data and multiomics network analysis revealed normal or increased levels of mitochondrial messages and proteins, but lowered expression of glycolytic enzymes. Metabolic experiments showed decreased spare glycolytic capacity in HD neurons, while maximal and spare respiratory capacities driven by oxidative phosphorylation were largely unchanged. ATP levels in HD neurons could be rescued with addition of pyruvate or late glycolytic metabolites, but not earlier glycolytic metabolites, suggesting a role for glycolytic deficits as part of the metabolic disturbance in HD neurons. Pyruvate or other related metabolic supplements could have therapeutic benefit in HD.
Introduction
Huntington’s disease (HD) is a progressive neurodegenerative disorder caused by an expanded CAG repeat within the
Hunt-ingtin gene (HTT), coding for an expanded polyglutamine repeat
within the huntingtin protein (HTT) (1–4). There is selective atrophy of the striatum, consisting of the caudate and putamen, as well as dysfunction and atrophy of the cerebral cortex. As the disease progresses, other brain regions are also affected. Within the striatum, the medium spiny neurons (MSNs) are selectively lost, with preservation of other cell types (5,6). HTT CAG repeat lengths of 40 or more invariably cause HD, and within this expanded range, longer repeats cause earlier onset and more rapid progression. Disease symptoms include progressive cognitive impairment and movement abnormalities as well as variable but frequent emotional and personality changes.
A central goal of HD research is to understand the underlying pathogenic mechanisms, which has been complicated due to the wide range of cellular processes impacted. Cellular mechanisms impacted include transcription, cellular transport, neuronal growth factor production or transmission, proteostasis and others, as a consequence of abnormal conformations and accumulation of mutant HTT protein (and possibly RNA) within cells (1,2,7,8). Historically, even prior to the identification of the disease gene, alterations of normal cellular metabolism have been implicated (9–11). However, the exact nature of the metabolic abnormalities in the presence of the mutant HTT remains unclear.
Mitochondrial toxicity has long been associated with HD pathogenesis (12–14). Mitochondria are the major source of energy in the cell through oxidative phosphorylation and play an important role in calcium and free radical metabolism (15,16). Mitochondrial poisons such as quinolinic acid or 3-nitropropionic acid produce selective degeneration of MSNs, mimicking the neuropathology of HD (17–20). However, these compounds have other non-mitochondrial targets as well (21,22), and do not perfectly mimic the metabolic changes caused by the mutation (33). Loss of mitochondrial complexes has been found in HD postmortem striatum (23,24). Mutant HTT has been reported to be present in mitochondria (25–27) and to interfere with mitochondrial fission and fusion (28). Further, HTT is necessary for mitochondrial structure and function during embryogenesis (29). The transcription factor (TF) PGC1alpha, which controls expression of many mitochondrial proteins and mitochondrial biogenesis, is also reduced in HD (30).
However, not all studies have supported mitochondrial mech-anisms for metabolic disorders in HD (31). A study in the YAC128 mouse model suggested that mitochondrial respiratory dysfunc-tion is not essential for HD pathogenesis (25). Additionally, in the R6/2 mouse model, mitochondria were not found to be impaired (32). Gene expression changes in striatal cells homozygous for CAG repeat expansion in HTT did not show expected changes in mitochondrial pathways (33). Furthermore, even if there are changes in mitochondria in HD, it is not clear if they are a cause or a consequence of HD pathogenesis (34). A seminal positron emission tomography study found alterations in metabolism of the striatum; however, the pattern of cerebral metabolic rate for oxygen compared to cerebral metabolic rate for glucose was more consistent with alterations in glycolysis than alterations in mitochondrial metabolism (35). In fact, other studies have also suggested that there is abnormal glycolysis in HD brain and cerebral spinal fluid (13,36) and in HD models (37–39).
Most of the experimental studies in the energetics of HD have been conducted in mouse models or in non-human or human immortalized cell lines, which may not directly reflect changes in human striatal neurons. We previously developed induced pluripotent stem cell (iPSC) models of HD (40–42) to examine disease mechanisms. Fibroblasts from HD patients and non-diseased controls were reprogrammed into iPSCs, and then dif-ferentiated into either neural cells or mature neurons with MSN characteristics. We have used these iPSC-derived neural cells to investigate metabolic abnormalities using a multidisciplinary approach.
Results
The HD iPSC Consortium has produced iPSC lines derived from fibroblasts of HD patients with HTT CAG lengths of 50 (50n3, 50n6 and 50n7), 60 (60n5 and 60n8), 66 (66n4) or 109 (109n1, 109n4 and 109n5) repeats, and from unaffected controls with 17 (17n1), 18 (18n5), 21 (21n1, 21n2 and 21n3) or 33 (33n1) repeats (40,41) (Supplementary Material, Table S1). In this work, we eval-uated metabolism in undifferentiated iPSCs, in neural progen-itors derived from these cells, and in fully differentiated cells derived from two distinct differentiation protocols. One pro-duces a mixed population of striatal neural cells and precursors (42,43) and the other a purer population of MSN-like neurons (44). To evaluate the baseline state of cellular metabolism in human iPSCs, we measured adenosine triphosphate (ATP) levels
Human Molecular Genetics, 2019, Vol. 00, No. 00 3
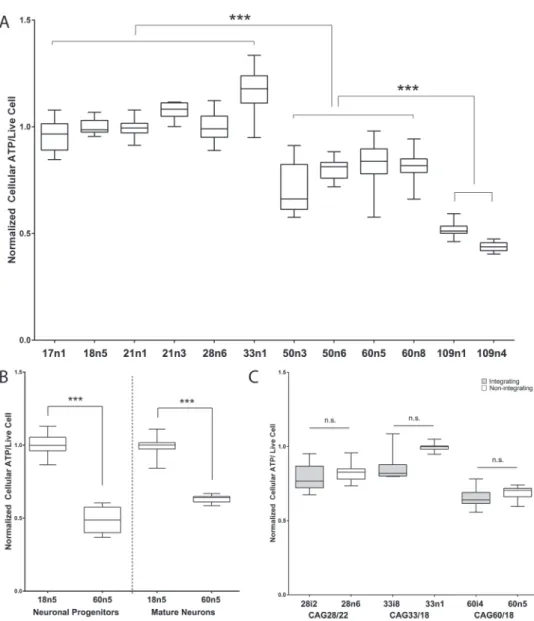
Figure 1. Human iPSCs from HD patients show decreased cellular ATP levels. Box and whisker plots from a 96-well plate-based dual live-cell fluorescence and
luminescence intensity-based quantitative cellular ATP analysis. (A) Cellular ATP analysis of undifferentiated human iPSCs spanning the HTT CAG repeat length spectrum. For each cell line, at least 16 biological replicates across multiple experiments were measured. (B) Box and whisker plots show cellular ATP analysis of unaffected (18n5) and HD affected (60n5) patient-derived human iPSCs differentiated to neuronal progenitors or mature medium spiny-like neurons. For each cell line, at least 12 biological replicates across multiple experiments were measured. (C) Cellular ATP analysis of human neuronal progenitor cells (NPCs) are unaffected by the method of iPSC generation. Human fibroblasts reprogrammed via the Yamanaka factors delivered either through the integrating lentiviral (grey) or the non-integrating episomal (white) method to generate the HD patient iPSCs are indicated. For each cell line, at least nine biological replicates across multiple experiments were measured. One-way ANOVA in (A), Student’s t-test in (B) and (C). ∗∗ indicates P < 0.01 while ∗∗∗ indicates P < 0.001.
in undifferentiated iPSCs using a live-cell fluorescence- and luminescence-based assay. Cellular ATP levels were significantly lower in HD cells than controls in a CAG repeat length-dependent manner (Fig. 1A). To determine if this remains true throughout differentiation to neurons, iPSCs were differentiated via small molecules to neuronal progenitors (45) and to mature MSN-like neurons (44). HD cells also showed decreased ATP at these two levels of differentiation (Fig. 1B). The method of reprogramming did not affect ATP levels, as neural progenitor cells derived from iPSCs reprogrammed via integrating lentiviral and non-integrating episomal methods showed similar ATP levels (Fig. 1C).
Dysregulation of cellular metabolism was also implicated in iPSC-derived neural cells by quantitative proteomics analysis via liquid chromatography–mass spectrometry (LC-MS). To match the population of cells previously submitted for RNA
sequencing and ChIP analyses (42), cultures were prepared in parallel using a differentiation protocol that yields a mixed population of striatal neural cells, as previously described (42). Of 2909 detected proteins with acceptable quality, 284 were found to be differentially quantified between HD and control iPSC lines (60n5, 109n1 and 109n5 versus 21n1, 33n1 and 28n6). The samples separate by repeat length along the first two principal components in a principal component analysis (Fig. 2A). Enrichment analysis of the detected differential proteins, ranked by modified P-value, showed enrichment for neurological gene ontology (GO) terms such as ‘neurotransmitter secretion’ (FDR q = 0.0008) and ‘vesicle-mediated transport in synapse’ (q = 0.001). Similar terms were enriched for genes whose mRNA expression was decreased in HD in the same cell lines differentiated with this protocol (42). However, there is also a group of enriched GO terms related to metabolic process
4 Human Molecular Genetics, 2019, Vol. 00, No. 00
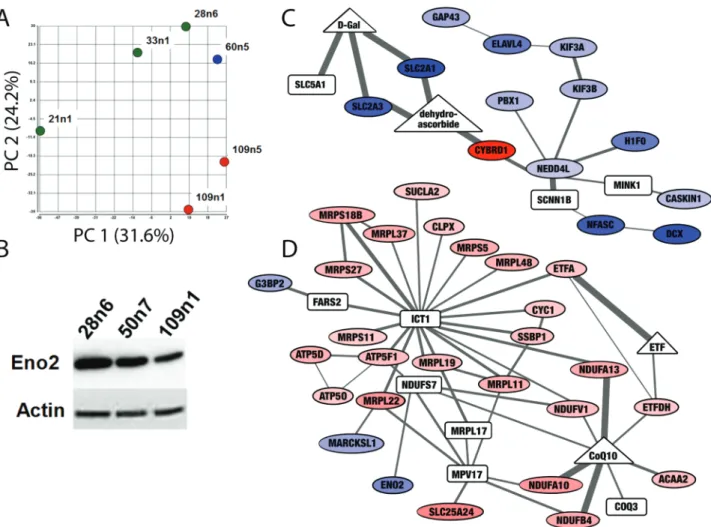
Figure 2. Proteomic screen of iPSC-derived striatal neural cells suggest differences in expression of metabolic proteins. (A) Principal component analysis of proteomic
measurements in striatal neural cells produced as in (42) separates samples based on CAG repeat length. Control cell lines (21n1, 33n1 and 28n6) are green, the HD cell line with 60 CAG repeats is blue and HD cell line with 109 repeats are shown in red. (B) Western blot confirms decreased levels of Enolase 2 (ENO2) in HD neurons. Equal loading was verified by stain on Actin. (C and D) The Omics Integrator tool found subnetworks enriched for bioenergetics functions altered in these cells. Nodes indicate differentially expressed proteins (ovals) as well as ‘hidden nodes’: metabolites (triangles) and proteins (rectangles) which did not result from analysis of the proteomic screen, but were implicated by the network algorithm. Colors indicate proteins that are significantly downregulated (blue) and upregulated (red). Increased line thickness indicates higher confidence in the interaction between two molecules. The network in (C) contains downregulated glucose transporters, and the network in (D) contains upregulated components of the electron transport chain and several proteins involved in mitochondrial translation. The full interactive network can be viewed athttp://fraenkel.mit.edu/omicsintegrator/iPSC_MSN/network.html.
and mitochondrial function which were not detected in the transcriptomic analysis, such as ‘mitochondrial translation’ (q = 0.0003), ‘small molecule metabolic process’ (q = 0.0008) and ‘generation of precursor metabolites and energy’ (q = 0.003).
One of the proteins significantly decreased in HD cell lines was enolase 2 (ENO2), or neuron-specific enolase, a phosphopy-ruvate hydratase found only in mature neurons and involved in glycolysis (Supplementary Material, Fig. S1). Staining for other markers of mature neurons had not shown a change in cell-type populations between HD and control cell lines with this differ-entiation protocol (42), implying this enzyme was specifically decreased in neurons. A decrease in ENO2 could have important consequences for neuronal glycolysis. This decrease in ENO2 was also observed in previously published RNA data (42) and confirmed via western blot in differentiated cells with 109 and 50 CAG repeats, a cell line which was not evaluated via proteomic screen (Fig. 2B).
The enrichment of altered bioenergetic pathways in the pro-teomics data was confirmed by unbiased integrative analysis of the high-throughput data collected in these cells. We used the
Omics Integrator software tool (46) to find subnetworks within a background protein–protein interaction network that are signif-icantly altered in the HD cells. As background, we used the pub-licly available human protein–protein interaction network from IRefIndex v13 (47) and added HTT-specific interactions (48). The 284 differential proteins were input to the tool, along with the TFs previously predicted to be influential in these cells, based on gene expression and epigenetic state, by the GarNet tool. The full network can be explored interactively athttp://fraenkel.mit.edu/ omicsintegrator/iPSC_MSN/network.html. Several of the subnet-works are enriched for bioenergetic functions, such as a sub-network enriched for ‘glucose transport’ (q = 0.02) that consists of mostly downregulated proteins (Fig. 2C) and a subnetwork enriched for ‘electron transport chain’ (q = 2.7e-8) and ‘mito-chondrial translation’ (q = 4.4e-13) that consists of mostly upreg-ulated proteins (Fig. 2D).
In addition to the unsupervised pathway analysis using the Omics Integrator tool, we also compared the data to the bioen-ergetic pathways in the WikiPathways database (49) (Fig. 3). Six proteins in the glycolysis pathway were downregulated: SLC2A1,
Human Molecular Genetics, 2019, Vol. 00, No. 00 5
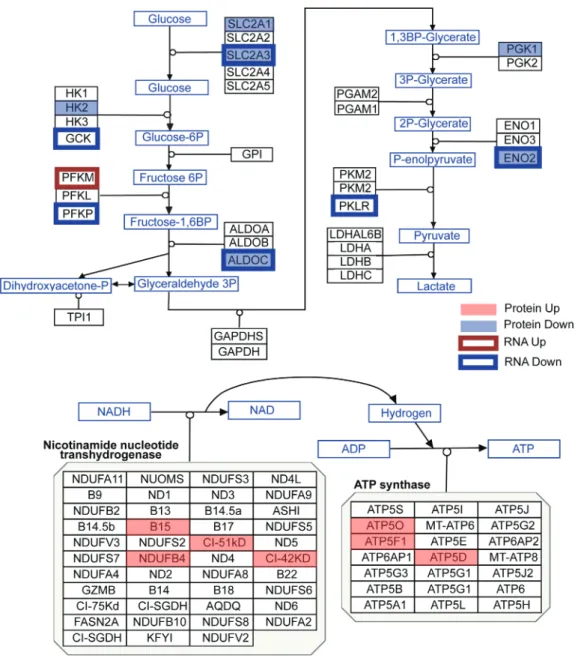
Figure 3. Protein and mRNA changes in the glycolysis and oxidative phosphorylation pathways. Pathway images are based on those by WikiPathways (49). A red box
was overlaid over proteins that were significantly upregulated, while a blue box was overlaid over proteins that were significantly downregulated (moderated t-test P < 0.05). A red outline surrounds proteins whose mRNA was upregulated, while a blue outline surrounds proteins whose mRNA was downregulated (corrected P < 0.05). Changes to mRNA are derived from our previously published RNA-seq data in these cultures (42).
SLC2A3, HK2, ALDOC, PGK1 and ENO2. These protein expression changes correlate with transcriptomic analysis, as six mRNAs that code for proteins in the glycolysis pathway were downreg-ulated: SLC2A3, GCK, PFKP, ALDOC, ENO2 and PKLR, and just one
PFKM,was upregulated. Meanwhile, seven proteins in the
oxida-tive phosphorylation pathway are upregulated: B15, NDUFB4, CI-51kD, CI-42kD, ATP5O, ATF5F1 and STP5D, while none of these molecules were significantly changed at the RNA level. These analyses point to a switch in HD cells where glycolytic genes and proteins are expressed at lower levels than normal, while pro-teins involved in oxidative phosphorylation are more abundant. Because analysis of the proteomic data in the striatal neural cultures indicated a change in the metabolic pathway used in these cells, we directly evaluated cellular metabolism in a purer population of iPSC-derived MSN-like neurons via Agi-lent Seahorse assay. We measured oxygen consumption rates
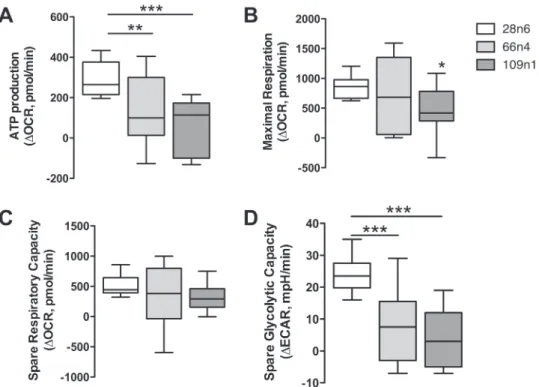
(OCRs) and extracellular acidification rates (ECAR) in mature neurons derived from two HD (109n1, 66n4) and one control (28n4) subjects. Comparisons of OCR measurements between both HD cell lines versus the control showed deficits in ATP pro-duction (Fig. 4A). Only the 109 repeat line showed a significant deficit in maximal respiration (Fig. 4B), and neither 109 nor 66 lines showed a significant decrease in spare respiratory capacity when compared to control (Fig. 4C). However, ECAR measure-ments following treatmeasure-ments with the ATP synthase inhibitor oligomycin revealed a decrease in spare glycolytic capacity in the HD lines (Fig. 4D). This decrease was similar to additional data gathered using the same assay in early neural populations (data not shown), suggesting that HD cells retain this deficit through-out development. These results suggest that the impaired energy metabolism in the HD neurons is caused at least in part by deficient glycolytic capacity.
6 Human Molecular Genetics, 2019, Vol. 00, No. 00
Figure 4. Bioenergetic deficits in HD iPSC-derived neurons. Seahorse XF24 Mito stress assay on 28n4, 66n4 and 109n1 iPSC-derived medium spiny-like neurons. (A) ATP production was calculated as the decrease in OCR from basal to posttreatment with ATP synthase inhibitor oligomycin. (B) Maximal respiration was calculated as
the decrease in OCR after treatment with the protonophoric uncoupler carbonyl cyanide-4-(trifluoromethoxy)phenylhydrazone (FCCP) to after treatment with electron transport inhibitor rotenone. (C) Spare respiratory capacity was calculated as the increase in OCR from basal to posttreatment with FCCP. (D) Spare glycolysis measured by ECAR following treatments with the ATP synthase inhibitor oligomycin. Results represented as mean± SD after normalization to the number of cells in each well, n = 15 across three experiments. One-way ANOVA, Dunnett’s post hoc, ∗ indicates P < 0.05, ∗∗ indicates P < 0.001 and ∗∗∗P < 0.0001.
The small to insignificant changes we detected in maximal respiration and spare respiratory capacity imply that mitochon-drial oxidative phosphorylation is only minimally affected by mutant HTT in these iPSC-derived neuronal cells. However, HD research has long shown an association between HD tissues and mitochondrial toxins (15–18). We therefore tested whether HD-derived cells are especially sensitive to oxidative damage via treatment with hydrogen peroxide and paraquat. The former is a reactive oxygen species that is an aerobic product generated naturally in cells, which can damage DNA, proteins and lipids. The latter is a redox-cycling quinolone that generates reactive oxygen species in the form of superoxide anion radicals. Both of these agents cause reactive oxygen species to be produced by the mitochondria (50,51). The iPSC-derived HD neural progenitors showed an increased sensitivity to oxidative stress caused by treatment with paraquat and hydrogen peroxide (Fig. 5).
Finally, we evaluated whether increasing the availability of glycolytic metabolites could rescue the bioenergetic phenotype in HD neurons. HD iPSC-derived striatal neural cells were plated on pyruvate-free medium and treated with various concen-trations of glucose for 48 h. HD cells required a much higher concentration of glucose to increase ATP levels towards untreated levels compared to control cells (Fig. 6A). At 250 μm glucose, a concentration at which HD cells showed ATP level deficits, ATP levels of HD neural cells could be significantly increased by addition of 2 mm pyruvate or 100 μm phospho-enolpyruvate (PEP, the product of the enolase step) (Fig. 6B), two important metabolites created during the later stages of glycolysis that result in production of ATP. ATP levels in neural cells generated from healthy control iPSCs were similar to untreated in all of these conditions (Fig. 6C). To further
char-acterize this rescue by glycolytic metabolites, one differentiated HD iPSC line was further studied in conditions of 250 μm glucose. Earlier glycolytic intermediates glyceraldehyde-3-phosphate and fructose-1,6-biphosphate did not significantly increase ATP levels, while later pathway intermediates pyruvate and PEP once again increased ATP production (Supplementary Material, Fig. S2). These metabolites also rescued cell viability in another model of HD. Primary cortical mouse neurons transfected with mutant HTT (82 CAG repeats) showed increased cell death as compared with those transfected with wild-type HTT (22 CAG repeats). When mutant HTT-transfected primary neurons were treated with 10 mm pyruvate or PEP they demonstrated a dose-dependent rescue of cell death, while treatment with glyceraldehyde-3 phosphate did not rescue transfected neurons (Supplementary Material, Fig. S3). Therefore, treatment with late-stage glycolytic metabolites could present a possible path to metabolic restoration in cells with the HD mutation.
Discussion
We have conducted a multidisciplinary study of metabolism in HD iPSCs, iPSC-derived neural populations and MSN-like neurons. We find decreased ATP in the HD iPSC-derived striatal neurons compared to controls. Omics analyses show relatively preserved or upregulated mitochondrial-related mRNA and protein expression, but decreased expression of glycolytic enzymes. The increase in oxidative phosphorylation enzymes could reflect increased production or reduced turnover, perhaps reflecting compensation by the cells to increase bioenergetics capacity. The Seahorse studies highlight defects in spare glycolysis. Importantly, ATP levels were restored with addition
Human Molecular Genetics, 2019, Vol. 00, No. 00 7
Figure 5. HTT CAG repeat length enhances sensitivity to oxidative stress. Live-cell fluorescence intensity-based survival analysis of human NPCs from either an
unaffected (17m8 CAG17/17) or HD affected (60i4 CAG60/18) individual. Bar plots showing compound dose (untreated or 1 mm or 5 mm) and HTT CAG repeat length (CAG17 versus CAG60)-dependent impact on cellular homeostasis. For each cell line, at least eight biological replicates/line across two independent experiments were measured. Student’s t-test, ∗∗ indicates P < 0.01 while ∗∗∗ indicates P < 0.001.
of pyruvate and partially restored with PEP. These findings highlight defects in glycolysis as a contributor to overall changes in metabolism, rather than a primary mitochondrial defect. We also see enhanced sensitivity to oxidative damage-related toxins, even at the early neural progenitor stage. This is consistent with the HTT mutation causing stress to the oxidation-reduction system in the cells. These data raise new possibilities for modulating the effect of the HD mutation with glycolytic intermediates or by otherwise targeting metabolic control.
The metabolic changes reported here emerged from an unsu-pervised analysis after adding proteomics measurements to our previously reported transcriptomic and epigenomic analyses in the same cultures, emphasizing the value of integrating multiple omics studies. The result of this multiomics analysis is now available to community online and can be further mined for novel hypotheses regarding molecular differences in this neuron model.
There is precedent for altered glycolytic capacity in HD. For instance, extra-mitochondrial energetic changes involved in gly-colysis were also implicated in a study of a mouse HD striatal cell line (33). In agreement with the proteomics data presented here, tricarboxylic acid cycle proteins were reported as upregulated in HD postmortem brain (24,52). Respiratory defects emerged in primary neurons derived from a transgenic rat model of HD when they were incubated in physiologic levels of glucose (37); however, they also observed a difference in spare respiratory capacity and maximal respiratory capacity in those cells, which were not observed in the present study. In two recent studies of the R6/2 mouse model, along with decreased spare mito-chondrial capacity in HD, the glycolytic enzyme ENO2 was also reported to be decreased in mouse brain (38,53), although Skotte
et al. attributed bioenergetic changes in the tissue to astrocytes
rather than neurons. ENO2 was also shown to be decreased in the basal ganglia of HD patients (54). Alterations in glycolysis were observed in a non-neuronal cell model and in transgenic fruit
fly, though it is not clear if their results are precisely congruent with ours (39).
Interestingly, a reduction in mitochondrial respiration and increase in glycolytic flux was reported in a cell model of amy-otrophic lateral sclerosis, another neurodegenerative disorder (55). Meanwhile, similar Seahorse experiments in iPSC-derived neurons from patients with familial Parkinson’s disease primar-ily showed mitochondrial deficits, though they did not report ECAR results (56).
Using the same parallel cultures used here for proteomic analysis, we previously reported alterations in neurodevel-opmental and neurogenesis-related pathways in HD iPSC-derived neural cells, particularly related to cell maturation (42). A recent publication also demonstrates impairment in neurodevelopment-related pathways in HD iPSC-derived neurons (57). Furthermore, in vivo studies suggest that targeting development-related pathways can modify disease-related phenotypes in HD models (58). The alterations to metabolic and neurodevelopment pathways in these cell lines could be interrelated. It is intriguing that during neurodevelopment, the bioenergetic balance shifts between glycolysis and oxidative phosphorylation, with a greater dependence on glycolysis during differentiation and shift to greater dependence on oxidative phosphorylation after cell specification (59). There is some evidence that increased use of glycolysis during development could support cell proliferation and synapse growth (59,60). It is conceivable that the deficits in spare glycolysis observed here, using cell models that can elucidate changes in early stages of neurodevelopment, could drive changes in homeostasis during development that causes increased vulnerability later to the presence of mutant HTT. Furthermore, it has been shown that overall aerobic glycolysis in the brain decreases during normal human aging (61), and that the use of glycolysis within the brain maybe related to deposition of amyloid-beta and tau in Alzheimer’s disease (62,63), raising interesting questions about HD brains’ reliance on glycolysis.
8 Human Molecular Genetics, 2019, Vol. 00, No. 00
Figure 6. Rescue of ATP levels in HD neurons via exogenous application of glycolytic metabolites. (A) HD (109n1) and control (21n2) differentiated striatal neural
cells were supplied with various concentrations of D-glucose (D-Glu) for 48 h, after which ATP concentration was measured. At 250 μm and 500 μm, HD cells showed significantly decreased ATP levels compared to untreated, while control cells did not. One-way ANOVA. ∗P≤ 0.01, ∗∗P ≤ 0.001 versus vehicle (Veh, water). (B and C) At 250 μm of D-glucose, cells were also provided with sodium pyruvate (Pyr) or PEP for 48 h. Both molecules significantly increased ATP concentrations in HD cells (109n1 and 50n7) (B), while levels remained constant in control cells (21n2 and 33n1) (C). CellTiter-Glo assay was used to measure ATP levels. QuantiFluor assay was used to measure amount of dsDNA per well for normalization. Untreated (UT) and Vehicle (Veh, water) means cells in a neural induction medium (NIM). One-way ANOVA. ∗P ≤ 0.05, ∗∗P ≤ 0.005 versus media with no metabolites, supplied with 250 μm D-glu.
Other changes have been reported in metabolic pathways in HD. Studies in the R6/2 HD mouse model and HD patients suggested alterations in phosphocreatine utilization (64,65). The sphingosine phosphate pathway has been implicated (66,67) and alterations in ascorbic acid transporters described (68). Alter-ations in striatal lipids have also been reported in Htt CAG repeat knock-in mice (69). Expression and function of the TF PGC1-alpha has repeatedly been shown to be impaired in HD, which
affects mitochondrial biogenesis and function (30,70,71). Under these conditions with impaired function in several metabolic pathways, one might expect glycolysis would be an important alternative pathway to produce ATP, but the data presented here suggest that the cells are unable to increase glycolysis accord-ingly. These diverse metabolic pathway alterations highlight the potential complexity of metabolic changes in cells with the HD mutation.
Human Molecular Genetics, 2019, Vol. 00, No. 00 9
A number of mechanisms may be relevant to the impaired bioenergetics described. One important possibility is response to proteotoxic stress or other cell stress. The unfolded protein response reduces glucose metabolism as an adaptive response, via inositol-requiring enzyme 1 signaling (72). Another interest-ing possibility is that glycolytic alterations may be specifically related to axonal transport defects (73). We also find axonal transport-related RNAs and proteins to be significantly altered in the HD iPSC-derived striatal cultures (40,42).
A key question is the extent to which changes are direct consequences of mutant HTT or are compensatory. Our results suggest the possibility that changes in glycolytic flux result from decreases in specific enzymes later in the pathway such as ENO2, particularly since rescue of ATP levels could only be achieved with the addition of later-stage glycolytic intermediates. It has also been suggested that flux through the glycolytic enzyme GAPDH may be relevant (74), although the results presented here suggest that the major impairment by mutant HTT occurs after that step in glycolysis. Recent studies have also suggested a possible role of the connection between mitochondria and the endoplasmic reticulum, perhaps via sigma-1 receptors (75,76), agonists of which have been shown to be protective in HD models (77,78). Pyruvate can rescue impaired ATP production caused by sigma-1 mutations (79).
Our study does have some limitations. The HD iPSC-derived neuronal models are cultured cells rather than MSNs existing in the in vivo HD caudate and putamen in the presence of other cell types. However, the two differentiation protocols used here have complementary advantages. The differentiation protocol leading to striatal neural cells, used here for proteomics and rescue experiments, does not yield a homogeneous population of mature ‘MSN-like’ neurons, but rather a mixed population of neurons and neural precursors. This longer differentiation protocol, as in our previous publication, yields neurons with a MSN-like phenotype, but the percent of DARPP32-positive neu-rons is about 10–15% (41,42), though this may be an under estimate due to the limited sensitivity of the DARPP32 anti-bodies currently available. On the other hand, the shorter dif-ferentiation protocol, used here for Seahorse and some of the ATP level studies, leads to a more homogeneous population of neurons (∼90% MAP2+) positive for GABA markers (44) and MSN markers (20–30% DARPP32+ and 60–80% CTIP2+, data not shown). Our systems do not model neuronal–glial interactions or cortico-striatal connection. In addition, in vitro studies of cellular metabolism are necessarily limited since metabolic sub-strates are artificially provided through the cell media rather than through physiological interactions. Future studies using models designed to be closer to in vivo neuronal conditions, such as 3D brain cell culture models and models with well-characterized neuronal–glial connections, will greatly advance the field. We also look forward to the generation of human-derived HD cell lines with matching isogenic controls lacking the HTT mutation. The range of cell lines used here have CAG repeat lengths typical of both adult- and juvenile-onset HD, and future studies using cell lines from many more individuals may be able to identify repeat-length dependency. However, the cell lines used in this study have significant advantages over other cell line models of HD currently available, as our models are derived directly from HD patients and controls, and we have previously shown that they exhibit many CAG expansion-dependent phenotypes (40).
Studies of cellular metabolism may have therapeutic impli-cations. Metabolic abnormalities in HD are complex, and likely involve much more than isolated changes in glycolysis or any
other single pathway. Therefore, interventions at the level of TFs or other proteins that are ‘master regulators’ of metabolism may be especially promising. Possibilities include HDAC inhibitors (80), SIRT1 agonists (81,82) and agents which act on mTOR or TORC (83). In addition, strong neuroprotective effects of PPAR agents have been reported, especially PPAR agonists (84–87). A metabolomics screen would be a useful future complement to the current studies. Our finding that pyruvate can rescue HD-related neuronal cell death could also suggest potential therapeutic interventions. A number of studies have shown a neuroprotective effect of pyruvate in several models of neu-rodegeneration (79,88–91). To our knowledge, pyruvate has not been tested in HD mouse models, but this is a future study to consider.
Materials and Methods
Cell culture and differentiation of human neuronal progenitors
Here we refer to the cell lines based on the CAG repeat length and clone number of the iPSC line the cells were differentiated from (i.e. ‘60n5’ indicates cells are derived from an iPSC line with 60 CAG repeats, clone 5) (Supplementary Material, Table S1). Human iPSC (HD iPSC Consortium) were cultured on Matrigel-coated (BD Biosciences, San Jose, CA) 6-well plates in mTeSR 1 media (STEMCELL Technologies, Cambridge, MA) in a 37◦C
incubator at 5% CO2 with fresh media changes (2.5 mL/well)
every day. Derivation of HD17m8 neuronal progenitors has been described previously (45). To obtain human neuronal progenitor cell (NPC) populations, human iPSC lines were differentiated following standardized STEMdiffTM neural induction media
(NIM) method (STEMCELL Technologies) following manufac-turer’s instructions. In short, single-cell suspensions of human iPSCs were prepared by harvesting individual iPSC colonies using ACCUTASETM(STEMCELL Technologies) and resuspending
in STEMdiffTM NIM (supplemented with 10 μm Y-27632). Total
cell counts and viability were determined using the Countess Automated Cell Counter (ThermoFisher Scientific, Waltham, MA). For initiation of uniform sized embryoid body formations, 3 million cells/mL single-cell suspension for each human iPSC population was plated in independent wells of an AggreWell800 plate (STEMCELL Technologies), resulting in ∼10 000 single cells/micro-well. The resulting neural aggregates were incubated in NIM for 4 days with daily 1 mL/well media changes. Mature embryoid bodies were harvested on day 5 and plated on PLO/Laminin-coated 6-well plates and cultured for additional 7 days in NIM. The fidelity of the neural rosette formation from each embryoid body was checked over the course of the next 7 days. On day 12, high fidelity neural rosettes were harvested through individual neural rosette selection and enriched on to Matrigel-coated 6-well plate for further neuronal progenitor population expansion in NPC media. The neuronal progenitor populations were maintained in NPC media.
Differentiation of human iPSCs to mature neurons
Human iPSCs were grown on a Matrigel-coated glass-bottomed 96-well plate (PerkinElmer, Waltham, MA) and differentiated into mature neurons using either (a) small molecules based as described previously (44) or (b) BDNF and TFs as described previously (42,43). Cells produced by (a) are described in the text as medium spiny-like neurons, while cells produced by (b) are
10 Human Molecular Genetics, 2019, Vol. 00, No. 00
referred to as striatal neural cells, because the population of cells from this protocol included more mixed neural cell types.
Cellular ATP in HD allelic series of human iPSCs
Dual live-cell fluorescence and luminescence intensity-based quantitative cellular assay was used to assess the impact of HTT CAG repeat length expansion on cellular ATP. Briefly, human iPSCs were grown to 75% confluency in a 6-well plate as described above. Cells were loaded with CyQUANT Direct (ThermoFisher Scientific) dye following manufacturer’s instructions. In order to obtain total cell counts, human iPSCs were harvested using ACCUTASE and were counted using the Countess Automated Cell Counter. Using a standard curve from 1000–50 000 cells/well, CyQUANT loading efficiencies across multiple lines were established. To measure cellular ATP, 20 000 live cells/well were dispensed in an uncoated glass-bottomed 96-well black-walled plate (PerkinElmer). Total fluorescence per well was measured to obtain the total number of live cells per well. Immediately following the fluorescence measurements, cells were processed for cellular ATP measurement using the CellTiter-Glo assay as described (Promega, Madison, WI). Total live cell counts for a given well (based on CyQUANT fluores-cence intensity/well) were used to adjust the luminesfluores-cence measurements obtained from the same well in order to yield a quantitative total cellular ATP/live cell measurement.
Total cellular ATP across multiple stages of cellular differentiation
Dual live-cell fluorescence and luminescence intensity-based quantitative cellular assay was used to assess the HTT CAG mutation-specific and state-dependent, impact on cellular ener-getics as described above. Three different stages (iPSCs, neuronal progenitors and mature neurons) were used.
iTRAQ samples preparation
Quantitative proteomics (iTRAQ, isobaric tags for relative and absolute quantification) samples of 21n1, 28n6, 33n1, 60n5, 109n1 and 109n5 differentiated iPSCs were prepared in parallel accord-ing to the protocol described in (92). Briefly, the cell pellets were lysed in 0.5 ml of 4% SDS and 0.1 M DTT in 0.1 M Tris–HCl, pH 7.6 at room temperature and sonicated two to three times with 10W power input and 5 s intervals to reduce viscosity of the lysate. The lysates were diluted with water and protein amounts were determined with Pierce BCA assay (ThermoFisher Scientific) to normalize it between samples. For additional QC, aliquots of the prepared material were fractionated on SDS-PAGE and stained with Coomassie protein stain to ensure the lack of protein degradation during the procedure.
iTRAQ labeling and LC-MS(/MS) proteomics analysis
8-plex iTRAQ procedure and LC-MS analysis were performed at the Mass Spectrometry and Proteomics Facility, Johns Hopkins University School of Medicine as described in (40). In details, after proteolysis using trypsin, 100 μg of each proteins sample were dried to 37 μl and peptides were labeled with an isobaric tag by adding an iTRAQ reagent (dissolved in 50 μl of isopropanol) at room temperature for 2 h. After labeling, all samples were mixed and dried to a volume of 200 μL and fractionated by basic reverse phase (bRP) LC on an Agilent 1200 Capillary HPLC
system using XBridge C18, 5 μm 100 × 2.1 mm analytical column. Each bRP fraction was redissolved in 0.2% formic acid and separated on a C18 column with an 8 μm emitter tip using 5–40% B (90% acetonitrile, 0.1% formic acid) gradient over 60 min at 300 nl/min. Peptides were fractionated by reverse-phase HPLC on a 75 um× 15 cm PicoFrit column with a 15 um emitter (PF3360-75-15-N-5, New Objective, Woburn, MA) in-house packed with Magic C18AQ (5 um, 120 Å, New Objective) using 0–60% acetonitrile/0.1% formic acid gradient over 70 min at 300 nl/min. Eluting peptides were sprayed (at 2.0 kV) directly into Q-exactive Orbitrap mass spectrometer (ThermoFisher Scientific) interfaced with Easy-NanoLC 1000 nanoflow system. Survey scans (full MS) were acquired from 350–1800 m/z with up to 15 peptide masses (precursor ions) individually isolated with a 1.2 Da window and fragmented (MS/MS) using a collision energy of 31 and 30 s dynamic exclusion. Precursor and the fragment ions were analyzed at 70 000 and 17 500 resolutions, respectively. Peptide sequences were identified from isotopically resolved masses in MS and MS/MS spectra extracted with and without deconvolution using Thermo Scientific MS2 processor and Xtract software. Data was searched against Refseq human 2012 database, specifying sample’s species, trypsin as the enzyme allowing one missed cleavage with variable modifications of oxidation on methionine, deamidation on residues N and Q, 8-plex iTRAQ on tyrosine and fixed modifications of methylthiomethane on cysteine and 8-plex iTRAQ on lysine and N-term (fixed) using Mascot software (Version 2.2 www.matrixscience.com) interfaced in the Proteome Discoverer 1.4 ( http://portal.thermo-brims.com/) workflow.
Protein quantification and statistical analysis
The peptides with a confidence threshold 1% false discovery rate were considered for analysis (FDR was identified based on a concatenated decoy database search). Reporter ion spectra with isolation interference larger than or equal to 30% were excluded. Protein log2 relative abundances were estimated using the method of (93). In this algorithm, the log2 reporter ion intensities for each spectrum were ‘median-polished’, that is, the spectrum median log2 intensity was subtracted from the observed log2 intensities. The relative abundance estimate for a protein was calculated as the median of these median-polished data, using all reporter ion intensity spectra belonging to this protein. Adjustments for different sample preprocessing and amounts of material loaded in the channels were carried out by subtracting the channel median from the relative abundance estimates, normalizing all channels to have median zero. In the final step, proteins that were identified and quantified by reporter ion intensities from only one peptide were excluded. We compared protein abundances based on the median values for HD cell lines (109n1, 109n5 and 60n5) and control cell lines (21n1, 28n6 and 33n1). The P-values were calculated based on the moderated t-test from the limma package (94) as in (95), and the proteins with moderated P < 0.05 were declared statistically significantly changed between HD and control cells. The list of all detected proteins were sorted by moderated P-value and submitted to the GOrilla tool (96) to determine biological process GO terms that are enriched towards the top of the list.
Western blot analysis
Cells were lysed with RIPA buffer supplied with 1% Triton X-100 (both from MilliporeSigma, Burlington, MA) and 0.5% Protease
Human Molecular Genetics, 2019, Vol. 00, No. 00 11
Inhibitor Cocktail (Set III, Calbiochem, MilliporeSigma). Antibod-ies for detection of ENO2 were purchased from Cell Signaling Technology, Danvers, MA. Equal loading was verified by west-ern blotting on actin (mouse primary antibodies from Millipore Sigma).
RNA-seq analysis
RNA-seq and differentially expressed gene sets are taken from publicly available data, measured in similar cultures (42).
Network analysis
For an unbiased way to uncover interactions and pathways in the data, Omics Integrator software version 1.2 (46) was used. First, TFs hypothesized to affect differential gene expression were generated using the Garnet module, by searching for TF motifs in differential H3K27ac regions in the same cells, and then regress-ing the strength of those motifs with the change in expression of nearby genes. Then, proteins were assigned prizes based on the absolute value of the logFC of that protein in HD compared to control cell lines. These proteins and the TFs were then input to the Forest module of Omics Integrator. The default interac-tome included with Omics Integrator was augmented with HTT interactions from (48) and with metabolite–protein interactions from Recon (97). A negative prize was also assigned to pro-teins with very low mRNA expression in these cells, by adding −10/(average RPKM + 1) to each protein’s prize. Forest was run with several parameters—all combinations of w = [3,5], b = [5,10], mu = [0.03,0.05], D = [5] and garnetBeta=[0.01,0.03,0.05] gave networks with acceptable average degree of Steiner nodes (i.e. do not include ‘hubs’). All nodes were subjected to robustness and specificity tests using Omics Integrator functions randomTer-minals and noisyEdges, and were eliminated from results if they appeared in >10% of randomTerminal networks or <90% of noisyEdge networks. Rather than choosing one parameter set for further analysis, the resulting networks were combined by including all nodes that appeared in at least 5 of the 24 networks with different parameter combinations, and all edges from the interactome between those nodes. The final network was clustered using Louvain community clustering. The protein nodes in each cluster were submitted to the GOrilla tool (96) to calculate enrichment of biological process GO terms in those nodes over the background of all proteins in the interactome.
Bioenergetics assay
iPSCs were cultured according to (42). Cell lines were subse-quently differentiated to NPCs with the addition of Activin A (PeproTech, Rocky Hill, NJ), plated on XF24 plates (Agilent Tech-nologies) at a density of 100 k cells/well and matured for 3 weeks as described (44). OCRs and ECARs were measured on the Seahorse XF24 Analyzer (Agilent Technologies, Santa Clara, CA) using standard assay kits (Seahorse XF Mito Stress Test) or mod-ified buffer conditions with 1XKHB buffer: 111 mm NaCl, 4.7 mm KCl, 2 mm MgSO4, 1.2 mm Na2HPO4, 2.5 mm Glucose, 0.5 mm carnitine, pH 7.4 and standard assay reagents (oligomycin, FCCP and rotenone). Data within each XF24 well was normalized using post assay cell counts. Wells with negative OCR values were excluded from the analysis. ATP production calculated as the decrease in OCR from basal to posttreatment with oligomycin. Maximal respiration calculated as the decrease in OCR
post-treatment with FCCP to postpost-treatment with rotenone. Spare respiratory capacity was calculated as the increase in OCR from basal to posttreatment with FCCP. Spare glycolysis measured by ECAR following treatments with the ATP synthase inhibitor oligomycin.
Paraquat and H2O2sensitivity of human neuronal progenitors
Human neuronal progenitor populations were grown to∼90% confluency on a PLO/Laminin-coated 6-well plate. Cells were loaded with CyQUANT Direct following manufacturer’s instruc-tions. Two hours after incubation, cells were harvested using TrypLE express (ThermoFisher Scientific) and counted using Countess Automated Cell counter. For each cell line, 10 000 cells/well were dispensed into a 96-well plate and incubated overnight in either the NPC media alone or supplemented with varying concentrations (1 mm or 5 mm) of either paraquat or H2O2. Relative time-resolved difference in loss of fluorescence
(measure of sensitivity/survival) between initial (time 0) and final time point were used to assess the percent survival.
ATP rescue with glycolytic metabolites
HD and control iPSCs were differentiated towards striatal neural cells (43) for 48 days, dissociated with TrypLE solution (Ther-moFisher) and re-plated into Matrigel (BD Biosciences)-coated 96-well plates, 104cells/well. On day 6 after re-plating, the cells
were transferred to pyruvate-free Neurobasal A Medium (Ther-moFisher, A2477501) supplied with various concentrations of D-glucose and sodium pyruvate (both from ThermoFisher) or PEP (Sigma) for 48 h. Relative intracellular ATP values in cell extracts were measured using the CellTiter-Glo Luminescent Cell Viability Assay (Promega, G7571) according to manufacturer’s instructions. Luminescence was measured on GloMax®Discover
Multimode Microplate Reader (Promega) and the values were normalized to the amount of dsDNA per well determined by QuantiFluor®dsDNA System (Promega, E2670) according to the
manufacturer’s instructions in the same plates using the same instrument. Statistical analysis was performed using one-way analysis of variance (ANOVA) for at least three independent experiments.
Cell culture of mouse primary neurons and transfection
Primary cortical neurons were prepared from CD1 mice at embryonic day 15. Cortices were dissected out, treated with 0.05% trypsin/EDTA (ThermoFisher), mechanically dissociated and plated on poly-D-lysine-coated 24-well plates at 0.1× 10⁶ cells/cm2. Neurons were maintained in Neurobasal medium supplemented with B27 and 2 mm GlutaMAX (ThermoFisher) in 5% CO2 at 37◦C. At 7 days in vitro, primary neurons
were co-transfected with the plasmids carrying specified Htt construct and enhanced green fluorescent protein (eGFP) using Lipofectamine 2000 (ThermoFisher) according to our modified protocol (87). The constructs used for transfection were N586 fragments of Htt with either 22 or 82 CAGs. Forty-eight hours after transfection, cells were fixed with 4% paraformaldehyde in phosphate-buffered saline (PBS) for 30 min. After three washes with PBS, cells are stained with 0.8 μg/mL of DNA-binding dye bisbenzimide (Hoechst 33342, MilliporeSigma) to visualize cell nuclei.
12 Human Molecular Genetics, 2019, Vol. 00, No. 00
Nuclear condensation assay
Nuclear condensation assay was performed according to our protocol (40). Briefly, images of 49 independent fields per well were automatically taken on an inverted fluorescence microscope (Axiovert 200, Zeiss, Oberkochen, Germany) and analyzed using the Volocity software (PerkinElmer). Cell survival was determined by automated measurement of the average intensity of DAPI-stained nuclei of transfected cells visualized by eGFP expression. Cells were considered as viable when their nuclear intensity was lower than 200% of the control intensity. Statistical analysis was performed using one-way ANOVA for at least three independent experiments.
Supplementary Material
Supplementary Materialis available at HMG online.
Acknowledgements
We thank the HD patients and their families for their essential contributions to this research. We also thank Jamshid Arjomond for helpful discussions of the data, Laura Tung for code that was helpful when building the interactive network website, Nicole Solomos for assistance with the generation and growth of NPC cultures and the iPSC Core at Cedars-Sinai Medical Center for generation of the iPSCs.
Conflict of Interest statement. None declared.
Funding
National Institutes of Health (NIH) (NS078370 to L.M.T., C.N.S., J.F.G., M.E.M., C.A.R., S.F., NeuroLINCS center U54 NS091046 to L.M.T., C.N.S., E.F., S.F., NS089076 to L.M.T, D.E.H., E.F., CHOP 321039 to C.A.R., R01GM089903 to E.F., NS101996-01 to S.F., R37 NS101996 to S.F., T32GM008334 to A.J.K., National Research Service Award to R.G.L.); Huntington’s Disease Center Without Walls (P50NS16367 to J.F.G., M.E.M.), CHDI Foundation (to J.F.G., M.E.M., C.A.R.); National Institute of Neurological Disorders and Stroke Duke University subaward (to C.A.R.); American Heart Association; California Institute for Regenerative Medicine; Hereditary Disease Foundation (to V.B.M.); Taube-Koret Center and Hellman Family Foundation (to S.F.); UCI Institute for Clinical and Translational Science (to L.M.T.); Fatima Foundation (to P.H.W.); University of California Genomic High Through-put Facility Shared Resource of the Cancer Center Support Grant (CA-62203); National Science Foundation (DB1-0821391); NIH (P30-ES002109).
References
1. Ross, C.A., Aylward, E.H., Wild, E.J., Langbehn, D.R., Long, J.D., Warner, J.H., Scahill, R.I., Leavitt, B.R., Stout, J.C., Paulsen, J.S.
et al. (2014) Huntington disease: natural history biomarkers
and prospects for therapeutics. Nat. Rev. Neurol., 10, 204–216. 2. Ross, C.A. and Tabrizi, S.J. (2011) Huntington’s disease: from molecular pathogenesis to clinical treatment. Lancet Neurol.,
10, 83–98.
3. MacDonald, M.E., Ambrose, C.M., Duyao, M.P., Myers, R.H., Lin, C., Srinidhi, L., Barnes, G., Taylor, S.A., James, M., Groot, N. et al. (1993) A novel gene containing a trinucleotide repeat that is expanded and unstable on Huntington’s disease chromosomes. Cell, 72, 971–983.
4. Walker, F.O. (2007) Huntington’s disease. Lancet, 369, 218–228. 5. Reiner, A., Dragatsis, I. and Dietrich, P. (2011) Genetics and neuropathology of Huntington’s disease. Int. Rev. Neurobiol.,
98, 325–372.
6. Rüb, U., Seidel, K., Heinsen, H., Vonsattel, J.P., den Dunnen, W.F. and Korf, H.W. (2016) Huntington’s disease (HD): the neuropathology of a multisystem neurodegenerative disor-der of the human brain. Brain Pathol., 26, 726–740.
7. Labbadia, J. and Morimoto, R.I. (2013) Huntington’s disease: underlying molecular mechanisms and emerging concepts.
Trends Biochem. Sci., 38, 378–385.
8. Finkbeiner, S. (2011) Huntington’s disease. Cold Spring Harb.
Perspect. Biol., 3, a007476.
9. Jones, L. and Hughes, A. (2011) Pathogenic mechanisms in Huntington’s disease. Int. Rev. Neurobiol., 98, 373–418. 10. Duan, W., Jiang, M. and Jin, J. (2014) Metabolism in HD: still a
relevant mechanism? Mov. Disord., 29, 1366–1374.
11. Mochel, F. and Haller, R.G. (2011) Energy deficit in Huntington disease: why it matters. J. Clin. Invest., 121, 493–499. 12. Browne, S.E. (2008) Mitochondria and Huntington’s disease
pathogenesis. Ann. N. Y. Acad. Sci., 1147, 358–382.
13. Jenkins, B.G., Koroshetz, W.J., Beal, M.F. and Rosen, B.R. (1993) Evidence for impairment of energy metabolism in vivo in Huntington’s disease using localized 1H NMR spectroscopy.
Neurology, 43, 2689–2689.
14. Ferrante, R.J., Andreassen, O.A., Jenkins, B.G., Dedeoglu, A., Kuemmerle, S., Kubilus, J.K., Kaddurah-Daouk, R., Hersch, S.M. and Beal, M.F. (2000) Neuroprotective effects of creatine in a transgenic mouse model of Huntington’s disease. J.
Neurosci., 20, 4389–4397.
15. Nunnari, J. and Suomalainen, A. (2012) Mitochondria: in sickness and in health. Cell, 148, 1145–1159.
16. Friedman, J.R. and Nunnari, J. (2014) Mitochondrial form and function. Nature, 505, 335–343.
17. Storey, E., Kowall, N.W., Finn, S.F., Mazurek, M.F. and Beal, M.F. (1992) The cortical lesion of Huntington’s disease: fur-ther neurochemical characterization, and reproduction of some of the histological and neurochemical features by N-methyl-D-aspartate lesions of rat cortex. Ann. Neurol., 32, 526–534.
18. Henshaw, R., Jenkins, B.G., Schulz, J.B., Ferrante, R.J., Kowall, N.W., Rosen, B.R. and Flint Beal, M. (1994) Malonate produces striatal lesions by indirect NMDA receptor activa-tion. Brain Res., 647, 161–166.
19. Brouillet, E., Hantraye, P., Ferrante, R.J., Dolan, R., Leroy-Willig, A., Kowall, N.W. and Beal, M.F. (1995) Chronic mitochondrial energy impairment produces selective striatal degeneration and abnormal choreiform movements in primates. Proc. Natl. Acad. Sci. U. S. A., 92, 7105–7109. 20. Beal, M.F., Kowall, N.W., Ellison, D.W., Mazurek, M.F.,
Swartz, K.J. and Martin, J.B. (1986) Replication of the neuro-chemical characteristics of Huntington’s disease by quino-linic acid. Nature, 321, 168–171.
21. Lugo-Huitrón, R., Ugalde Muñiz, P., Pineda, B., Pedraza-Chaverrí, J., Ríos, C. and Pérez-De La Cruz, V. (2013) Quinolinic acid: an endogenous neurotoxin with multiple targets. Oxid. Med. Cell. Longev., 2013, 104024.
22. Brouillet, E., Jacquard, C., Bizat, N. and Blum, D. (2005) 3-Nitropropionic acid: a mitochondrial toxin to uncover physiopathological mechanisms underlying striatal degen-eration in Huntington’s disease. J. Neurochem., 95, 1521–1540. 23. Gu, M., Gash, M.T., Mann, V.M., Javoy-Agid, F., Cooper, J.M. and Schapira, A.H.V. (1996) Mitochondrial defect in Huntington’s disease caudate nucleus. Ann. Neurol., 39, 385–389.
Human Molecular Genetics, 2019, Vol. 00, No. 00 13
24. Naseri, N.N., Xu, H., Bonica, J., Vonsattel, J.P., Cortes, E.P., Park, L.C., Arjomand, J. and Gibson, G.E. (2015) Abnormalities in the tricarboxylic acid cycle in Huntington disease and in a Huntington disease mouse model. J. Neuropathol. Exp. Neurol.,
74, 527–537.
25. Hamilton, J., Pellman, J.J., Brustovetsky, T., Harris, R.A. and Brustovetsky, N. (2015) Oxidative metabolism in YAC128 mouse model of Huntington’s disease. Hum. Mol. Genet., 24, 4862–4878.
26. Ratovitski, T., Chighladze, E., Arbez, N., Boronina, T., Herbrich, S., Cole, R.N. and Ross, C.A. (2012) Huntingtin protein interactions altered by polyglutamine expansion as determined by quantitative proteomic analysis. Cell Cycle, 11, 2006–2021.
27. Orr, A.L., Li, S., Wang, C.-E., Li, H., Wang, J., Rong, J., Xu, X., Mastroberardino, P.G., Greenamyre, J.T. and Li, X.-J. (2008) N-terminal mutant huntingtin associates with mitochon-dria and impairs mitochonmitochon-drial trafficking. J. Neurosci., 28, 2783–2792.
28. Song, W., Chen, J., Petrilli, A., Liot, G., Klinglmayr, E., Zhou, Y., Poquiz, P., Tjong, J., Pouladi, M.A., Hayden, M.R.
et al. (2011) Mutant huntingtin binds the mitochondrial
fis-sion GTPase dynamin-related protein-1 and increases its enzymatic activity. Nat. Med., 17, 377–383.
29. Ismailoglu, I., Chen, Q., Popowski, M., Yang, L., Gross, S.S. and Brivanlou, A.H. (2014) Huntingtin protein is essential for mitochondrial metabolism, bioenergetics and structure in murine embryonic stem cells. Dev. Biol., 391, 230–240. 30. Johri, A., Chandra, A. and Beal, M.F. (2013) PGC-1α,
mitochondrial dysfunction, and Huntington’s disease.
Free Radic. Biol. Med., 62, 37–46.
31. Dubinsky, J.M. (2017) Towards an understanding of energy impairment in Huntington’s disease brain. J. Huntingtons.
Dis., 6, 267–302.
32. Hamilton, J., Pellman, J.J., Brustovetsky, T., Harris, R.A. and Brustovetsky, N. (2016) Oxidative metabolism and Ca2+
han-dling in isolated brain mitochondria and striatal neurons from R6/2 mice, a model of Huntington’s disease. Hum. Mol.
Genet., 25, 2762–2775.
33. Lee, J.M., Ivanova, E.V., Ihn, S.S., Cashorali, T., Kohane, I., Gusella, J.F. and MacDonald, M.E. (2007) Unbiased gene expression analysis implicates the huntingtin polyglu-tamine tract in extra-mitochondrial energy metabolism.
PLoS Genet., 3, 1397–1406.
34. Polyzos, A.A. and McMurray, C.T. (2017) The chicken or the egg: mitochondrial dysfunction as a cause or consequence of toxicity in Huntington’s disease. Mech. Ageing Dev., 161, 181–197.
35. Powers, W.J., Videen, T.O., Markham, J., McGee-Minnich, L., Antenor-Dorsey, J.V., Hershey, T. and Perlmutter, J.S. (2007) Selective defect of in vivo glycolysis in early Huntington’s disease striatum. Proc. Natl. Acad. Sci. U. S. A., 104, 2945–2949. 36. Koroshetz, W.J., Jenkins, B.G., Rosen, B.R. and Beal, M.F. (2004) Energy metabolism defects in Huntington’s disease and effects of coenzyme Q10. Ann. Neurol., 41, 160–165.
37. Gouarné, C., Tardif, G., Tracz, J., Latyszenok, V., Michaud, M., Clemens, L.E., Yu-Taeger, L., Nguyen, H.P., Bordet, T. and Pruss, R.M. (2013) Early deficits in glycolysis are specific to striatal neurons from a rat model of Huntington disease. PLoS One, 8, 1–15.
38. Lou, S., Lepak, V.C., Eberly, L.E., Roth, B., Cui, W., Zhu, X.H., Öz, G. and Dubinsky, J.M. (2016) Oxygen consumption deficit in Huntington disease mouse brain under metabolic stress.
Hum. Mol. Genet., 25, 2813–2826.
39. Sameni, S., Syed, A., Marsh, J.L. and Digman, M.A. (2016) The phasor-FLIM fingerprints reveal shifts from OXPHOS to enhanced glycolysis in Huntington disease. Sci. Rep., 6, 1–8. 40. The HD iPSC Consortium (2012) Induced pluripotent stem
cells from patients with Huntington’s disease show CAG-repeat-expansion-associated phenotypes. Cell Stem Cell, 11, 264–278.
41. Mattis, V.B., Tom, C., Akimov, S., Saeedian, J., Østergaard, M.E., Southwell, A.L., Doty, C.N., Ornelas, L., Sahabian, A., Lenaeus, L. et al. (2015) HD iPSC-derived neural progeni-tors accumulate in culture and are susceptible to BDNF withdrawal due to glutamate toxicity. Hum. Mol. Genet., 24, 3257–3271.
42. The HD iPSC Consortium (2017) Developmental alterations in Huntington’s disease neural cells and pharmacological rescue in cells and mice. Nat. Neurosci., 20, 648–660. 43. Aubry, L., Bugi, A., Lefort, N., Rousseau, F., Peschanski, M.
and Perrier, A.L. (2008) Striatal progenitors derived from human ES cells mature into DARPP32 neurons in vitro and in quinolinic acid-lesioned rats. Proc. Natl. Acad. Sci. U. S. A.,
105, 16707–16712.
44. Telezhkin, V., Schnell, C., Yarova, P., Yung, S., Cope, E., Hughes, A., Thompson, B.A., Sanders, P., Geater, C., Hancock, J.M. et al. (2016) Forced cell cycle exit and modulation of GABAA, CREB, and GSK3β signaling promote functional mat-uration of induced pluripotent stem cell-derived neurons.
Am. J. Physiol. Cell Physiol., 310, C520–C541.
45. Sheridan, S.D., Theriault, K.M., Reis, S.A., Zhou, F., Madison, J.M., Daheron, L., Loring, J.F. and Haggarty, S.J. (2011) Epigenetic characterization of the FMR1 gene and aberrant neurodevelopment in human induced pluripotent stem cell models of fragile X syndrome. PLoS One, 6, e26203.
46. Tuncbag, N., Gosline, S.J.C., Kedaigle, A., Soltis, A.R., Gitter, A. and Fraenkel, E. (2016) Network-based interpretation of diverse high-throughput datasets through the Omics Inte-grator software package. PLoS Comput. Biol., 12, e1004879. 47. Razick, S., Magklaras, G. and Donaldson, I.M. (2008)
iRefIndex: a consolidated protein interaction database with provenance. BMC Bioinformatics, 9, 405.
48. Shirasaki, D.I., Greiner, E.R., Al-Ramahi, I., Gray, M., Boontheung, P., Geschwind, D.H., Botas, J., Coppola, G., Horvath, S., Loo, J.A. and Yang, X.W. (2012) Network organization of the huntingtin proteomic interactome in mammalian brain. Neuron, 75, 41–57.
49. Kutmon, M., Riutta, A., Nunes, N., Hanspers, K., Willighagen, E.L., Bohler, A., Mélius, J., Waagmeester, A., Sinha, S.R., Miller, R. et al. (2016) WikiPathways: capturing the full diversity of pathway knowledge. Nucleic Acids Res.,
44, D488–D494.
50. Castello, P.R., Drechsel, D.A. and Patel, M. (2007) Mito-chondria are a major source of paraquat-induced reactive oxygen species production in the brain. J. Biol. Chem., 282, 14186–14193.
51. Nulton-Persson, A.C. and Szweda, L.I. (2001) Modulation of mitochondrial function by hydrogen peroxide. J. Biol. Chem.,
276, 23357–23361.
52. Naseri, N.N., Bonica, J., Xu, H., Park, L.C., Arjomand, J., Chen, Z. and Gibson, G.E. (2016) Novel metabolic abnormalities in the tricarboxylic acid cycle in peripheral cells from Huntington’s disease patients. PLoS One, 11, e0160384.
53. Skotte, N.H., Andersen, J.V., Santos, A., Aldana, B.I., Willert, C.W., Norremolle, A., Waagepetersen, H.S. and Nielsen, M.L. (2018) Integrative characterization of the R6/2
14 Human Molecular Genetics, 2019, Vol. 00, No. 00
mouse model of Huntington’s disease reveals dysfunctional astrocyte metabolism. Cell Rep., 23, 2211–2224.
54. Marangos, J.P. and Paul, S. (1981) Brain levels of neuron-specific and nonneuronal enolase in Huntington’s disease.
J. Neurochem., 37, 1338–1340.
55. Allen, S.P., Rajan, S., Duffy, L., Mortiboys, H., Higginbottom, A., Grierson, A.J. and Shaw, P.J. (2014) Superoxide dismutase 1 mutation in a cellular model of amyotrophic lateral sclerosis shifts energy generation from oxidative phosphorylation to glycolysis. Neurobiol. Aging, 35, 1499–1509.
56. Cooper, O., Seo, H., Andrabi, S., Guardia-Laguarta, C., Graziotto, J., Sundberg, M., McLean, J.R., Carrillo-Reid, L., Xie, Z., Osborn, T. et al. (2012) Pharmacological rescue of mitochondrial deficits in iPSC-derived neural cells from patients with familial Parkinson’s disease. Sci. Transl. Med., 4, 141ra90.
57. Conforti, P., Besusso, D., Bocchi, V.D., Faedo, A., Cesana, E., Rossetti, G., Ranzani, V., Svendsen, C.N., Thompson, L.M., Toselli, M. et al. (2018) Faulty neuronal determination and cell polarization are reverted by modulating HD early phe-notypes. Proc. Natl. Acad. Sci. U. S. A., 115, E762–E771. 58. Molero, A.E., Arteaga-Bracho, E.E., Chen, C.H., Gulinello,
M., Winchester, M.L., Pichamoorthy, N., Gokhan, S., Khodakhah, K. and Mehler, M.F. (2016) Selective expression of mutant huntingtin during development recapitulates characteristic features of Huntington’s disease. Proc. Natl.
Acad. Sci. U. S. A., 113, 5736–5741.
59. Goyal, M.S., Hawrylycz, M., Miller, J.A., Snyder, A.Z. and Raichle, M.E. (2014) Aerobic glycolysis in the human brain is associated with development and neotenous gene expres-sion. Cell Metab., 19, 49–57.
60. Vander Heiden, M.G., Cantley, L.C. and Thompson, C.B. (2009) Understanding the Warburg effect: cell proliferation. Science,
324, 1029.
61. Goyal, M.S., Vlassenko, A.G., Blazey, T.M., Su, Y., Couture, L.E., Durbin, T.J., Bateman, R.J., Benzinger, T.L.S., Morris, J.C. and Raichle, M.E. (2017) Loss of brain aerobic glycolysis in normal human aging. Cell Metab., 26, 353–360.
62. Vlassenko, A.G., Vaishnavi, S.N., Couture, L.E., Sacco, D., Shannon, B.J., Mach, R.H., Morris, J.C., Raichle, M.E. and Mintun, M.A. (2010) Spatial correlation between brain aero-bic glycolysis and amyloid-β (Aβ) deposition. Proc. Natl. Acad.
Sci. U. S. A., 107, 17763–17767.
63. Vlassenko, A.G., Gordon, B.A., Goyal, M.S., Su, Y., Blazey, T.M., Durbin, T.J., Couture, L.E., Christensen, J.J., Jafri, H., Morris, J.C., Raichle, M.E. and Benzinger, T.L.S. (2018) Aerobic glycol-ysis and tau deposition in preclinical Alzheimer’s disease.
Neurobiol. Aging, 67, 95–98.
64. Mochel, F., Durant, B., Meng, X., O’Callaghan, J., Yu, H., Brouillet, E., Wheeler, V.C., Humbert, S., Schiffmann, R. and Durr, A. (2012) Early alterations of brain cellular energy homeostasis in huntington disease models. J. Biol. Chem.,
287, 1361–1370.
65. Adanyeguh, I.M., Rinaldi, D., Henry, P.-G., Caillet, S., Valabregue, R., Durr, A. and Mochel, F. (2015) Triheptanoin improves brain energy metabolism in patients with Huntington disease. Neurology, 84, 490–495.
66. Moruno Manchon, J.F., Uzor, N.E., Dabaghian, Y., Furr-Stimming, E.E., Finkbeiner, S. and Tsvetkov, A.S. (2015) Cytoplasmic sphingosine-1-phosphate pathway modulates neuronal autophagy. Sci. Rep., 5, 1–15.
67. Pirhaji, L., Milani, P., Dalin, S., Wassie, B.T., Dunn, D.E., Fenster, R.J., Avila-Pacheco, J., Greengard, P., Clish, C.B., Heiman, M., Lo, D.C. and Fraenkel, E. (2017) Identifying
therapeutic targets by combining transcriptional data with ordinal clinical measurements. Nat. Commun., 8, 623. 68. Acuña, A.I., Esparza, M., Kramm, C., Beltrán, F.A., Parra,
A.V., Cepeda, C., Toro, C.A., Vidal, R.L., Hetz, C., Concha, I.I.
et al. (2013) A failure in energy metabolism and antioxidant
uptake precede symptoms of Huntington’s disease in mice.
Nat. Commun., 4, 1–13.
69. Carroll, J.B., Deik, A., Fossale, E., Weston, R.M., Guide, J.R., Arjomand, J., Kwak, S., Clish, C.B. and MacDonald, M.E. (2015) HdhQ111 mice exhibit tissue specific metabolite profiles that include striatal lipid accumulation. PLoS One, 10, 1–19. 70. Cui, L., Jeong, H., Borovecki, F., Parkhurst, C.N., Tanese, N. and
Krainc, D. (2006) Transcriptional repression of PGC-1alpha by mutant huntingtin leads to mitochondrial dysfunction and neurodegeneration. Cell, 127, 59–69.
71. Weydt, P., Pineda, V.V., Torrence, A.E., Libby, R.T., Satterfield, T.F., Lazarowski, E.R., Gilbert, M.L., Mortin, G.J., Bammler, T.K., Strand, A.D. et al. (2006) Thermoregulatory and metabolic defects in Huntington’s disease transgenic mice implicate PGC-1alpha in Huntington’s disease neurodegeneration. Cell Metab., 4, 349–362.
72. van der Harg, J.M., van Heest, J.C., Bangel, F.N., Patiwael, S., van Weering, J.R.T. and Scheper, W. (2017) The UPR reduces glucose metabolism via IRE1 signaling. Biochim. Biophys. Acta
Mol. Cell Res., 1864, 655–665.
73. Zala, D., Hinckelmann, M.V., Yu, H., Lyra Da Cunha, M.M., Liot, G., Cordelières, F.P., Marco, S. and Saudou, F. (2013) Vesicular glycolysis provides on-board energy for fast axonal transport. Cell, 152, 479–491.
74. Shestov, A.A., Liu, X., Ser, Z., Cluntun, A.A., Hung, Y.P., Huang, L., Kim, D., Le, A., Yellen, G., Albeck, J.G. and Locasale, J.W. (2014) Quantitative determinants of aerobic glycolysis identify flux through the enzyme GAPDH as a limiting step. Elife, 3, 1–18.
75. Hoppins, S. and Nunnari, J. (2012) Mitochondrial dynamics and apoptosis—the ER connection. Science, 337, 1052–1054. 76. Murley, A. and Nunnari, J. (2016) The emerging network of
mitochondria-organelle contacts. Mol. Cell, 61, 648–653. 77. Bol’shakova, A.V., Kraskovskaya, N.A., Gainullina, A.N.,
Kukanova, E.O., Vlasova, O.L. and Bezprozvanny, I.B. (2017) Neuroprotective effect of σ 1-receptors on the cell model of Huntington’s disease. Bull. Exp. Biol. Med., 164, 252–258. 78. Ryskamp, D., Wu, J., Geva, M., Kusko, R., Grossman, I.,
Hayden, M. and Bezprozvanny, I. (2017) The sigma-1 receptor mediates the beneficial effects of pridopidine in a mouse model of Huntington disease. Neurobiol. Dis., 97, 46–59. 79. Tagashira, H., Shinoda, Y., Shioda, N. and Fukunaga, K. (2014)
Methyl pyruvate rescues mitochondrial damage caused by SIGMAR1 mutation related to amyotrophic lateral sclerosis.
Biochim. Biophys. Acta, 1840, 3320–3334.
80. Naia, L., Cunha-Oliveira, T., Rodrigues, J., Rosenstock, T.R., Oliveira, A., Ribeiro, M., Carmo, C., Oliveira-Sousa, S.I., Duarte, A.I., Hayden, M.R. et al. (2017) Histone deacetylase inhibitors protect against pyruvate dehydrogenase dysfunction in Huntington’s disease. J. Neurosci., 37, 2776–2794.
81. Yang, Y., Duan, W., Lin, Y., Yi, W., Liang, Z., Yan, J., Wang, N., Deng, C., Zhang, S., Li, Y. et al. (2013) SIRT1 acti-vation by curcumin pretreatment attenuates mitochondrial oxidative damage induced by myocardial ischemia reperfu-sion injury. Free Radic. Biol. Med., 65, 667–679.
82. Jiang, M., Wang, J., Fu, J., Du, L., Jeong, H., West, T., Xiang, L., Peng, Q., Hou, Z., Cai, H. et al. (2012) Neuroprotective role of Sirt1 in mammalian models of Huntington’s disease through activation of multiple Sirt1 targets. Nat. Med., 18, 153–158.


![[PDF] Catalogue de formation bureautique PDF | Cours Bureautique](data:image/gif;base64,R0lGODlhAQABAIAAAP///wAAACH5BAEAAAAALAAAAAABAAEAAAICRAEAOw==)