Publisher’s version / Version de l'éditeur:
IEEE AUV 2010 Conference proceedings, 2010-09-03
READ THESE TERMS AND CONDITIONS CAREFULLY BEFORE USING THIS WEBSITE.
https://nrc-publications.canada.ca/eng/copyright
Vous avez des questions? Nous pouvons vous aider. Pour communiquer directement avec un auteur, consultez la première page de la revue dans laquelle son article a été publié afin de trouver ses coordonnées. Si vous n’arrivez pas à les repérer, communiquez avec nous à PublicationsArchive-ArchivesPublications@nrc-cnrc.gc.ca.
Questions? Contact the NRC Publications Archive team at
PublicationsArchive-ArchivesPublications@nrc-cnrc.gc.ca. If you wish to email the authors directly, please see the first page of the publication for their contact information.
Archives des publications du CNRC
This publication could be one of several versions: author’s original, accepted manuscript or the publisher’s version. / La version de cette publication peut être l’une des suivantes : la version prépublication de l’auteur, la version acceptée du manuscrit ou la version de l’éditeur.
Access and use of this website and the material on it are subject to the Terms and Conditions set forth at
Design and testing of the Marport SQX-500 twin-pod AUV
Shea, David; Williams, Christopher; He, Moquin; Crocker, Peter; Riggs, Neil;
Bachmayer, Ralf
https://publications-cnrc.canada.ca/fra/droits
L’accès à ce site Web et l’utilisation de son contenu sont assujettis aux conditions présentées dans le site LISEZ CES CONDITIONS ATTENTIVEMENT AVANT D’UTILISER CE SITE WEB.
NRC Publications Record / Notice d'Archives des publications de CNRC:
https://nrc-publications.canada.ca/eng/view/object/?id=d66d24c3-cdf7-4491-862e-9dc47bf45afe https://publications-cnrc.canada.ca/fra/voir/objet/?id=d66d24c3-cdf7-4491-862e-9dc47bf45afe
Design and Testing of the Marport SQX-500
Twin-Pod AUV
David Shea
1, Christopher Williams
2, Moqin He
2, Peter Crocker
1, Neil Riggs
1,
Ralf Bachmayer
31
Marport Deep Sea Technology 2Institute for Ocean Technology 3Faculty of Engineering and Applied Sciences
National Research Council Canada Memorial University of Newfoundland
St. John’s, NL St. John’s, NL St. John’s, NL
Canada Canada Canada
Abstract— The SQX-500 AUV is currently under joint
development by Marport Canada Inc, the Institute for Ocean Technology of the National Research Council Canada, and Memorial University of Newfoundland. With a twin-hull design, and a novel propulsion and control system, the SQX-500 provided several unique challenges during the design and development process. In order to characterize the hydrodynamic performance of this vehicle for various operating conditions, a complete set of hydrodynamic experiments was carried out. These experiments included 0.88 scale model tow tank testing, full scale testing of a custom propeller, passive stability verification, and several tests to characterize the vehicle propulsion system. Together these experiments determine the overall propulsive efficiency of the vehicle under various operating conditions. In addition, analysis of the results from these experiments was used to determine which tests should be performed on future vehicle designs.
I. INTRODUCTION
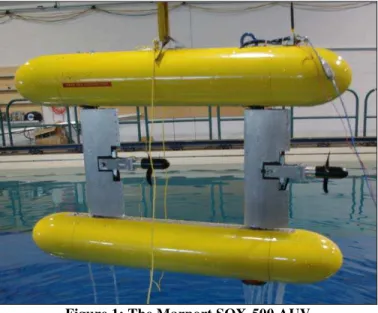
HE SQX-500, developed by Marport Canada Inc., is a compact, medium weight Autonomous Underwater Vehicle (AUV) designed for inspection and mapping applications in waters of down to 500 metres in depth (shown in Figure 1). A large vertical separation between the centre of gravity (CG) and centre of buoyancy (CB) provides a passively stable platform optimal for deployment of sonar or optical imaging payloads. In addition, the innovative 3D thrust vectoring propulsion system unique to the SQX-500 creates an extremely manoeuvrable platform, allowing for capabilities such as hovering, and a zero metre turning radius [1] [2].
Due to the innovative nature of the SQX-500 design, there was not a significant amount of previously published work available relating to the hydrodynamic modeling or propulsion characterization of such a vehicle. As a result, several unknown variables were identified in the AUV design cycle, introducing risk factors into the development of this new product. An accurate model of hydrodynamic resistance in all six degrees of freedom (6DOF) is required to determine the output power required for a given vehicle speed. Knowledge
of the AUV propulsion system performance and efficiency is necessary to determine input power required to achieve required thrust, as well as to determine the size and weight requirements of the vehicle actuators. The manoeuvring capabilities of the vehicle must be characterized in order to prove the concept of operations and evaluate how different manoeuvres can be achieved. As well, the control system requirements of these manoeuvres must be understood in order to implement the manoeuvres autonomously. Finally, the passive stability of the vehicle must be characterized in order to verify and quantify the performance of the system as a sonar or optical imaging platform.
Figure 1: The Marport SQX-500 AUV
These risk factors were mitigated through several sets of testing and simulation. Examples include hydrodynamic simulation, scale model and real world testing as well as characterization and modeling of the SQX-500 structure, hull shape, and propulsion system. The purpose and planning of these tests was to provide an extensive but not exhaustive set of data to mitigate the described risk factors in the design process, in a cost-effective and timely manner. Thus, the scope of the tests was narrowed in order to focus only on the desired
variables, and the number of tests was reduced to the minimum number that would ensure sufficient data quality.
The focus of this paper will be several examples of various tests that have been performed with the SQX-500 AUV. The test plans and resulting data from those tests are presented, as well as an initial analysis of the data, and an assessment of the resulting usefulness of the test in the context of the AUV design cycle. Additionally, some background information is provided regarding the location and facilities required to perform these tests, in particular featuring the extensive use of the facilities and researchers at the Institute for Ocean Technology at the National Research Council Canada (NRC-IOT) in St. John’s, Newfoundland.
II. INITIALVEHICLERESISTANCEESTIMATES To progress from the initial conceptual SQX-500 AUV design to a prototype design for construction, estimates of hydrodynamic drag and power requirements were necessary. This data was a critical input into the initial propulsion system design, and an essential component for an initial performance estimate of the AUV. In order to simplify the data requirement, the drag of the system was evaluated as separated components; cylindrical hulls with ellipsoidal nose cones, vertical rudders, and horizontal elevators. The sum effect of these individual components was then calculated to estimate the total vehicle forward drag.
In order to calculate the forward drag of each of these components, the use of computational fluid dynamics (CFD) was considered, however it was not favoured due to the significant time investment and costly software required. Instead, previously published scientific literature was reviewed in order to locate existing hydrodynamic drag data for similar designs of each component.
Cylindrical hull forward drag values were based on those of the Phoenix AUV [3] of Phoenix International Inc., where a series of tests were performed measuring the forward drag at zero vehicle Angle of Attack (AOA), with a fixed diameter of approximately 20 cm, and a varied length. The purpose of these tests was to evaluate the effect of a variation in Length-to-Diameter Ratio (LDR). In order to most closely match the geometry of the SQX-500 AUV, drag values for an LDR of 8.5 and a hull diameter of 20 cm were selected.
Rudder and elevator forward drag values were based on standard test data available for NACA airfoils. Extensive testing has previously been performed on the drag of NACA airfoils at low AOA; while most test data was obtained in air, the results can be adapted to water by using a conversion factor between air density and water density. A chord length of 10 cm was assumed for initial vehicle drag estimates.
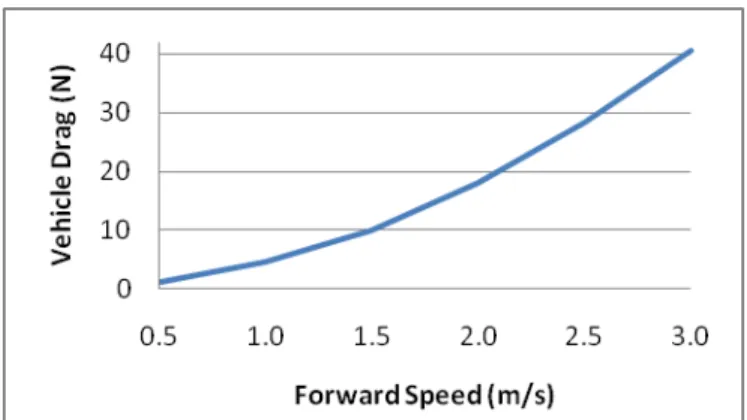
Forward drag estimates for all components were then combined, and an initial estimate for total vehicle forward drag based on forward speed was produced. [4] A graph of the results can be seen in Figure 2.
Figure 2: SQX-500 Initial Vehicle Drag Estimate
These results provided a very useful starting point for developing the initial conceptual design of the SQX-500 into a functional prototype design, providing specifications for propulsion requirements and vehicle performance estimates. However, as the vehicle design was evolved into a functional prototype design, two significant short-comings were identified. Firstly, as the shape size of the AUV design was modified to accommodate sensors and payloads, the system deviated from the design used to make initial forward drag estimates, and thus these estimates were deemed no longer valid. Secondly, and most importantly, the data available was only for forward drag; little published data was available for cylindrical hulls in very high angles of attack, such as when the vehicle will be traversing or holding station in a current. As a result, it was deemed necessary to perform a series of hydrodynamic drag tests with an accurate scale-model of the SQX-500, in order to produce a full 6DOF hydrodynamic model.
III. SCALEMODELTESTING
There are several benefits to scale model hydrodynamic testing prior to full-scale prototype production, the two most notable typically being reduced cost and complexity of the model. Researchers at the NRC-IOT regularly produce scale models of large commercial ships for testing and evaluation of drag and manoeuvrability. The cost of producing such models is relatively inexpensive when compared to the significant cost of building and testing a full-scale vessel, and in some cases multiple models can be produced and tested in order to evaluate different hull designs or propulsion systems.
However, there are some disadvantages to scale model testing, particularly while performing hydrodynamic drag measurements. For example, excess drags as a result of any minor imperfections in surface finish of the hull on a scale model become magnified when scaled up to full-size, skewing data significantly. As well, the resolution of the measurement systems can be a concern as the smaller scale systems require higher resolution instrumentation in order to maximize the Signal to Noise Ratio (SNR) of the measurement. If resolution is too low, or scale is too high, then the difference in drag measurements becomes indiscernible from noise present in the data.
In the case of the SQX-500 AUV, it was decided that the scale model be as low-cost and quick to manufacture as possible, while still being close to full scale. The largest diameter aluminum pipe available locally at the time was 8-inch Schedule 40, giving an outer diameter (O.D.) of 219 mm. As the hull diameter of the SQX-500 was 250 mm, this resulted in a 0.88 scale model. All other dimensions were then scaled by 0.88. This scale also provided a sufficiently large inner diameter (I.D.) to accommodate a 6DOF waterproof force balance, which was used to measure drag forces on the model in all six degrees of freedom. The completed scale model and dimensioned drawing can be seen below in Figure 3 and Figure 4, respectively.
Figure 3: 0.88 Scale Model of SQX-500
Figure 4: Dimensional Drawings of Scale Model
The three primary manoeuvres of the SQX-500 AUV are forward transit, hovering while holding station, and transverse motion (also known as “crabbing”). In order to provide sufficient hydrodynamic drag data for these manoeuvres, three sets of drag tests were performed with the scale model to measure resistance in forward transit, sway and heave. In each set of tests, the angle of attack of the scale model was varied in order to obtain data for the vehicle in all orientations relative to vehicle motion. Angle of attack was controlled
using a yaw table, mounted to a tow carriage for drag tests. The tests were performed in the 200 m Clear Water Towing Tank at the NRC-IOT, Figure 5.
Figure 5: Scale Model Mounted to Towing Carriage
The surge, sway and heave force results from these tests can be seen in Figures 6, 7 and 8 below [5]. It is obvious from the significant difference between Figure 6 and the initial estimates of forward drag force in Figure 2 that these tests were justified. It is noted that the scale model does lack the appendages (antennae, transducers, etc.) present in the prototype vehicle design, and thus drag on the prototype vehicle will be higher than that indicated in these results. Also, it is noted that these results have not been scaled from 0.88 to full scale. However, these results do provide a valuable input into performance predictions and design of the AUV propulsion system.
Figure 7: Scale Model Sway Drag Force Results
Figure 8: Scale Model Heave Drag Results
IV. PROPELLERDESIGNANDTESTING
The first stage of the prototype propulsion system design for the SQX-500 AUV was the selection of a propeller. After a brief evaluation of existing commercially available propellers, it was decided that the optimal solution would be to have a custom propeller designed and produced specifically for the SQX-500. While several commercial propeller design companies were located, ultimately the researchers at the NRC-IOT were consulted, chosen for their expertise and experience in the area of propeller design. As well, the facilities at the NRC-IOT, in particular the Cavitation Tunnel, were particularly well suited to the testing and evaluation of propellers in this size range.
Using the initial drag estimates for the SQX-500 as an input to the propeller design ensured that the propeller would be properly matched to the AUV design, and would help to maximize the efficiency of the propulsion system. In addition, several other specifications were used as inputs into the design of a custom propeller. Based on past experiences in propeller design, it was noted that a large diameter, low RPM propeller would produce the highest efficiency. In order to maintain the +/- 30 degrees of thruster pitch range required by the 3D Thrust Vectoring propulsion system, the maximum propeller diameter was 21 cm. At this diameter, a maximum propeller speed of 900 RPM was considered “low”.
Based on these design specifications, several iterations of propeller designs were produced using the open-source
propeller design software “OpenProp”. Each of the design iterations was evaluated for efficiency, thrust produced, and torque required at a given RPM. Once a final design was selected, it was then subjected to a manufacturability review.
Depending on the application, production and prototype propellers have been manufactured from materials such as metals, plastics or composites using methods including casting, machining and even rapid prototyping. Each of these options has its own benefits and short-comings; however a discussion of these is outside the scope of this paper. Given the limited number of propellers initially required (two per vehicle), and the desire to keep production costs low, it was decided that the propellers would be cast from urethane or epoxy compounds.
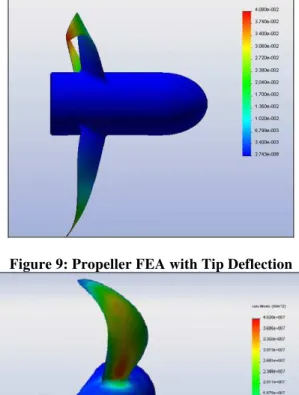
Before development of a casting mould for production of the propeller could begin, an additional review of the propeller design was deemed necessary to ensure that the propeller blades would withstand the forces from thrusting at maximum RPM under full load. A secondary purpose of this review was to make minor modifications to the design in order to facilitate casting. In order to accomplish these goals, a Finite Element Analysis (FEA) of the propeller was performed, which prompted several minor design changes including “thickening” of the propeller blades at certain points, and rounding several corners. Results of the FEA can be seen in Figure 9 and 10 below [6].
Figure 9: Propeller FEA with Tip Deflection
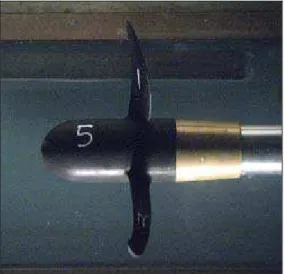
After completion of the manufacturability review two casting compounds were selected as potential candidates and two sets of propellers were produced, one set of each compound. Both sets of propellers were subjected to testing in the NRC-IOT’s Cavitation Tunnel, where simultaneous measurements were made of shaft torque, RPM and flow speed. The Cavitation Tunnel test setup can be seen in Figure 11. The blade tip deflection was also measured to provide a comparison of rigidity between the two compounds selected. The results of these tests can be seen in Figure 12 [7]
Figure 11: Propeller in NRC-IOT Cavitation Tunnel
Figure 12: Open Water Characteristics of Propeller
Several significant conclusions were drawn from the results of these tests. Firstly, the theoretical performance of a custom propeller design (estimated mathematically) was verified with real-world test data; real-world efficiency was up to 70%, agreeing well with theoretical efficiency. Secondly, it was demonstrated that the custom design and production of a cast urethane propeller is a viable and cost-effective solution for the design of AUV propulsion systems. Finally, it was observed that high propeller blade rigidity is desirable in this propeller design; as blade deflection increases while under load, propeller performance decreases as the propeller shape deviates from the design.
V. THRUSTERDESIGNANDTESTING
The second stage in the development of the SQX-500 propulsion system was the design, prototyping and characterization of a complete thruster assembly. The thruster design was based on a set of specifications developed from the testing and characterization of the custom propeller. These specifications featured a set of torque vs. RPM values, up to a maximum of 1.5 N.m at 900 RPM, and also included length and diameter constraints due to the propeller design.
A brushless DC motor and gearbox combination, as well as a CAN bus based motor controller, were selected which suited the torque and speed requirements. The selection of these components was based on manufacturer datasheet information which matched torque and speed requirements.
After component selection was completed, it was deemed necessary to characterize the thruster drive train without propeller, as well as the motor controller. This was necessary to ensure sufficient performance would be achieved to drive the propeller as required. The secondary purpose of this experiment was to verify real world performance against datasheet data, aiding in future motor selection processes and furthering understanding of motor and motor controller interaction. To properly characterize the thruster drive train, a series of tests were performed using a dynamometer to measure the output torque and RPM of the thruster under a series of varying loads.
The dynamometer testing apparatus as shown in Figure 13 and 14 below [8] consisted of a mounting frame, commercially available dynamometer and data acquisition system (DAS), friction brake and weight pan for applying constant loads to the friction brake. The testing procedure was as follows; a fixed weight was placed into the weight pan, thus applying a constant load to the friction brake, and then set speed of the drive train was varied by input command to the motor controller. Output torque and speed were measured from the dynamometer using the DAS and DC input voltage and current were measured using a digital multimeter. Using this data, a simple input and output power calculation was performed, giving an accurate measurement of overall drive train efficiency.
Figure 13: Model of Thruster Dynamometer Testing Apparatus
The results of the thruster drive train dynamometer tests were positive, and provided several significant outcomes. Measurements of motor efficiency versus torque and RPM were found to closely match the manufacturer’s specifications. Measurements of gearbox efficiency proved to be the most interesting. The manufacturer’s specifications list only a constant efficiency of 75% for the gearbox, however it was discovered that gearbox efficiency varies significantly with torque, typically being well below 50%, only reaching peak efficiency of 75% under maximum load. Additionally, the efficiency losses due to the use of an o-ring shaft seal and mechanical shaft coupling was a point of much discussion during initial design. However, tests showed an approximate 5% loss in overall efficiency due to these mechanical losses.
Figure 14: Thruster Dynamometer Testing Apparatus
After the thruster drive train characterization was completed, a characterization of the complete thruster assembly was required, including drive train and propeller. The purpose of this testing was to verify the performance of the full thruster assembly including propeller, as well as provide a basis for comparison with results from previous propeller and drive train performance tests. Additionally, any unknown losses such as hydrodynamic effects would also be measured. Characterization was performed by testing the thruster assembly in a flume tank while measuring thrust, water flow velocity, propeller RPM and power input.
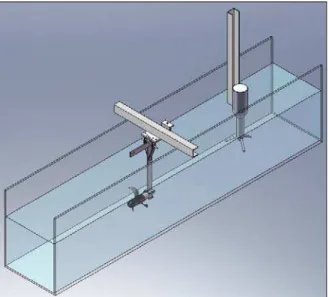
The flume tank testing apparatus in Figures 15 and 16 [9] consisted of a thruster assembly mounted to a single point 220 N load cell via a moment arm, installed in a 40 cm x 40 cm flume tank. The specific flume tank used is part of the Fluid and Hydraulics Lab at Memorial University of Newfoundland. An Acoustic Doppler Velocimeter (ADV) was installed upstream of the thruster in the flume tank to accurately measure flow speed to the thruster. The testing procedure was as follows; a desired flow speed was established in the flume tank (capable of zero – 0.5 m/s), and the RPM of the thruster was varied, while the force on the load cell and input power to the motor controller were measured simultaneously. Using this data, a measurement of input power and a calculation of output power were produced, thus providing an estimate of total thruster efficiency.
In addition to other tests, on the advice of the motor controller manufacturer, the low inductance of the motor phases was increased by repeating thrust tests with several different
inductors in series with each phase. The purpose of this was to reduce current ripple in the motor, which was expected to have a significant impact on motor performance and efficiency, and ultimately improve thruster performance.
Figure 15: Model of Thruster Flume Tank Testing Apparatus
Figure 16: Flume Tank Thrust Testing Apparatus
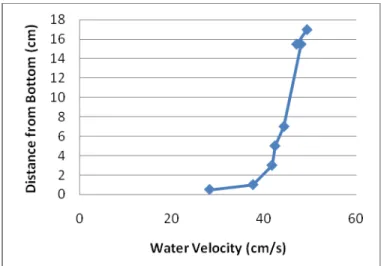
Several significant outcomes resulted from the thruster assembly characterization during flume tank testing, however the accuracy of actual resulting data was considered questionable. Several shortcomings in the testing configuration and apparatus were discovered. Firstly, due to the small cross-section of the flume tank, boundary effects significantly affected the homogeneity of the flow speed over the cross-section; flow speeds at the surface of the tank were notably different than flow speeds at the bottom, as seen in Figure 17. This resulted in an approximate 5 cm/s flow speed gradient over the diameter of the propeller. As well, the small cross-section of the tank relative to the diameter of the propeller resulted in vortices forming around the propeller from the surface, which skewed the test data. Finally, the
capabilities of the flume tank did not allow for optimal test conditions, with flow speeds only up to 0.5 m/s.
Figure 17: Boundary Effects on Flow Speed in Flume Tests
Despite the short-comings, this thruster characterization provided a valuable experience and demonstration of real world thruster testing, particularly regarding what facilities and apparatus are required for an accurate test.
VI. STABILITYTESTS
One of the most significant features of the SQX-500 AUV design is the inherent passive stability in two degrees of freedom, pitch and roll. This stability is a product of the twin-hull design, and results from the large vertical separation of the CG and CB. This concept has been successfully proven on previous vehicles such as the SeaBED [10] and ABE [11] AUVs from WHOI.
In order to quantify the passive stability of the SQX-500 AUV, a simple test was performed to identify the natural period of oscillation of the vehicle in pitch and roll. This was done using a test method similar to an impulse response. A tag line was attached to the vehicle’s recovery hook, and the vehicle was placed in the Marine Institute’s Flume Tank, and the flow speed was set to zero. The vehicle was then excited in either pitch or roll by pulling on the tag lines and then released to allow free damped oscillations. The oscillations were measured in both pitch and roll by using an Xsens AHRS (Attitude and Heading Reference Sensor) and the attitude sensors built into the vehicle’s Doppler Velocity Log (DVL). Results can be seen in Figures 18 and 19 [12].
A fast Fourier transform (FFT) was applied to the results from each test, and the peak frequencies were identified as the natural frequencies of oscillation. An example of an FFT of the pitch data can be seen in Figure 20. The natural frequency in pitch was found to be 0.23 Hz, and in roll was 0.27 Hz. These results provided a valuable indication of expected stability in pitch and roll; however the dynamic stability and oscillations during transit remain to be tested.
Figure 18: Roll Stability Test Data
Figure 19: Pitch Stability Test Data
VII. FULLSCALERESISTANCETESTS
After manufacturing of the prototype SQX-500 AUV was completed, the opportunity was available to perform an additional set of hydrodynamic resistance testing on this full-scale vehicle. A set of full-full-scale tests was performed in the Marine Institute’s 22 x 8 x 4 m Flume Tank, using single-point load cells. The purpose of these tests was to measure the forward drag of a full-scale vehicle, as well as to evaluate the benefits of using the Flume Tank and single-point load cells versus using the Towing Tank at the NRC-IOT, and a 6DOF force balance.
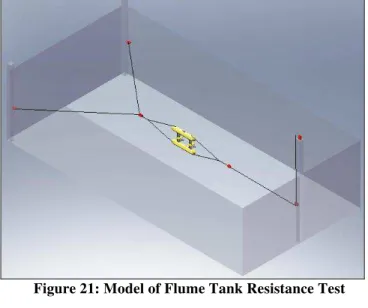
Figure 21: Model of Flume Tank Resistance Test
Figure 22: Flume Tank Resistance Test Setup
The test apparatus consisted of the SQX-500 AUV, suspended at the approximate center of the flume tank by steel wire tag lines fore and aft, which connected to an upstream and downstream load cell, respectively. This setup is shown in Figures 21 and 22 above. The system was pretensioned in order to maintain the position of the AUV in the tank. The test procedure first involved setting the flume tank flow rate to predefined step, between zero and 1.0 m/s. Once the flow speed had settled to steady state, several minutes of data were collected from each load cell. The subtraction of the force on the downstream load cell from that of the upstream load cell provided the actual force exerted on the AUV. After subtracting the force from preloading tension, the resulting force was equal to the hydrodynamic resistance to forward travel of the AUV at that particular flow speed, Figure 23 [13].
The results from these tests were positive. Although the drag measurements were higher than previous tests, this was expected due to the added appendages of the completed prototype. Unlike previous tests performed at the NRC-IOT Towing Tank, only forward drag at a zero AOA was measured during these tests, and only up to 1.0 m/s forward speed. Additionally, one significant shortcoming of this test setup was noted. Due to the vehicle being suspended by pretensioned tag lines, instead of rigidly mounted to a carriage, the angle of attack became difficult to control. Minor rudder adjustments were required to maintain a zero angle; however some data was rendered invalid due to slow-drift sway and yaw displacements. However, the significantly lower cost and equipment required by the Flume Tank tests justified the reduced data set, and demonstrated the economic scale of using this facility and testing apparatus.
Figure 23: Vehicle Resistance Measured in Flume Tank Resistance Tests
VIII. SELFPROPULSIONTESTS
In conjunction with flume tank testing, a set of self propulsion tests were performed. This involved placing the unencumbered vehicle in the flume tank, setting the flume speed to a number of pre-selected fixed values, and varying RPM of the thrusters until a “steady state” vehicle position was reached. Once the vehicle position was fixed, input power and RPM of the thrusters were measured.
The purpose of this test was a complete and final qualification and measurement of propulsion system performance.
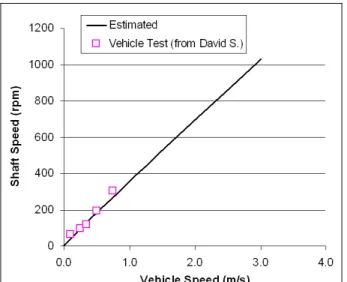
The resulting data is presented as an RPM versus speed (m/s) graph, shown in Figure 24. As can be seen, the data agreed with theoretical predictions based on scale model drag tests and propeller cavitation tunnel experiments.
A self-propulsion test was ideal because it accurately evaluated the real-world performance of a fully appended vehicle in flow speeds up to 1.0 m/s. The only notable short-coming was the tether that was connected to the vehicle in order to get full bandwidth real-time data. This added unnecessary drag to the vehicle, and thus real-world performance of the untethered vehicle would actually be slightly better than that presented. [14]
Figure 24: Self Propulsion Test Results and Estimations
IX. CONCLUSIONSANDRECOMMENDATIONS Throughout the design and development of the SQX-500 AUV, several sets of hydrodynamic characterization and testing were performed. The results from these tests varied significantly in quality, accuracy and cost. While all resulting test data was ultimately useful, and has greatly furthered development of the prototype vehicle, several tests produced redundant data sets, and in some cases later test results superseded or invalidated previous data.
Figure 25 below shows a comparison of test data from initial design estimates, scale model tests, and full scale resistance tests [14]. As can be seen, the theoretical or measured drag increased significantly with each test. While an increase was expected, the degree of increase was unknown. The results from these tests have shown that accurate initial estimates are critical in the design process, the effect of appendages on an underwater vehicle can be significant and must be taken into account, and as a vehicle design evolves, initial drag estimates quickly become invalid.
Figure 25: Comparison of Vehicle Resistance Test Data
A comparison of the cost and validity of results in each test was also performed, in order to determine what level of testing
should be required on future designs. Firstly, it was shown that theoretical propeller performance closely matches real-world performance, thus propeller characterization is not a critical requirement in future designs. Secondly, it was shown that lower-cost resistance tests with single-point load cells provide sufficient data for performance estimates, however in order to develop a full hydrodynamic model, 6DOF testing is required. Finally, it was shown that in most cases, actual drag tends to be higher than theoretical, due to the effects of accumulation of drag from seemingly insignificant sources such as such as antenna fairings, lifting hooks, unexpected protuberances etc. As a result, propulsion systems should be sufficiently overpowered to compensate, or desired performance specifications must be lowered.
It is recommended that the results of these tests be compiled into a comprehensive database detailing the types of testing performed, the cost, and the resulting quality of data expected. This would greatly assist future researchers in deciding which tests are necessary. In addition, it is recommended that a full hydrodynamic model of the SQX-500 AUV be produced based on this data [15]. Simulation of such a model should be compared with real-world vehicle performance, effectively “closing the loop” between theoretical calculations and real-world results.
REFERENCES
[1] D. Shea, N. Riggs, C. D. Williams, R. Bachmayer, “Prototype Development of the SQX-1 Autonomous Underwater Vehicle”, OCEANS ‘09 IEEE Bremen Conference, Bremen, Germany, May, 2009.
[2] D. Shea, N. Riggs, R. Bachmayer, C. D. Williams, “Preliminary Testing of the SQX-1 Autonomous Underwater Vehicle”, UUST 2009, Durham, New Hampshire, USA, August, 2010
[3] C.D.Williams, T.L.Curtis, J.M.Doucet, M.T.Issac and F.Azarsina, “Effects of Hull Length on the Hydrodynamic Loads on a Slender Underwater Vehicle during Manoeuvres”, OCEANS ’06 MTS/IEEE Conference, Boston, MA, USA, May 2006
[4] C.D. Williams, “Summary Marport Vehicle Drag Forces”, Personal Communications, May 31, 2007
[5] M.He, C.D.Williams, B.Butt and A.Clarke, "Hydrodynamic Model Tests for Marport Vehicle SQX-500", NRC-IOT report TR-2009-29, October 2009. Protected.
[6] P. Crocker, “100W Propeller FEA”, Marport Canada Inc, Technical Report, July 31, 2009
[7] M.He, C.D.Williams, T.House and D.Sparkes, "Propeller Testing and Power Estimation for Marport Vehicle SQX-500", NRC-IOT report TR-2010-08, April 2010. Protected
[8] S. Holmes, “SQX-500 UUV Thruster Dynamometer Test”, Marport Canada Inc, Technical Report, June 10, 2010
[9] P. Usanakornkul, D. Schoonhoven, “SQX-500 UUV Thruster Performance Test”, Marport Canada Inc, Internal Document, 21 April, 2010
[10] Dana R. Yoerger, Albert M. Bradley, Barrie B. Walden, "The Autonomous Benthic Explorer (ABE): An AUV Optimized for Deep Seafloor Studies," in Proceedings of the 7th International Symposium on Unmanned Untethered Submersible Technology, Durham, NH, 1991.
[11] Singh, H, Can, A., Eustice, R., Lerner, S., McPhee, N., Pizarro, O., Roman, C., “Seabed AUV Offers New Platform for High-Resolution Imaging”, EOS, Transactions of the AGU, vol 85, no 31, pp 289,294-295, August, 2004
[12] C.D. Williams, D.C. Seo, M. He, D. Shea, “Preliminary Roll and Pitch Damping Analysis for the SQX-500 AUV”, December 17, 2009
[13] M. He, “Resistance Test Result of SQX-500 in MI Flume Tank”, Personal Communication, June 1, 2010
[14] M. He, “Comparisons on Resistance of SQX-500”, Personal Communication, June 1, 2010
[15] M.He and C.D.Williams, "A Simple Method for Hydrodynamic Prediction of the Manoeuvring Performance of a Twin-Pod Vehicle", proceedings of the 29th American Towing Tank Conference (ATTC), Annapolis, Maryland, USA, 11 to 13 August, 2010.