Publisher’s version / Version de l'éditeur:
Vous avez des questions? Nous pouvons vous aider. Pour communiquer directement avec un auteur, consultez la
première page de la revue dans laquelle son article a été publié afin de trouver ses coordonnées. Si vous n’arrivez pas à les repérer, communiquez avec nous à PublicationsArchive-ArchivesPublications@nrc-cnrc.gc.ca.
Questions? Contact the NRC Publications Archive team at
PublicationsArchive-ArchivesPublications@nrc-cnrc.gc.ca. If you wish to email the authors directly, please see the first page of the publication for their contact information.
https://publications-cnrc.canada.ca/fra/droits
L’accès à ce site Web et l’utilisation de son contenu sont assujettis aux conditions présentées dans le site LISEZ CES CONDITIONS ATTENTIVEMENT AVANT D’UTILISER CE SITE WEB.
Combustion Conference - 2005 Spring Technical Meeting [Proceedings], pp. 1-7, 2005-05-01
READ THESE TERMS AND CONDITIONS CAREFULLY BEFORE USING THIS WEBSITE. https://nrc-publications.canada.ca/eng/copyright
NRC Publications Archive Record / Notice des Archives des publications du CNRC :
https://nrc-publications.canada.ca/eng/view/object/?id=ddd14015-d37f-46b1-b173-2d8fa9d29684 https://publications-cnrc.canada.ca/fra/voir/objet/?id=ddd14015-d37f-46b1-b173-2d8fa9d29684
NRC Publications Archive
Archives des publications du CNRC
This publication could be one of several versions: author’s original, accepted manuscript or the publisher’s version. / La version de cette publication peut être l’une des suivantes : la version prépublication de l’auteur, la version acceptée du manuscrit ou la version de l’éditeur.
Access and use of this website and the material on it are subject to the Terms and Conditions set forth at Comparison of heat release rate from experiments against numerical predictions and evaluation of life safety in residential houses
Comparison of heat release rate from experiments against numerical predictions and evaluation of life
safety in residential houses
Bounagui, A.; Bénichou, N.; Bwalya, A.
NRCC-47714
A version of this document is published in / Une version de ce document se trouve dans : Combustion Conference – 2005 Spring Technical Meeting, Halifax, N.S.,
May 15-18, 2005, pp. 1-7
Comparison of heat release rate from experiments against numerical
predictions and evaluation of life safety in residential houses
A. Bounagui, N. Bénichou, A. Bwalya
Institute for Research in Construction, National Research Council Canada Ottawa, ON, K1A 0R6, Canada
Email: abderrazzaq.bounagui@nrc-cnrc.gc.c
ABSTRACT
In this paper we investigate the ability of the Fire Dynamics Simulator (FDS), a Computational Fluid dynamics (CFD) fire model, to predict the heat release rate of polyurethane foam and the resulting spread of products of combustion in a residential building. The results from FDS are compared with data from open-air fire experiments conducted using two sections of a sofa mock-up, which were constructed entirely out of polyurethane foam. The burning rate of a sofa is characterized as a fast growing fire.
We also present the results of a simulation using the FDS of a fast growing fire in a room on the first storey of a three-storey house. The numerical simulation of the fire in the three-storey house indicated that the opening of the stairwell doors allows toxic gases in the form of CO2 and CO to
move to the upper floor. This contaminated the upper floors and rendered them life threatening to the occupants.
INTRODUCTION
Many fatal residential fires begin with upholstered furniture as the initial burning item. The predominant combustible constituent of this furniture is flexible polyurethane foam, which is highly flammable and produces large quantities of toxic gases, e.g. carbon dioxide (CO2); carbon
monoxide (CO); and hydrogen cyanide (HCN), and vision obscuring smoke. Once ignited at a single spot, the combustion process progresses by the spread of flames on the exposed surfaces, the rate of which is controlled by parameters such as the flammability of the materials, orientation of the surfaces and intensity of radiation feedback from the developing plume of fire to the areas ahead of the flame fronts. Toxic products of combustion are the primary cause of incapacitation and, if exposure is prolonged it will result in the death of fire victims some of who may be remote from the source of the fire. Smoke aggravates the situation by its adverse effect on egress, due to reduced visibility, and respiration. In this light, the ability to predict the characteristics—fire growth rate, fire size and products of combustion—of fires involving upholstered furniture is essential in evaluating many aspects of fire safety in residential buildings.
The heat release rate (HRR) is the principal measure of fire size. It controls the time evolution of temperature and products of combustion in the fire environment (room of fire origin and all interconnected spaces). In this paper we investigate the ability of a Computational Fluid Dynamics (CFD) fire model, Fire Dynamics Simulator (FDS) [1,2], to predict the heat release rate of polyurethane foam and the spread of products of combustion in a residential building. Demonstrated to predict thermal conditions resulting from a fire in an enclosure with an accuracy that is within 5% to 20 % of experimental measurements [1], FDS employs the large eddy simulation (LES) technique [1] to compute the gas density, velocity, temperature, pressure and species concentrations in each control volume. The mixture fraction model used in FDS assumes a mixing controlled combustion process with an infinitely fast rate of reaction between the reactants (fuel and oxygen) [2].
The results from FDS are compared with data from two open-air (free burning) fire experiments conducted at the National Research Council of Canada using a one-third and a two-thirds section of a full-size sofa mock-up, which were constructed entirely out of polyurethane foam. Results of the FDS simulation of the sofa fire (represented by a fast T-squared fire) burning in a room located on the first storey of a three-storey house are presented. The objective of this fire simulation was to determine visibility conditions and the effect of two products of combustion, CO2 and CO, on occupant tenability in the house.
FIRE EXPERIMENTS
The fire experiments were conducted using a calorimeter designed for measuring the rate of heat release and smoke obscuration. The basic elements of the calorimeter are a 3900 mm x 3640 mm hood, which is 2350 mm above the ground, and a 558 mm diameter exhaust duct and fan assembly. Measurements of mass flow rate, gas temperature and concentrations of oxygen, carbon dioxide and carbon monoxide were taken in the hood exhaust duct to facilitate calculation of the heat release rate by using an oxygen consumption method [3]. Additional measurements taken were: mass loss (using a weighing scale) and smoke density in the exhaust duct (using a pulsed white light meter). The test specimens, a one-third and a two-thirds section of a full-size sofa mock-up, were placed one at a time on a weighing scale directly under the hood and ignited with a 19 kW propane burner [4] measuring 250 mm by 250 mm. The specimens were constructed with 610 mm x 610 mm x 10 mm seat cushions and 610 mm x 610 mm x 15 mm upright backrest cushions and weighed 3 kg (one-third section) and 6 kg (two-thirds section). The propane burner was positioned 25 mm above the seat cushion and the combustion occurred under unrestricted ventilation (open burning) conditions. The density of the foam cushions was approximately 33 kg/m3.
FIRE MODELLING
In the FDS simulations of the fire experiments, the specified ignition source was a 19 kW
propane burner measuring 200 mm wide by 200 mm long. Figure 1 shows the FDS illustration of the two specimens of a mock-up sofa, with a fire plume developing on the two-thirds mock-up. Polyurethane was specified as the fuel in the model and the combustion stoichiometric
One-Third
Two-Thirds
Figure 1. FDS illustration of the one and two thirds sofa mock-ups.
Figures 2 and 3 present the comparison of the calculated and measured heat release rate profiles for the one-third and two-thirds sofas, respectively. For the one-third sofa, the model predicts a more rapid fire growth rate than the experiment results and yet tracks quite well the decay of the fire. The FDS under-predicts the maximum heat release rate by about 200 kW.
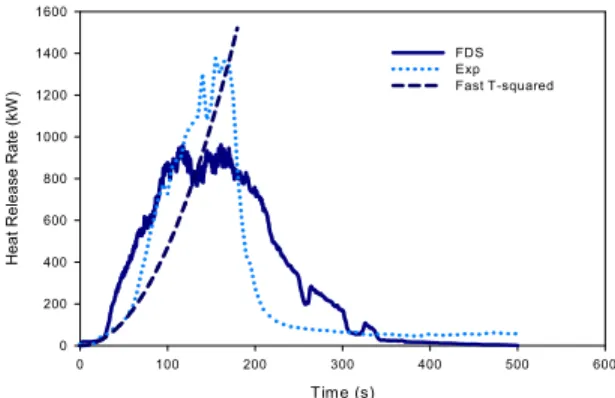
For the two-thirds sofa, FDS predicts the growth of the fire very well and the results compare favourably with the experimental results. However, as in the previous case, the peak heat release rate is under-predicted by about 400 kW.
Although FDS under-predicts the peak heat release rate, the overall shape of the heat release rate curve is predicted quite well. The failure of FDS to predict the peak heat release rate could be due to an inaccurate representation of the thermal boundary conditions and the pyrolysis process for polyurethane, and compounded by the difficulty to obtain some accurate key thermo-physical properties for this material.
Tim e (s) 0 100 200 300 400 500 600 H e at R e le ase r a te (kW ) 0 200 400 600 800 FDS Exp F ast T -squared
Figure 2. Heat release rate for one third sofa
Time (s) 0 100 200 300 400 500 600 Hea t Relea s e Rate ( k W ) 0 200 400 600 800 1000 1200 1400 1600 FDS Exp Fast T-squared
The measured and calculated fire growth rates are both consistent with those calculated from simplified fire growth correlations, which are qualitatively described as either fast- or ultra-fast. These correlations are widely used in the field of fire safety engineering and are knows as “T-squared fires” [3] because the heat release rate is assumed to be proportional to the square of the time from ignition. A T-squared fire growth is given by Equation (1); different fire growth coefficients (proportionality constants) are used to give ultra-fast, fast, and medium fire growth classifications.
The fire growth constant can be determined from either experimental data or computer models.
(1)
.
2 .
Q = αt
Where Q is Heat release rate (kW) and .
α (kW/s2) is the fire growth coefficient (equal to 0.047 for fast growth)
For T-squared fires, with an item burning in the open, the fire growth continues unabated until either the fuel is completely consumed or the heat release rate reaches a peak value. The growth phase in the experiments match a fast T-squared fire and, therefore, this approximation would be appropriate for simulating a fire in a house.
FIRE SIMULATION IN A THREE STOREY HOUSE
This section presents the simulation results of a fast growing fire occurring in the first storey of a three-storey house to evaluate life safety in residential buildings. A fire scenario represents a combination of the outcomes and event associated with geometry, ventilation, state of the opening, fire specification, fire location and fire size. The fire simulation is based on the following fire scenario:
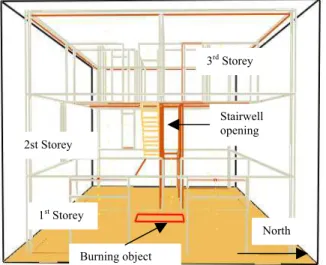
Geometry: A full-scale test facility that represents a single-family house. Figure 4 shows a perspective view of a three-storey house. The three levels of the facility are enclosed within a 10.7 m x 9.1 m x 7.5 m tall rectangular volume with the first-storey divided into two compartments and the second-storey represents a modern home with an open concept layout. The third-storey has 4 bedrooms, two bedrooms with doors open and two
bedrooms with doors closed.
Fire: The fire originates in one of the compartments on the first-storey of the house where the fire source was approximated as a rectangular object, 1 m wide and 2 m long, with a specified heat release rate located in the middle of the south section of the
compartment. In the model using polyurethane as the specified fuel, the heat release rate of the fire is assumed to follow a fast T-squared growth, reaching a peak of
approximately 3000 kW in 253 s. Ventilation openings:
− Two windows, each approximately 2.0 m wide x 0.5 m high, open to the outside of
the structure and are located in the first-storey (FS) of the facility. The windows open when they reach a temperature of 300 °C to simulate the breakage of the glass in the windows.
− A stairway opening from the first-storey to the second storey (SS) represents an open door between the FS and SS.
− The main door opening to the outside of the structure, approximately 0.9 m wide x 2.1 m high, is located in the second storey of the facility. This door opens at 180 s to simulate the occupants evacuating the house after 3 min.
− Second stairway opening from the second-storey to the third storey (TS) to represent an open door between the SS and TS.
The ceilings and floors of the facility are composed of steel and gypsum board and the walls are composed of gypsum board. Thermal properties of these materials are taken from the FDS database.
Based on a previous study of grid resolutions [6] the facility geometric domain was divided into a uniform grid using a (100 mm x 100 mm x 100 mm) grid distribution.
Figure 4. Perspective view of the facility
Time (s) 0 100 200 300 400 500 600 CO2 Conc entrations ( m ol/m ol) 0.00 0.02 0.04 0.06 0.08 0.10 0.12 0.14 0.16 0.18 FSNW SSNW Bedroom 3 Coridoor CO2 Bedroom 1 Tenability limit
Figure 5. CO concentrations at a height 1.5 m above floors 3rd Storey Stairwell opening 2st Storey 1st Storey Burning object North SIMULATION RESULTS
The occupant tenability limits inside a house involved in a fire should not be exceeded before the occupants evacuate the house. To evaluate life safety in a house, tenability criteria are needed. Table 1 lists tenability limits in terms of toxicity and visibility as suggested in reference [7].
Criterion Tenability limit
Toxicity CO ≤ 1400 ppm
CO2≤ 5 %
Smoke obscuration Visibility in the relevant layer should not fall below 2 m.
The visibility and concentrations of CO and CO2 were calculated at a height of 1.5 m on the first
and second-storeys, in the bedrooms on the third-storey, and in the corridor leading from the third- storeys. This height represents the nose-height of an average adult and provides a good indication of the effect of gases on the occupants.
Figure 5 indicates the prediction of CO2 concentrations vs. time in the first-storey and
second-storey north-west quarter point, corridor and bedrooms 1 and 3 of the third-second-storey. As shown in Figure 5 there is a harmful amount of the CO2 present on the second and third storeys. The
presence of such a high concentration of CO2 demonstrates that the stairwell opening is very
effective in conveying smoke from the first-storey to the second-storey.
Figure 5 also indicates that the situation in the second-storey (SS), which is the main path for escape, becomes life-threatening at about 300 s from the start of the simulation as the CO2
concentrations reach and exceed the tenability limit of 0.05 mol/mol. A considerable amount of toxic gases accumulates rapidly in the second storey and third storeys.
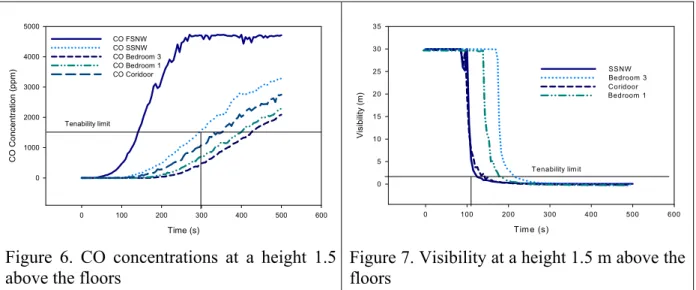
Figure 6 displays the predictions of CO concentrations vs. time for the first-storey and second storey north-west quarter point, corridor and bedrooms 1 and 3 of the third-storey. The figure indicates that the stairwell opening has a large impact on the safety of the occupants because it conveys toxic gases to the upper floors. Also figure 6 shows that the CO concentration on the second storey reaches the tenability limit of 1400 ppm at about 300 s and the third storey at 340 s from the start of the simulation.
Figure 7 indicates the predictions of visibility vs. time for the first-storey and second storey north-west quarter point, corridor, bedrooms 1, 3 of the third-storey. The figure shows that the visibility decreases much more rapidly than does the increase of gas concentrations in the second and third storeys. In Bedroom 3 the visibility limit of 2 m is reached at 200 s, whereas it took over 400 s to reach the CO limit of 1400 ppm. The diminished visibility in the first and second storeys indicates that the stairwell opening is very effective in conveying smoke to the upper storeys. As can be seen in Figure 7, the visibility in the second storey becomes poor after 120 s from ignition. Time (s) 0 100 200 300 400 500 600 C O C onc en tr at ion (ppm) 0 1000 2000 3000 4000 5000 CO FSNW CO SSNW CO Bedroom 3 CO Bedroom 1 CO Coridoor Tenability limit
Figure 6. CO concentrations at a height 1.5 above the floors
Tim e (s) 0 100 200 300 400 500 600 V isib ilit y (m ) 0 5 10 15 20 25 30 35 SSNW Bedroom 3 Coridoor Bedroom 1 T enability lim it
Figure 7. Visibility at a height 1.5 m above the floors
CONCLUSION
In this paper we compared the heat release rate predicted by the FDS model with that obtained from experimental data. It was found that the model under-predicted the peak heat release rate of polyurethane foam but predicted the growth and the decay of the fire reasonably well. The comparison also shows that the growth rates obtained from both experiments and the model are consistent with the fast growth represented by the T-squared fire (the most common representation of the fire growth).
The numerical simulation of a fast growing fire on the first-storey of a three-storey house indicated that the stairwell openings conveyed significant quantities of toxic gases (CO2 and CO)
to the upper floors. These toxic gases rapidly contaminated the upper floors and rendered them life threatening to the occupants. Based on the adopted tenability limits, the simulation results predicted that untenable conditions for CO2 and CO were reached at about 300 s in the second-
storey. The untenable conditions for visibility criteria were reached after 120 s in the second- storey and after 140 s in the third storey.
Future Work
Future efforts will focus on investigating the failure of the FDS model to accurately predict the peak heat release rate of burning polyurethane foam. In addition, results from the FDS simulation of a house fire will be verified against data from a series of fire experiments, which are being conducted in a three-storey house structure by the Fire Research Program at the National Research Council Canada.
REFERENCES
1. McGrattan, Kevin B., Baum, Howard R., Rehm, Ronald G., Hamins, Anthony, Forney,
Glenn P., Fire Dynamics Simulator – Technical Reference Guide, National Institute of
Standards and Technology, Gaithersburg, MD., NISTIR 6467, January 2000.
2. McGrattan, Kevin B., Forney, Glenn P., Fire Dynamics Simulator – User’s Manual, National Institute of Standards and Technology, Gaithersburg, MD., NISTIR 6469, January 2000. 3. Janssens, M. L., August, 1991. Measuring Rate of Heat Release. Fire Technology , pp.
234-235
4. American Society for Testing and Materials, 2002. ASTM E1537-02a: Standard Test Method for Fire Testing of Upholstered Furniture. PA, USA
5. National Fire Protection Association, “NFPA 92B: Smoke Management Systems in Malls,
Atria, and large Areas”, Quincy, MA, USA, (2000)
6. A. Bounagui, N. Benichou, C. McCartney and A. Kashef. “Optimizing the Grid Size Used in
CFD Simulations to Evaluate Fire Safety in Houses”, 3rd NRC CFD Symposium on
Computational Fluid Dynamics, High Performance Computing and Virtual Reality, Ottawa, December 4, 2003.
7. A. H. Buchanan, Fire Engineering Design Guide, Center for Advanced Engineering, University of Canterbury, New Zealand, 1994.