Olivier Dumortier,
1Estelle Roger,
1Didier F. Pisani,
2Virginie Casamento,
1Nadine Gautier,
1Patricia Lebrun,
1Hereroa Johnston,
1Pascal Lopez,
1Ez-Zoubir Amri,
2Céline Jousse,
3Pierre Fafournoux,
3Marc Prentki,
4Charlotte Hinault,
5and Emmanuel Van Obberghen
5Age-Dependent Control of Energy
Homeostasis by Brown Adipose Tissue
in Progeny Subjected to Maternal
Diet
–Induced Fetal Programming
Diabetes 2017;66:627–639 | DOI: 10.2337/db16-0956
Epidemiological and animal studies show that deleterious maternal environments predispose aging offspring to met-abolic disorders and type 2 diabetes. Young progenies in a rat model of maternal low-protein (LP) diet are normogly-cemic despite collapsed insulin secretion. However, without further worsening of the insulin secretion defect, glucose homeostasis deteriorates in aging LP descendants. Here we report that normoglycemic and insulinopenic 3-month-old LP progeny shows increased body temperature and energy dissipation in association with enhanced brown adipose tissue (BAT) activity. In addition, it is protected against a cold challenge and high-fat diet (HFD)–induced obesity with associated insulin resistance and hyperglycemia. Surgical BAT ablation in 3-month-old LP offspring normalizes body temperature and causes postprandial hyperglycemia. At 10 months, BAT activity declines in LP progeny with the appearance of reduced protection to HFD-induced obesity; at 18 months, LP progeny displays a BAT activity compara-ble to control offspring and insulin resistance and hypergly-cemia occur. Together ourfindings identify BAT as a decisive physiological determinant of the onset of meta-bolic dysregulation in offspring predisposed to altered b-cell function and hyperglycemia and place it as a critical regulator of fetal programming of adult metabolic disease.
Although in postnatal life sedentary lifestyle and over-feeding contribute to the pandemic of metabolic disorders
and associated type 2 diabetes (T2D), environmental factors acting early in life have emerged as additional influential actors in long-term health (1–3). Indeed, epidemiological studies have established that offspring with low birth weight due to deleterious maternal environment, when faced with a nutritional mismatch in postnatal life, have an increased propensity to develop impaired glucose tolerance and T2D with age (4,5). Several animal models, including maternal protein restriction, have been generated to study the impact of the prenatal milieu on the risk of metabolic diseases in adult age (6). The progenies of these models suffer from intrauterine growth retardation and display profound alter-ations in organs that play a major role in metabolism, such as the pancreas and the liver (7–9).
An intriguing observation of the maternal protein re-striction model is that when the low-protein (LP) diet is given throughout gestation and lactation, a phenotype arises with two distinct phases. The young LP progeny is normoglycemic and only glucose intolerant despite a severely reducedb-cell mass and low insulin secretion (7,8,10–13). However, with aging, insulin resistance and moderate hyperglycemia develop (14,15). Remarkably, in young LP progeny, normoglycemia is maintained due to metabolic adaptation, allowing fuel ho-meostasis. It stands to reason that the chief energy burner, brown adipose tissue (BAT), could be involved in the age-related changes of the metabolic profile of LP progeny. The precise role of the environment-sensitive BAT in impaired
1Université Côte d’Azur, INSERM, CNRS, IRCAN, Nice, France 2Université Côte d’Azur, CNRS, INSERM, iBV, Nice, France 3Université Clermont, INRA, Clermont-Ferrand, France
4CRCHUM and Montreal Diabetes Research Center and Departments of Nutrition and Biochemistry and Molecular Medicine, University of Montreal, Montreal, Quebec, Canada
5Université Côte d’Azur, CHU, INSERM, CNRS, IRCAN, Nice, France
Corresponding authors: Charlotte Hinault, hinault@unice.fr, and Emmanuel Van Obberghen, vanobbeg@unice.fr.
Received 5 August 2016 and accepted 27 November 2016. This article contains Supplementary Data online at http://diabetes .diabetesjournals.org/lookup/suppl/doi:10.2337/db16-0956/-/DC1. C.H. and E.V.O. are co–senior authors.
© 2017 by the American Diabetes Association. Readers may use this article as long as the work is properly cited, the use is educational and not for profit, and the work is not altered. More information is available at http://www.diabetesjournals .org/content/license.
metabolic homeostasis and diabetes remains to be deci-phered. A chief feature of BAT is that, in contrast to white adipose tissue (WAT), which stores excess lipids, BAT dis-sipates energy in the form of heat (thermogenesis) by uncoupling mitochondrial electron transport chain activity from ATP formation (16,17). This is achieved through uncoupling protein-1 (UCP-1), which allows highly efficient glucose and lipid oxidation and heat production. In hu-mans and other mammals, BAT development occurs pre-dominantly at the end of gestation and the tissue becomes fully functional at birth (18). With age, BAT remains pre-sent but its activity decreases (16,19,20). Cold-activated BAT has been shown to contribute to the regulation of energy balance in mice by burning a considerable amount of ingested triglycerides and glucose (21,22). Further, transplantation of active BAT in mice has beneficial effects on the control of body composition and metabolism, and results in a reversal of high-fat diet (HFD)–induced insulin resistance (23). Importantly, several recent studies in hu-mans have found that BAT activation by cold acclimation improves insulin sensitivity in obese patients and patients with T2D, suggesting that BAT is a promising novel treat-ment of obesity and associated disorders (24–26).
Our previous work contributed to decoding the molec-ular mechanisms induced by intrauterine protein restric-tion leading tob-cell failure in LP progeny (12). Here we sought to understand how 3-month-old LP progeny pro-grammed to develop deficient insulin secretion is able to maintain normoglycemia. We hypothesized that at this age, characterized by normal insulin sensitivity, glucose homeo-stasis is preserved by increased BAT activity. To test for such a role of BAT, we delved into the metabolism of LP progeny until the appearance of insulin resistance and in-creased glycemia. Our work reveals a new dimension for the role of BAT in energy metabolism, as it appears to be involved in the adaptive response in young animals and the failure with aging to maintain glucose homeostasis after fetal programming of prediabetes.
RESEARCH DESIGN AND METHODS
Animals and Diets
Pregnant 200–250-g Wistar rats (Janvier, Le Genest Saint Isle, France) were fed during gestation and lactation with a control (C) diet (20% [weight for weight] protein) or an isocaloric LP diet (8% [weight for weight] protein) (Hope Farm, Woerden, the Netherlands) (27). After weaning at 4 weeks, male offspring were fed ad libitum with a standard diet (SD) or HFD during either 8 or 40 weeks (Western diet, 42% calories from fat/43% from carbohydrate; Research Diets). At least six rats from three different litters were studied in each group and results confirmed in three in-dependent cohorts. Animals were housed two per cage and subjected to a 12-h light/dark cycle at 22–23°C, which is close to rat thermoneutrality (28). Body temperature was recorded with a digital thermometer. Body length was mea-sured from nose tip to tail base (last hairs). Body surface area was calculated as previously described (29). Blood was
collected from tail veins before anesthesia. WAT was removed around the epididymis (eWAT) and subcutaneously (scWAT); interscapular BAT (iBAT) was collected from the interscapular region and separated from attached WAT. All procedures followed INSERM guidelines and were approved by the Research Ministry (MESR 00825 and APAFIS 3897-2016012217578333) and local ethics committee (CNREEA no. 28).
Surgical iBAT Ablation
BAT was removed from the interscapular region of 3-month-old C and LP progenies as previously described (30). We performed the same procedure for the sham-operated group except that no iBAT was removed. Fast and refed experiments were performed at days 6 and 14 postsurgery. Fed glycemia was measured before overnight fasting and before and 1 h after ad libitum refeeding. Data were expressed as percentage of fed glycemia.
Metabolic Assays
For oral glucose tolerance test (OGTT) and glucose-stimulated insulin secretion (GSIS), C and LP progenies were given an oral glucose bolus (2 g) after an overnight fast. For insulin tolerance test (ITT), rats were starved for 6 h and injected intraperitoneally with 1 unit/kg (,10 months) and 0.75 units/kg ($10 months) of insulin. Blood was collected from the tail vein at different times. Glycemia was mea-sured using the OneTouch glucometer (Lifescan Inc., Milpitas, CA). Circulating levels of insulin, leptin, T3, and FGF21 were measured with ELISA kits from Mercodia (Uppsala, Sweden), Linco (St Charles, MO), Alpha Diagnos-tic International (San Antonio, TX), and BioVendor (Brno, Czech Republic), respectively. Total cholesterol and triglyc-erides were measured in serum and catecholamines in 24-h urine samples by the Clinical Chemistry Department (Uni-versity Hospital, Nice, France).
Indirect calorimetry was performed in the INRA animal facility of Clermont-Ferrand Theix on progenies after 3 weeks of adaptation to the local environment maintained at 22–23°C as previously described (31). Lean and fat mass were quantified using a SkyScan-1178 X-ray microcom-puted tomography system. After anesthesia, rats were scanned as previously described (32).
To measure cold-induced thermogenesis, rats were placed in individual cages at 4°C. Rectal temperature was moni-tored before and every 2 h during cold exposure of 6 h.
Immunohistochemical and Morphological Analysis
After overnight fixation in a 3.7% (weight for volume) formalin solution, tissues were dehydrated and embedded in paraffin for immunohistochemistry (IHC) of UCP-1 (Santa Cruz, Dallas, TX) and perilipin-1 (Acris Antibodies, Herford, Germany) or for hematoxylin-eosin staining to assess morphology. Tissues were sectioned (5 mm) and immunostained as previously described (12).
Lipolysis and Triglyceride Content Measurement
Minced BAT (50 mg) from fed animals was placed in DMEM containing 1% (weight for volume) FBS. After 1 h,
the medium was replaced without or with isoproterenol (1mmol/L) and collected 2 h later for glycerol measure-ments (Sigma-Aldrich, St. Louis, MO). Triglyceride con-tent was assessed on 50 mg of BAT tissue powder using a Sigma-Aldrich kit.
RNA Extraction and RT-qPCR
RNA from BAT was isolated with TRIzol reagent (Invitro-gen) using a Precellys homogenizer (Ozyme, St. Quentin, France). Total RNA (1 mg) was reverse transcribed and analyzed with SYBR Green (ABI PRISM 7000 Sequence De-tector System). The cDNA amount used in each reaction was normalized to the housekeeping gene 36B4. The pri-mers and qPCR assay conditions are available upon request.
Protein Extraction and Western Blotting
BAT was processed for protein extraction and Western blotting as previously described (33). Antibody to UCP-1 was from Calbiochem (Merck KGA, Darmstadt, Germany), to tubulin from Sigma-Aldrich, and to p85 from Millipore (Billerica, Massachusetts). Western blots were quantified by densitometry with ImageQuant software.
Statistical Analysis
Results shown are means6 SEM; n represents the number of rats from different litters. Studentt test was used to compare two conditions (unpaired), and two-way ANOVA test fol-lowed by post hoc Fisher test when more than two conditions were analyzed. A P value of ,0.05 was considered to be significant and annotated with an asterisk in the figures. RESULTS
Despite Reduced Insulin Secretion, Young LP Progeny Is Normoglycemic and Has Increased Energy
Expenditure
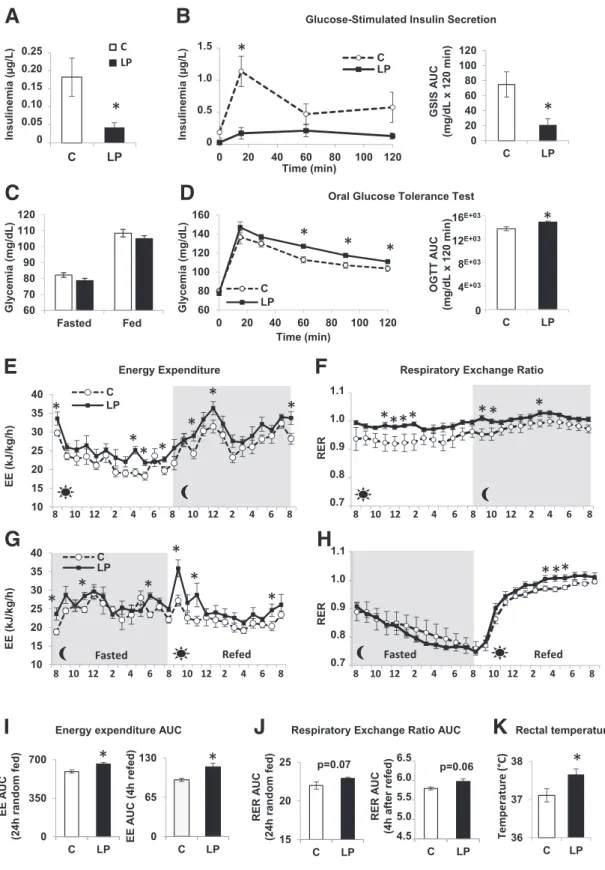
As expected, 3-month-old LP progeny showed low fasting insulinemia with normoglycemia and markedly reduced GSIS during an OGTT compared with C (Fig. 1A–C). How-ever, the LP descendants were moderately glucose intoler-ant (Fig. 1D), which is likely due to the insulin secretion defect, as insulin sensitivity was unchanged according to the ITT (Supplementary Fig. 1).
To decrypt the paradox between the deficient insulin secretion and the normoglycemia in the face of unchanged insulin sensitivity, we analyzed the energy metabolism. Indirect calorimetry showed that energy expenditure (EE) was increased during both day and night in young LP progeny (Fig. 1E and I). This augmented EE was even more pronounced when transitioning from a fasted to a refed state, with a peak immediately after food was reintroduced (Fig. 1G and I). The LP progeny has lower body weight (BW) and length due to its intrauterine growth retardation status (8,10), but its adiposity is not different from C (Supplementary Table 1). Therefore, irrespective of the analytic procedure used, EE remains increased in LP prog-eny (Supplementary Fig. 2). The respiratory exchange ratio (RER) over 24 h was overall higher in LP progeny compared with C, with a value of ;1, reflecting preferential use of carbohydrate energy sources (Fig. 1F and J). During fasting,
this quotient decreased in both C and LP progenies to a value close to 0.7, resulting from preferential lipid consump-tion. Upon refeeding, whereas the RER of both progenies climbed to values close to 1, it was higher for LP progeny (Fig. 1H and J). In addition, at 3 months, LP offspring displayed hyperthermia (Fig. 1K). In parallel, the two groups of animals had the same food intake (Supplementary Fig. 3A) and physical activity (Supplementary Fig. 3B). Muscle weight relative to BW was similar for C and LP progenies for EDL and soleus (Supplementary Fig. 4A), and little or no difference was found in mRNA and protein levels of several metabolic andfiber type markers (Supplementary Fig. 4B–I). As a whole, the data indicate that nonshivering thermogen-esis is increased, suggesting a role of BAT in the maintaining of normoglycemia in the insulinopenic LP offspring.
BAT Is Hyperactive in Young LP Progeny
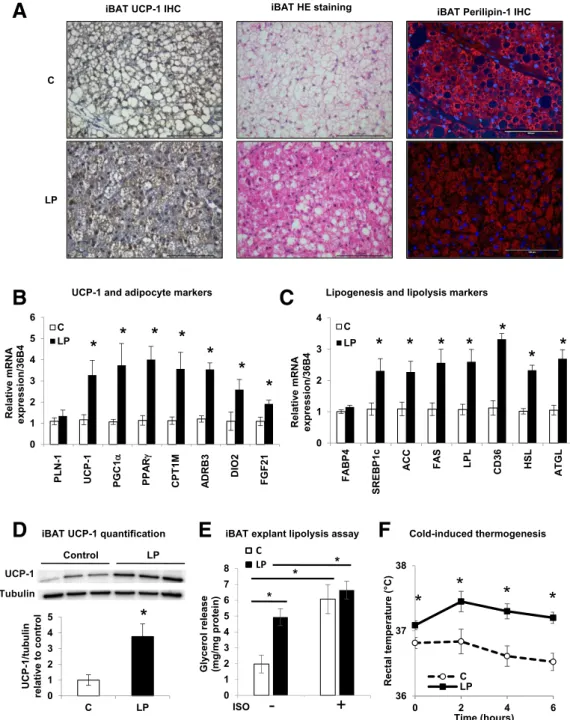
To study BAT activation in the LP descendants, we assessed the expression of the specific BAT marker UCP-1 in iBAT. UCP-1 gene and protein expression was higher in iBAT from 3-month-old LP progeny compared with C (Fig. 2A, B, and D). Consistent with this, iBAT from LP progeny presented the key characteristics of a hyperactive tissue with rare lipid droplets compared with C progeny (Fig. 2A). In addition, mRNA expression levels of key markers of BAT activation or lipid metabolism were ro-bustly augmented in iBAT of LP versus C descendants (Fig. 2B and C), suggesting an increase in lipid production and consumption by iBAT. Basal lipolysis in 3-month-old LP iBAT explants was increased compared with C, as shown by a 2.5-fold higher glycerol release (Fig. 2E), suggesting augmented intrinsic activity. This lipolysis level was com-parable to that of BAT explants from C offspring stimu-lated with the adrenergic receptor agonist isoproterenol. Further, BAT activity was evaluated in offspring during a cold challenge (Fig. 2F). The young LP progeny, which dis-played hyperthermia at thermoneutrality, increased and preserved its body temperature when challenged by cold for 6 h. This was in contrast to the C offspring, which maintained its temperature with great difficulty. Together these observations further indicate that BAT is hyperactive in 3-month-old LP progeny compared with C. This is in contrast with 21-day-old fetuses (F21) in which no obvious difference was found between C and LP fetuses, either in UCP-1 protein and mRNA expression or in iBAT morphol-ogy (Supplementary Fig. 5A and B and Supplementary Fig. 6). Interestingly, whereas UCP-1 gene expression was lower in C progeny at 3 months compared with F21, its expres-sion was enhanced in 3-month-old LP progeny compared with fetal LP (Supplementary Fig. 6). Together our data suggest that maternal protein restriction leads to a hyper-active iBAT in 3-month-old LP progeny, unlike in C descen-dants, where its activity decreases relative to F21.
Young LP Progeny Is Protected From HFD-Induced Obesity
To further examine the possibility that BAT safeguards energy homeostasis in young LP progeny, we challenged
Figure 1—Three-month-old insulin-deficient LP progeny has increased EE. Three-month-old progenies from rat dams fed during gestation and lactation with C or LP diet were used.A: Fasting insulinemia (n = 13 rats). B: GSIS performed during an OGTT after overnight fasting (n = 6 rats) with its calculated area under the curve (AUC). C: Fasted/fed glycemia (n = 26 rats). D: OGTT performed after overnight fasting (n = 13 rats) and its calculated AUC. EE (E and G) and RER (F and H) (n = 6 rats) measured during a 24-h ad libitum–fed period (E and F) and during a 12-h fast period followed by 12-h refeeding period (G and H). Gray and light zones correspond to dark and light phases, respectively. Data of EE are normalized to BW.I: AUC for EE during a 24-h random fed and a 4-h refed period from E and G. J: AUC for RER during a 24-h random fed and a 4-h refed period fromF and H. K: Rectal temperature (n = 12 rats). Data are presented as mean 6 SEM. *P < 0.05.
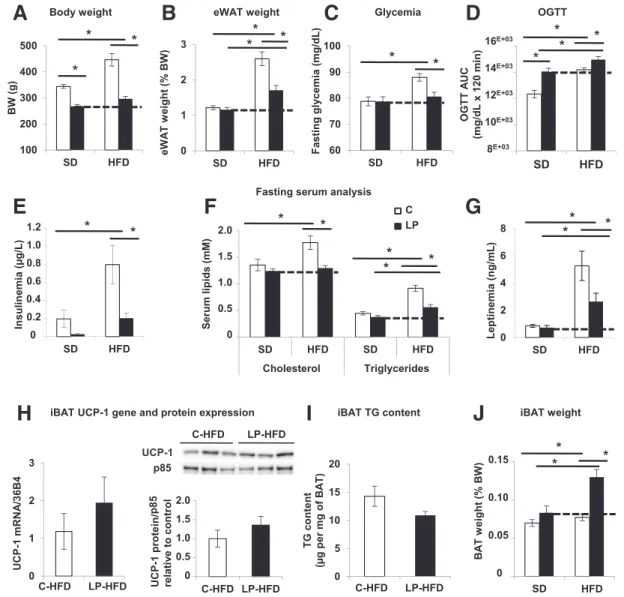
the descendants with an HFD. Compared with 3-month-old C offspring, LP rats gained little weight on HFD (Fig. 3A and B) and did not develop hyperglycemia or com-pensatory hyperinsulinemia, although they were glucose intolerant (Fig. 3C–E). Proportionally to its BW, LP prog-eny had the same food intake as C progprog-eny (Supplemen-tary Fig. 7A–C). Further, LP descendants displayed lower serum levels of cholesterol and triglycerides with lower
leptinemia (Fig. 3F and G), the latter being consistent with less eWAT (Fig. 3B). Interestingly, under HFD, BAT from LP and C progenies is morphologically active and associated with a high expression of UCP-1 with similar triglyceride contents (Supplementary Fig. 7D and Fig. 3H andI). Strikingly, only LP progeny expands its BAT weight, and this amounts to a 1.6-fold increase (relative to BW) (Fig. 3J). To sum up, under HFD, young LP progeny increases its
Figure 2—iBAT is hyperactive in 3-month-old LP progeny. A: Representative IHC of UCP-1 with hematoxylin and eosin (HE) staining of iBAT in C and LP rats (n = 6) of 3-month-old progenies. Scale bars: 100 mm. B and C: Relative mRNA expression levels of UCP-1 and markers of adipocytes, lipogenesis, and lipolysis from iBAT of C and LP rats (n = 6). Data are normalized to 36B4 gene expression and expressed as fold increase relative to C.D: Immunoblots for UCP-1 and tubulin on iBAT protein lysates and its quantification (n = 3). Data are expressed relative to C as ratios of UCP-1 and tubulin protein expression (arbitrary units).E: Glycerol release from iBAT explants after a 2-h incubation without or with 1mmol/L isoproterenol (ISO) (n = 4). Data are expressed per milligram of protein. F: Rectal temperature from C and LP progeny during 6 h at 4°C. Data are presented as mean6 SEM. *P < 0.05.
mass of BAT, which is already active, whereas C progeny solely augments its BAT activity. It is likely that this LP progeny attribute enables it to protect itself against HFD-induced obesity and associated perturbations.
Old LP Progeny With Decreased BAT Activity Becomes Insulin Resistant and Hyperglycemic
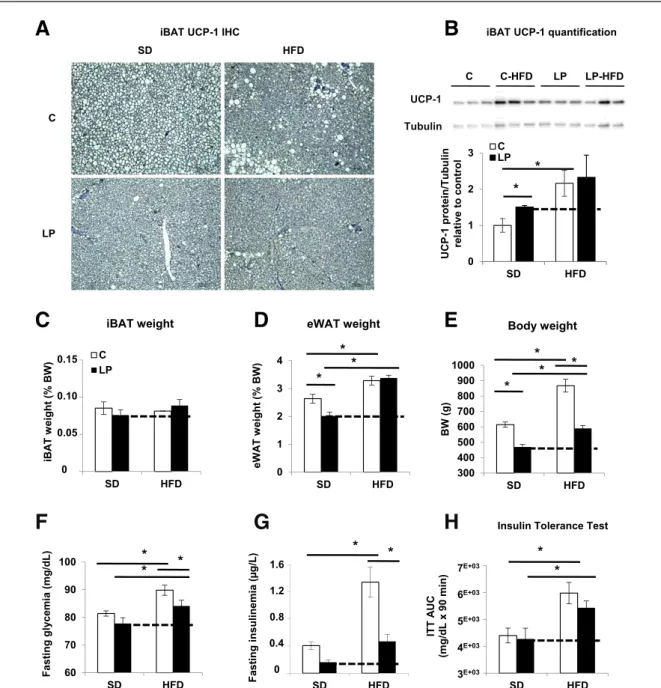
We next investigated whether the iBAT-associated pro-tection against HFD-induced obesity of young LP progeny was preserved in older animals. At 10 months of age, iBAT from LP and C progenies under HFD appeared morpho-logically active with similar levels of UCP-1 protein (Fig. 4A andB). However, iBAT mass in 10-month-old LP progeny
was equal to that of C offspring (Fig. 4C). In addition, 10-month-old HFD-LP progeny gained weight and aug-mented its eWAT (Fig. 4D and E and Supplementary Fig. 8C), reaching values seen in C-HFD progeny. Importantly, LP offspring showed a significantly increased fasting glyce-mia under HFD compared with SD (Fig. 4F). At this age, LP progeny maintained a low fasting insulinemia compared with C, independently of the diet type (Fig. 4G). Finally, the LP rats were less sensitive to insulin under HFD than under SD (Fig. 4H). Taken together, the data on HFD show that 10-month-old LP descendants, which present a waning of iBAT mass compared with 3-month-old animals, were less protected against diet-induced obesity, insulin
Figure 3—Three-month-old LP progeny is protected against HFD-induced obesity, insulin resistance, and hyperglycemia. C and LP progenies were fed starting at weaning during 8 weeks with HFD (n = 12 rats per group). A and B: BW and eWAT weight expressed as a percentage of BW (n = 12 rats). C and D: Fasting glycemia (n = 12 rats) and area under the curve (AUC) of glycemia (mg/dL) from OGTT performed after overnight fasting (n = 5 rats). E–G: Fasting serum levels of insulin, cholesterol, triglycerides, and leptin (n = 6 rats). H: mRNA expression levels of UCP-1 from iBAT of C-HFD and LP-HFD progenies (n = 6). Data are normalized to 36B4 mRNA and expressed in arbitrary units. Quantification of immunoblots for UCP-1 and p85 proteins on iBAT lysates (n = 3). Data are expressed relative to C as ratios of UCP-1 and p85 protein expression (arbitrary units).I: iBAT triglyceride contents expressed per milligram wet iBAT weight (n = 5). J: iBAT weight expressed as a percentage of BW (n = 12 rats). Data are presented as mean 6 SEM. *P < 0.05. TG, triglyceride.
resistance, and hyperglycemia than younger LP progeny. On SD, 10-month-old LP progeny remained normoglycemic (Fig. 4F), possibly due to BAT activity, which is sufficiently maintained at this age. Indeed, UCP-1 protein expression is still augmented in iBAT from LP progeny at this age (Fig. 4A andB), even though the increase was less marked at 10 than at 3 months.
At 18 months, LP descendants under SD, with still a lower BW (Fig. 5A), continued to suffer from reduced insulin secretion with low insulinemia (Fig. 5B). Nota-bly, they developed insulin resistance (Fig. 5C) and
displayed an increased glycemia in the fed state (Fig. 5D). Remarkably, in this older LP progeny under SD, the morphological characteristics of iBAT and UCP-1 protein expression and gene expression of active BAT markers were comparable to C (Supplementary Figs. 6 and 9 and Fig. 5E and F). In addition, glycerol release from iBAT explants was comparable in the 18-month-old rats from both groups under basal and isoproterenol-stimulated conditions (Fig. 5G). At this age, no difference in iBAT mass was seen in LP compared with C progeny (Fig. 5H). These converging morphological and functional
Figure 4—Ten-month-old LP progeny with waning iBAT is less protected against HFD-induced obesity. C and LP progenies were fed at weaning during 40 weeks with an HFD or SD (n = 12 rats per group). A: Representative IHC of UCP-1 in iBAT (n = 6). B: Quantification of immunoblots for UCP-1 and tubulin proteins on iBAT lysates (n = 3). Data are expressed relative to C as ratios of UCP-1 and tubulin protein expression (arbitrary units). BW (E) with iBAT and eWAT weight expressed as a percentage of BW (C and D) (n = 12 rats). F and G: Fasting glycemia and insulinemia (n = 12 rats). H: Area under the curve (AUC) of glycemia (mg/dL) from intraperitoneal ITT performed after 6 h fasting (n = 6 rats). Data are presented as mean 6 SEM. *P < 0.05.
observations indicate that with age, iBAT of LP prog-eny becomes deactivated and henceforth resem-bles iBAT of C progeny with low activity. In summary, with aging, the LP progeny presents progressively de-creased iBAT activity coupled to dysregulated glucose homeostasis.
Surgical Ablation of iBAT in Young LP Progeny Hampers Postprandial Glycemia Regulation
To directly evidence the involvement of BAT in the maintenance of metabolic homeostasis in 3-month-old LP progeny, we surgically removed the accessible BAT depot in the interscapular region, representing at most 40% of
Figure 5—With decline of iBAT activity, insulin resistance and hyperglycemia appear in 18-month-old LP progeny. A, B, and D: BW, fed insulinemia, and fasted/fed glycemia of 18-month-old progeny (n = 12 rats). C: Area under the curve (AUC) of glycemia (mg/dL) from intraperitoneal ITT performed after 6 h fasting on 15–17-month-old progeny and glycemia of 18-month-old progeny (n = 12 rats). E: Quantification of immunoblots for UCP-1 and p85 proteins on iBAT lysates (n = 3). Data are expressed relative to C as ratios of UCP-1 and p85 protein expression (arbitrary units). F: mRNA expression levels in iBAT of 18-month-old C and LP progenies (n = 6). Data are normalized to 36B4 gene expression and expressed relative to C.G: Glycerol release from iBAT explants after 2 h of incubation without or with 1mmol/L isoproterenol (ISO) (n = 3). Data are expressed per milligram of protein. H: iBAT weight expressed as a percentage of BW (n = 12 rats). Data are presented as mean 6 SEM. *P < 0.05.
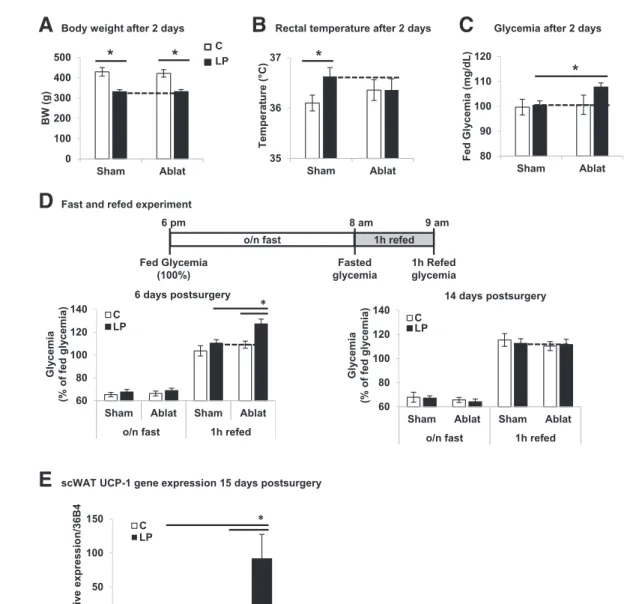
total BAT in rats (30). Two days postsurgery, the BWs of iBAT-ablated and sham-operated C and LP groups were similar (Fig. 6A). Whereas rectal temperature was significantly increased in sham-operated LP versus C rats, no difference was measured after iBAT ablation (Fig. 6B). Importantly, iBAT-ablated LP descendants presented increased fed glycemia compared with sham-operated LP offspring or C groups (Fig. 6C). To evaluate the ability of iBAT from LP progeny to regulate postprandial glucose, fasting-refeeding was performed 1 and 2 weeks postsurgery (Fig. 6D). No difference was observed in the fasting response between the four groups 1 or 2 weeks postsurgery. Remarkably, 1 week after iBAT ablation, LP descendants showed a dysregulated postprandial response 1 h after refeeding, with a glycemia higher
than that of sham-operated LP and C offspring (Fig. 6D, left panel). However, 2 weeks after surgery, per-turbed glycemia was no longer found in the LP progeny subjected to BAT ablation (Fig. 6D, right panel). At this time, partial regeneration of BAT tissue was observed without noticeable difference between C and LP proge-nies (Supplementary Fig. 10). Therefore, we measured UCP-1 gene expression in scWAT to evaluate potential browning (34,35). Whereas UCP-1 was weakly detected in scWAT from sham-operated C rats, its level was robustly increased in iBAT-ablated LP offspring 2 weeks postsurgery (Fig. 6E). Note that 1 week postsurgery, UCP-1 gene expression was comparable in the four groups (data not shown). Overall, the results show that removal of iBAT normalized body temperature in LP
Figure 6—Surgical ablation of iBAT in 3-month-old LP progeny results in dysregulated postprandial glycemia. Three-month-old C and LP progenies (n = 9/12 rats per group) were exposed to surgical removal of iBAT (Ablat) and compared with sham C and LP progenies. A–C: BW, rectal temperature, and fasted/fed glycemia 2 days postsurgery (n = 9/12 rats). D: Glycemia before and 1 h after refeeding 6 days and 14 days postsurgery (n = 9/12 rats). Data are expressed as a percentage of fed glycemia for each rat. E: UCP-1 gene expression levels in scWAT of C and LP progenies sham or Ablat (n = 6). o/n fast, overnight fast. Data are presented as mean 6 SEM. *P < 0.05.
progeny compared with C and led to dysregulation of post-prandial glycemia. This effect is reversible within 2 weeks after iBAT ablation when compensations occurred, notably through scWAT browning. These data reinforce the view that iBAT plays a key role in energy and glucose homeo-stasis of 3-month-old LP progeny.
Circulating and Intrinsic BAT Modulators Are Augmented in Young LP Progeny
To approach the mechanism by which BAT activity is enhanced in young LP progeny, we investigated the possible implication of hormones and growth factors known to participate in BAT regulation. Thus, we measured catecholamines in 24-h urine samples to evaluate their secretion during an extended period. Whereas adrena-line and dopamine levels were similar in 3-month-old C and LP progenies, noradrenaline levels were significantly increased in LP offspring (Table 1). Moreover, in BAT itself from LP descendants, the expression of the gene encoding for theb-3 adrenergic receptor (ADRB3), which is the sub-type more responsive to noradrenaline and involved in stimulating BAT lipolysis (16), was augmented compared with C (Fig. 2B). Whereas circulating levels of FGF21 and T3 were comparable in both offsprings (Table 1), the gene expression levels of FGF21 and deiodinase-2 (DIO2), the enzyme converting in cells the less active T4 into the more active T3 (16), were higher in LP BAT than in C BAT (Fig. 2B). To sum up, the adrenergic, thyroid hormone, and FGF21 machineries appear to function at an amplified level in the young LP offspring.
DISCUSSION
A remarkable feature of the LP model predisposed to diabetes with aging is that young offspring displays severely reduced insulin secretion but only modestly perturbed glucose homeostasis (7–15). Thus, this initial mild phenotype with only glucose intolerance suggests that the descendants are able to compensate for the insulino-penia at a young age. However, with age, they fail to do so, leading to the appearance of a prediabetes phenotype with mild hyperglycemia. Previous reports have tentatively cor-related this apparent paradox in the young LP progeny to
an adaptive process in peripheral tissues, resulting in en-hanced insulin sensitivity with increased insulin receptor expression in WAT, muscle, and liver (36–38). At variance with this, we and others did not observe differences in insulin sensitivity in 3-month-old LP progeny compared with C (39,40). We report here that compared with the C, 3-month-old LP progeny has a hyperactive iBAT, which provides protection to a cold challenge and HFD-induced obesity and hyperglycemia. Indeed, these descendants present enhanced EE in association with in-creased iBAT UCP-1 expression and lipolytic activity.
Augmented EE and resistance to obesity development have been reported in young LP mouse progeny (31,41), and attributed to increased muscle metabolism (31). How-ever, in this mouse model and at this age, the possible protective role of BAT against hyperglycemia cannot be excluded, particularly considering that the mice were stud-ied 8° below their thermoneutrality since the experiments were run at 22°C. Indeed, thermoneutrality for mice lies around 30°C, whereas for rats, it is close to 22°C (28). Therefore, these colder conditions for mice, which are expected to enhance BAT activity (42), could have blunted a potential difference of BAT activity between C and LP mice. Further, in our young LP rat progeny, we did not detect contribution from muscle in increased energy metabolism. Our results support the idea that in young LP the augmented functioning of iBAT, by actively metaboliz-ing glucose and transformmetaboliz-ing its calories into heat, pre-vents hyperglycemia that otherwise would result from the marked insulinopenia. In accordance with this view, 3-month-old LP offspring showed a higher respiratory quotient than C, indicating a preference for glucose versus lipid metabolism. As predicted by our hypothesis that enhanced BAT activity has a decisive impact on the glucose homeostasis compensation process of young LP progeny, iBAT ablation in 3-month-old LP progeny resulted in mild hyperglycemia in the fed state and more pronounced hyperglycemia in the postprandial state. Importantly, and consistent with a key role of BAT, the perturbation of glucose homeostasis was associated with the loss of hyperthermia.
One week after iBAT removal, the LP progeny was unable to maintain postprandial glucose homeostasis, but 2 weeks postsurgery, it was again able to do so. This return of glycemic homeostasis is likely due to the concurrence of browning of scWAT with some regrowth of iBAT or compensation by other BAT depots (30). Brown-like cells have indeed been found to develop within WAT-forming clusters of thermogenic-competent cells able to burn fuels (43,44). Hence, WAT browning under certain physiological conditions and in animal models is now well documented and preferentially observed in scWAT (43,44). Interest-ingly, we noticed that UCP-1 gene expression was almost not detected in the scWAT of LP sham-operated descen-dants, supporting the view that normoglycemia in young LP progeny results from enhanced BAT activity rather than from WAT browning.
Table 1—Circulating levels of BAT modulators in 3-month-old C and LP progenies
C LP P value Urinary noradrenaline (nmol/L) 3336 69 5626 53* 0.038 Urinary adrenaline (nmol/L) 166 5 306 8 0.161 Urinary dopamine (nmol/L) 1.1696 215 1.387 6 381 0.640 Serum T3 (ng/mL) 0.86 0.055 0.7 6 0.033 0.317 Serum FGF21 (pg/mL) 2446 51 2226 28 0.736 Data are means6 SEM. *P , 0.05.
Both in animals and in humans, BAT content and activity are high in newborns and young subjects but regress with aging (16,19). We found that the BAT activ-ity of LP progeny is maintained for a longer time than in C but eventually declines to C levels. Indeed, whereas in C progeny, UCP-1 expression gradually decreased starting at F21, in LP progeny there was an initial increase at 3 months followed by a drop to reach levels equivalent to those of C progeny by 18 months. Linked to the pro-gressive reduction of iBAT mass and activity with age, the LP progeny becomes less protected against HFD-induced obesity and develops insulin resistance with mild hyper-glycemia at 18 months. Although a series of observations indicate that BAT can combat the occurrence of obesity and insulin resistance due to its ability to burn fuels (23,24,45), its impact on diabetes predisposition remains ill-defined. Our findings strongly support the concept that the fetal development and the lactation period form a critical window for BAT adaptation and that the mainte-nance of an active BAT delays fetal programming of dysregulated glucose homeostasis. Indeed, exposure to maternal LP diet only during gestation leads to accelera-ted catch-up followed by obesity (6), whereas no obesity occurs after LP exposure until the end of lactation. Re-markably, the iBAT of the young LP has in addition a built-in resilience to dietary stress, as it is able to increase its mass on HFD. The impact of these adaptive properties of young LP iBAT has significant physiological conse-quences, as by modulation of not only the iBAT activity
but also its mass, the animals are protected against HFD-induced obesity and associated hyperglycemia. It is par-ticularly noteworthy that in the young LP offspring, the adaptive BAT response suffices to govern glucose homeo-stasis despite severely reduced insulin secretion.
An urgent challenge is to identify how BAT senses the need to ramp up its machinery and by doing so preserves energy homeostasis. scWAT browning 2 weeks after BAT removal suggests that the reprogramming of thermogenic function in young LP progeny is likely due to circulating factors without excluding a direct reprogramming of BAT. Indeed, the burning question is whether the high BAT activity persisting in young insulinopenic LP descendants results from an adaptive tuning of progenitor cells or from postnatal metabolic adaptation. Needless to say, these non–mutually exclusive scenarios could act in concert.
Congruent with the emerging status of BAT as an inte-grator of complex regulation provided by both central and peripheral cues, our analysis of biological fluids and BAT itself reveals that the catecholamine, thyroid hormone, and FGF21 signaling pathways are amplified in BAT of LP versus C descendants. In response to stimuli such as noradrenaline, which increases thermogenic gene expression, activated BAT produces and secretes FGF21, which could exert an autocrine role (46). Similarly, catecholamines induce in BAT gene expression and activity of deiodinase-2, which is expected to increase the active T3 hormone (46). Hence, the amplified occurrence of these key actors in young LP offspring could explain its enhanced BAT activity.
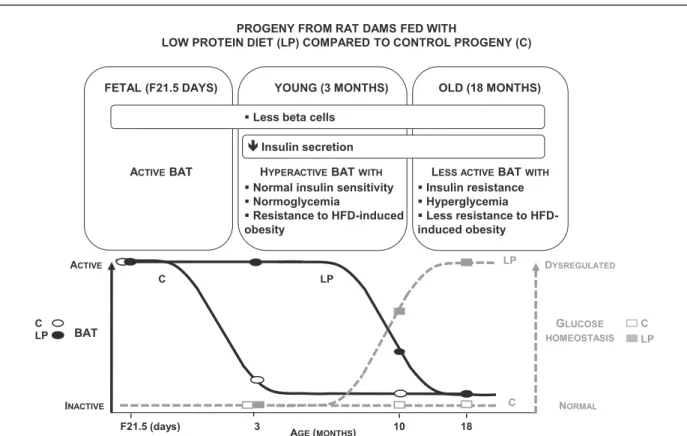
To conclude, in a rat model of maternal malnutrition, the level of iBAT activity appears to control the onset of metabolic dysregulation in predisposed LP offspring, with an initial phase showing enhanced iBAT activity at young age followed by a deactivation phase in older animals (Fig. 7). Targeting BAT-dependent energy dissipation is likely a prom-ising means to fight obesity and associated diabetes. This could be achieved by maintaining BAT in an active state in human adults. Hence we anticipate that the discovery of the mechanisms underlying sustained activation of BAT is poised to lead to novel therapeutic interventions to manipulate EE in situations with altered metabolism such as obesity and diabetes. Finally, the improved understanding of the role of BAT in energy homeostasis will spur the discovery of pre-vention and remediation strategies concerning the increased risk of metabolic diseases in the descendants having suffered from a deleterious maternal nutritional environment.
Acknowledgments.The authors thank IRCAN animal housing facility and genomics core facility. The authors also thank Dr. Elise Corsetti (Université Côte d’Azur) for help with animal work and constructive discussions and Christophe Mautaurier (Université Clermont) for help with indirect calorimetry experiments.
Funding.E.-Z.A. was supported by the EU FP7 project DIABAT (HEALTH-F2-2011-278373). M.P. holds the Canada Research Chair in Diabetes and Metabolism. E.V.O. was supported by INSERM, Université Côte d’Azur, Conseil Régional PACA, Conseil Général des Alpes-Maritimes, Aviesan/AstraZeneca (Di-abetes and the vessel wall injury program), the Agence Nationale de la Recherche (ANR) through ANR-RPV12004AAA (DIAMIR)“Investments for the Future” LABEX SIGNALIFE ANR-11-LABX-0028-01, and the European Foundation for the Study of Diabetes (EFSD/Lilly, European Diabetes Research Program). E.V.O. team mem-bers are affiliated with the FHU OncoAge (http://www.oncoage.org/).
Duality of Interest.No potential conflicts of interest relevant to this article were reported.
Author Contributions.O.D., E.R., D.F.P., and C.H. designed the study, researched data, and contributed to discussions and the manuscript. V.C., N.G., P.Le., H.J., and P.Lo. researched data. E.-Z.A. and M.P. contributed to discussions and the manuscript. C.J. and P.F. helped with animal work and contributed to discussions. E.V.O. designed the study and contributed to discussions and the manuscript. E.V.O. is the guarantor of this work and, as such, had full access to all the data in the study and takes responsibility for the integrity of the data and the accuracy of the data analysis.
References
1. Nolan CJ, Damm P, Prentki M. Type 2 diabetes across generations: from pathophysiology to prevention and management. Lancet 2011;378:169–181
2. Patel MS, Srinivasan M. Metabolic programming in the immediate postnatal life. Ann Nutr Metab 2011;58(Suppl. 2):18–28
3. Rando OJ, Simmons RA. I’m eating for two: parental dietary effects on offspring metabolism. Cell 2015;161:93–105
4. Hales CN, Barker DJ, Clark PM, et al. Fetal and infant growth and impaired glucose tolerance at age 64. BMJ 1991;303:1019–1022
5. Ravelli AC, van der Meulen JH, Michels RP, et al. Glucose tolerance in adults after prenatal exposure to famine. Lancet 1998;351:173–177
6. Martin-Gronert MS, Ozanne SE. Experimental IUGR and later diabetes. J Intern Med 2007;261:437–452
7. Petrik J, Reusens B, Arany E, et al. A low protein diet alters the balance of islet cell replication and apoptosis in the fetal and neonatal rat and is associated with a reduced pancreatic expression of insulin-like growth factor-II. Endocri-nology 1999;140:4861–4873
8. Snoeck A, Remacle C, Reusens B, Hoet JJ. Effect of a low protein diet during pregnancy on the fetal rat endocrine pancreas. Biol Neonate 1990;57: 107–118
9. Remacle C, Dumortier O, Bol V, et al. Intrauterine programming of the endocrine pancreas. Diabetes Obes Metab 2007;9(Suppl. 2):196–209 10. Dahri S, Snoeck A, Reusens-Billen B, Remacle C, Hoet JJ. Islet function in offspring of mothers on low-protein diet during gestation. Diabetes 1991; 40(Suppl. 2):115–120
11. Dumortier O, Blondeau B, Duvillié B, Reusens B, Bréant B, Remacle C. Different mechanisms operating during different critical time-windows reduce rat fetal beta cell mass due to a maternal low-protein or low-energy diet. Dia-betologia 2007;50:2495–2503
12. Dumortier O, Hinault C, Gautier N, Patouraux S, Casamento V, Van Obberghen E. Maternal protein restriction leads to pancreatic failure in off-spring: role of misexpressed microRNA-375. Diabetes 2014;63:3416–3427 13. Merezak S, Reusens B, Renard A, et al. Effect of maternal low-protein diet and taurine on the vulnerability of adult Wistar rat islets to cytokines. Diabetologia 2004;47:669–675
14. Petry CJ, Dorling MW, Pawlak DB, Ozanne SE, Hales CN. Diabetes in old male offspring of rat dams fed a reduced protein diet. Int J Exp Diabetes Res 2001;2:139–143
15. Ozanne SE, Olsen GS, Hansen LL, et al. Early growth restriction leads to down regulation of protein kinase C zeta and insulin resistance in skeletal muscle. J Endocrinol 2003;177:235–241
16. Cannon B, Nedergaard J. Brown adipose tissue: function and physiological significance. Physiol Rev 2004;84:277–359
17. Frontini A, Cinti S. Distribution and development of brown adipocytes in the murine and human adipose organ. Cell Metab 2010;11:253–256
18. Odegaard JI, Lee MW, Sogawa Y, et al. Perinatal licensing of thermogenesis by IL-33 and ST2. Cell 2016;166:841–854
19. Symonds ME. Brown adipose tissue growth and development. Scientifica (Cairo) 2013;2013:305763
20. Sellayah D, Sikder D. Orexin restores aging-related brown adipose tissue dysfunction in male mice. Endocrinology 2014;155:485–501
21. Bartelt A, Bruns OT, Reimer R, et al. Brown adipose tissue activity controls triglyceride clearance. Nat Med 2011;17:200–205
22. Nedergaard J, Cannon B. The changed metabolic world with human brown adipose tissue: therapeutic visions. Cell Metab 2010;11:268–272
23. Stanford KI, Middelbeek RJ, Townsend KL, et al. Brown adipose tissue reg-ulates glucose homeostasis and insulin sensitivity. J Clin Invest 2013;123:215–223 24. Chondronikola M, Volpi E, Børsheim E, et al. Brown adipose tissue improves whole-body glucose homeostasis and insulin sensitivity in humans. Diabetes 2014;63:4089–4099
25. Hanssen MJ, Hoeks J, Brans B, et al. Short-term cold acclimation improves insulin sensitivity in patients with type 2 diabetes mellitus. Nat Med 2015;21:863–865 26. Hanssen MJ, van der Lans AA, Brans B, et al. Short-term cold acclimation recruits brown adipose tissue in obese humans. Diabetes 2016;65:1179–1189 27. Bieswal F, Hay SM, McKinnon C, et al. Prenatal protein restriction does not affect the proliferation and differentiation of rat preadipocytes. J Nutr 2004;134:1493–1499 28. Cannon B, Nedergaard J. Nonshivering thermogenesis and its adequate measurement in metabolic studies. J Exp Biol 2011;214:242–253
29. Glider W. Using mammal study skins to investigate the relationship between surface area to volume ratio and mass of two size classes of mammals. Pro-ceedings of the Association for Biology Laboratory Education 2011;32:346–353 30. Rothwell NJ, Stock MJ. Surgical removal of brown fat results in rapid and complete compensation by other depots. Am J Physiol 1989;257:R253–R258 31. Jousse C, Muranishi Y, Parry L, et al. Perinatal protein malnutrition affects mitochondrial function in adult and results in a resistance to high fat diet-induced obesity. PLoS One 2014;9:e104896
32. Pisani DF, Beranger GE, Corinus A, et al. The K+ channel TASK1 modulates b-adrenergic response in brown adipose tissue through the mineralocorticoid receptor pathway. FASEB J 2016;30:909–922
33. Pisani DF, Ghandour RA, Beranger GE, et al. Thev6-fatty acid, arachidonic acid, regulates the conversion of white to brite adipocyte through a prostaglandin/ calcium mediated pathway. Mol Metab 2014;3:834–847
34. Schulz TJ, Huang P, Huang TL, et al. Brown-fat paucity due to impaired BMP signalling induces compensatory browning of white fat. Nature 2013;495:379–383 35. Lin JZ, Martagón AJ, Cimini SL, et al. Pharmacological activation of thyroid hormone receptors elicits a functional conversion of white to brown fat. Cell Reports 2015;13:1528–1537
36. Ozanne SE, Wang CL, Coleman N, Smith GD. Altered muscle insulin sen-sitivity in the male offspring of protein-malnourished rats. Am J Physiol 1996; 271:E1128–E1134
37. Ozanne SE, Smith GD, Tikerpae J, Hales CN. Altered regulation of hepatic glucose output in the male offspring of protein-malnourished rat dams. Am J Physiol 1996;270:E559–E564
38. Shepherd PR, Crowther NJ, Desai M, Hales CN, Ozanne SE. Altered adipocyte properties in the offspring of protein malnourished rats. Br J Nutr 1997;78:121–129 39. Lee YY, Lee HJ, Lee SS, et al. Taurine supplementation restored the changes in pancreatic islet mitochondria in the fetal protein-malnourished rat. Br J Nutr 2011;106:1198–1206
40. Tang C, Marchand K, Lam L, et al. Maternal taurine supplementation in rats partially prevents the adverse effects of early-life protein depriva-tion on b-cell function and insulin sensitivity. Reproduction 2013;145: 609–620
41. Sellayah D, Dib L, Anthony FW, et al. Effect of maternal protein restriction during pregnancy and postweaning high-fat feeding on diet-induced thermogenesis in adult mouse offspring. Eur J Nutr 2014;53: 1523–1531
42. Sanchez-Gurmaches J, Hung CM, Guertin DA. Emerging complexities in adipocyte origins and identity. Trends Cell Biol 2016;26:313–326
43. Harms M, Seale P. Brown and beige fat: development, function and ther-apeutic potential. Nat Med 2013;19:1252–1263
44. Rosenwald M, Wolfrum C. The origin and definition of brite versus white and classical brown adipocytes. Adipocyte 2014;3:4–9
45. Sidossis L, Kajimura S. Brown and beige fat in humans: thermogenic ad-ipocytes that control energy and glucose homeostasis. J Clin Invest 2015;125: 478–486
46. Villarroya F, Cereijo R, Villarroya J, Giralt M. Brown adipose tissue as a secretory organ. Nat Rev Endocrinol 2017;13:26–35