Publisher’s version / Version de l'éditeur:
Vous avez des questions? Nous pouvons vous aider. Pour communiquer directement avec un auteur, consultez la première page de la revue dans laquelle son article a été publié afin de trouver ses coordonnées. Si vous n’arrivez pas à les repérer, communiquez avec nous à [email protected].
Questions? Contact the NRC Publications Archive team at
[email protected]. If you wish to email the authors directly, please see the first page of the publication for their contact information.
https://publications-cnrc.canada.ca/fra/droits
L’accès à ce site Web et l’utilisation de son contenu sont assujettis aux conditions présentées dans le site LISEZ CES CONDITIONS ATTENTIVEMENT AVANT D’UTILISER CE SITE WEB.
CSCE 2008 Annual Conference [Proceedings], p. 10, 2008-06-10
READ THESE TERMS AND CONDITIONS CAREFULLY BEFORE USING THIS WEBSITE.
https://nrc-publications.canada.ca/eng/copyright
NRC Publications Archive Record / Notice des Archives des publications du CNRC :
https://nrc-publications.canada.ca/eng/view/object/?id=2729d4f1-08ef-4752-83d0-e912ea59e8c7 https://publications-cnrc.canada.ca/fra/voir/objet/?id=2729d4f1-08ef-4752-83d0-e912ea59e8c7
NRC Publications Archive
Archives des publications du CNRC
This publication could be one of several versions: author’s original, accepted manuscript or the publisher’s version. / La version de cette publication peut être l’une des suivantes : la version prépublication de l’auteur, la version acceptée du manuscrit ou la version de l’éditeur.
Access and use of this website and the material on it are subject to the Terms and Conditions set forth at
Prediction of effective confinement pressure in high-strength concrete
columns
http://irc.nrc-cnrc.gc.ca
Pre dic t ion of e ffe c t ive c onfine m e nt pre ssure
in high-st re ngt h c onc re t e c olum ns
N R C C - 5 0 3 1 1
C u s s o n , D . ; P a u l t r e , P .
J u n e 2 0 0 8
A version of this document is published in / Une version de ce document se trouve dans:
CSCE 2008 Annual Conference Structural Specialty, Quebec City, QC., June
10-13, 2008, pp. 10,
The material in this document is covered by the provisions of the Copyright Act, by Canadian laws, policies, regulations and international agreements. Such provisions serve to identify the information source and, in specific instances, to prohibit reproduction of materials without written permission. For more information visit http://laws.justice.gc.ca/en/showtdm/cs/C-42
Les renseignements dans ce document sont protégés par la Loi sur le droit d'auteur, par les lois, les politiques et les règlements du Canada et des accords internationaux. Ces dispositions permettent d'identifier la source de l'information et, dans certains cas, d'interdire la copie de documents sans permission écrite. Pour obtenir de plus amples renseignements : http://lois.justice.gc.ca/fr/showtdm/cs/C-42
Prediction of Effective Confinement Pressure
in High-Strength Concrete Columns
Daniel Cusson1, and Patrick Paultre2
1
National Research Council Canada, Institute for Research in Construction, Ottawa, ON K1A 0R6, Canada
2
University of Sherbrooke, Department of Civil Engineering, Sherbrooke, QC J1K 2R1, Canada
ABSTRACT: High-strength concrete (HSC) columns can achieve a ductile behaviour when sufficiently confined by high-strength lateral steel reinforcement. The full potential of high-strength steel, however, may not be achieved in lightly confined HSC columns, since the stress in the confining steel may not reach the expected yield stress usually assumed in design. Different approaches that determine the actual stress in the confining steel at peak stress of confined concrete for prismatic or cylindrical columns have been developed, namely (i) an iterative approach, and (ii) a direct approach assuming an equivalent circular column concept. In order to eliminate some of the complexities and assumptions used in these models, a new direct and simple approach is proposed. It is based on the compatibility of strains and equilibrium of forces in the column cross-section, and on actual deformations measured in the confining steel of 50 large-scale HSC columns made with widely different concrete strengths, steel yield stresses and confinement pressures. The proposed model shows that the effective stress in the confining steel does not exceed 400 MPa in lightly confined HSC columns. In this case, the use of high-strength steel for the confining reinforcement is not necessary. On the other hand, in sufficiently confined HSC columns, much higher lateral stresses can be achieved if high-strength steel is used with yield stresses up to 800 MPa, ensuring a very ductile load-carrying behaviour. Predictions of the peak stress and peak strain of 50 large-scale confined HSC columns showed a very good agreement with the experimental results.
1. INTRODUCTION
High-strength concrete (HSC) columns can achieve a very ductile behaviour when sufficiently confined by transverse reinforcement (Nagashima et al. 1992). Many models have been proposed in the past 30 years to determine the gains in strength and ductility due to the confinement of columns and predict the complete stress-strain behaviour of confined concrete (Sheikh and Uzumeri 1982, Mander et al. 1988, Cusson and Paultre 1995, and Razvi and Saatcioglu 1999). Few models, however, can accurately predict the confinement pressure provided by the confining steel, especially in lightly confined HSC columns. Confinement effectiveness depends on many variables related to the geometry of the column cross-section and reinforcement, and stress in the confining steel. The latter has been often assumed to be equal to the yield stress for modelling purposes. This approximation may be valid for sufficiently confined columns made of normal-strength concrete (NSC) and normal-strength transverse reinforcement. In other cases, it has been shown that the stress in the transverse steel, even under large column deformations, may be much lower than the assumed steel yield stress (Cusson and Paultre 1994). Such approximation in the design of confined concrete columns could result in lower than expected levels of strength and ductility. This paper presents a new and simple approach to determine the stress in the confining steel in order to provide more accurate values of strength and ductility of confined HSC columns.
2. DETERMINATION OF EFFECTIVE CONFINEMENT PRESSURE
The pressure from the transverse reinforcement can be applied only to the concrete core area where the confining stress has fully developed due to 3D arching action (Figure 1). This concept of an effectively confined concrete area was developed by Sheikh and Uzumeri (1982) and modified by Mander et al. (1988). It is calculated by applying a reduction factor to the nominal area of confined concrete delimited by the perimeter of the hoops in cylindrical columns or outer ties in prismatic columns. This reduction factor (Ke) represents the ratio of the smallest effectively confined concrete area, midway between two
layers of transverse bars, to the nominal area of confined concrete. It is determined as follows:
[1] c y x y x i e
c
s
c
s
c
c
w
K
ρ
−
⎟
⎟
⎠
⎞
⎜
⎜
⎝
⎛
−
⎟⎟
⎠
⎞
⎜⎜
⎝
⎛
−
⎟
⎟
⎠
⎞
⎜
⎜
⎝
⎛
Σ
−
=
1
2
1
2
1
6
1
' ' 2 (prismatic columns); c ec
s
K
ρ
−
⎟⎟
⎠
⎞
⎜⎜
⎝
⎛
−
=
1
2
1
' 2 (cylindrical columns) where Σwi 2is the sum of the squares of the clear horizontal spacings (wi) between the longitudinal steel
bars along the perimeter of the cross-section; s’ is the clear vertical spacing between two layers of transverse bars of diameter dh; c is the lateral dimension of the column core (cx and cy apply to
rectangular sections); and ρc is the area ratio of the longitudinal reinforcement to the column core section.
As suggested by Cusson and Paultre (1995), the effective confinement pressure (fle) and an effective
confinement index (Ice) can then be calculated using Ke in the following relationships:
[2]
c
s
f
e sh hcc le=
f
A
K
[3]I
ce=
f
le/
(
0
.
85
f
c')
where Ash is the total area of lateral bars within a vertical spacing s (center-to-center); fhcc is the stress in
the confining steel at peak stress of confined concrete; and f’c is the strength of concrete measured on
150 x 300 mm cylinders. The 0.85 factor in Equation 3 is the commonly accepted strength reduction factor related to column shape and size and to the difference between the in-situ concrete strength and that measured on standard cylinders. The effective confinement index is a dimensionless parameter, which can used to determine the confinement degree of a given column (ranges to be defined later).
The steel yield stress (fyh) has long been used to estimate the stress in the transverse reinforcement in
many confinement models for the computation of the lateral confining pressure. This assumption may be valid for normal-strength concrete columns confined with normal-strength steel, but can be inadequate for
HSC columns confined with high-strength steel. Cusson and Paultre (1994) found that the yield stress of
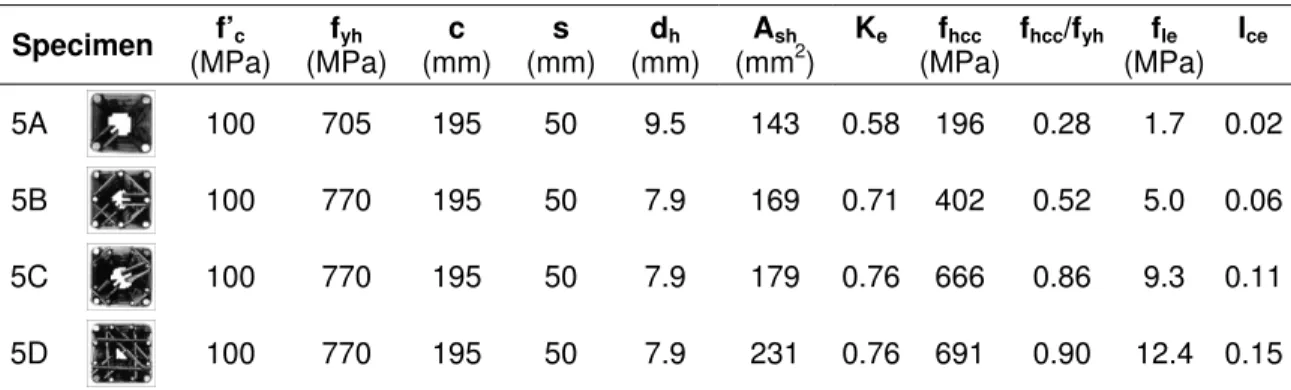
the confining steel at peak stress of confined concrete could develop only in highly confined HSC columns. Table 1 presents the geometry and measured stress in the confining steel of four of the 30 HSC specimens tested by Cusson and Paultre (1994). Each column specimen had a length of 1400 mm, a cross-section of 235 x 235 mm, and a cross-sectional area of longitudinal steel (Ast) of 2000 mm
2
. Table 1. Geometry and stress measured in the confining steel of four different HSC columns Specimen f’c (MPa) fyh (MPa) c (mm) s (mm) dh (mm) Ash (mm2) Ke fhcc (MPa) fhcc/fyh fle (MPa) Ice 5A 100 705 195 50 9.5 143 0.58 196 0.28 1.7 0.02 5B 100 770 195 50 7.9 169 0.71 402 0.52 5.0 0.06 5C 100 770 195 50 7.9 179 0.76 666 0.86 9.3 0.11 5D 100 770 195 50 7.9 231 0.76 691 0.90 12.4 0.15
It is shown that the lightly confined specimen 5A (Ice = 0.02) developed a stress in the confining steel of
only 28% of the steel yield stress when the column reached its peak stress. On the other hand, the highly confined specimen 5D (Ice = 0.15) was able to develop 90% of the yield stress in the confining steel. This
is because much larger transverse strains could be developed in Specimen 5D at the peak strength of confined concrete, which are the result of the higher effective confinement pressure provided by the very well distributed transverse and longitudinal reinforcing bars. The following paragraphs present two different approaches that were developed in the past to determine the stress in the confining steel.
2.1 Iterative Approach of Cusson and Paultre (1995)
Assuming equal concrete strains in all transverse directions (circular or square sections), the confining steel strain at peak stress of confined concrete (εhcc) was found with the following relationship:
[4] cc le cc cc cc cc hcc
f
f
ε
ν
ε
ν
ε
=
−
(
1
−
)
where νcc is the Poisson ratio of concrete at peak stress of confined concrete (assumed at 0.5 due to
microcracking); εcc is the strain at the peak stress of confined concrete (fcc); and fle is the effective
confinement pressure. The above relationship, which assumes a linear elastic behaviour for concrete, can be applied to lightly confined HSC columns, since the ascending part of the stress-strain curve of HSC is nearly linear until the peak stress. For highly confined concrete columns, εhcc may be overestimated, and
may actually be larger than the steel yield strain, indicating that the transverse reinforcement has yielded. Equation 4 has three unknowns: fle, fcc and εcc, which all depend on fhcc. In order to determine the latter
parameter, the following iterative procedure was developed by Cusson and Paultre (1995):
1. Estimate the effective confinement pressure (fle) with the steel yield stress (fhcc=fyh) as a starting point;
2. Calculate the peak stress of confined concrete (fcc) and corresponding strain (εcc);
3. Calculate the strain in confining steel (εhcc) at peak stress of confined concrete (with Equation 4);
4. Find the resulting stress in confining steel (fhcc) with the predetermined steel stress-strain relationship;
5. Re-evaluate the effective confinement pressure (fle) with the new value of fhcc, only if fhcc < fyh;
2.2 Direct Approach of Légeron and Paultre (2003)
Based on the work of Cusson and Paultre (1994, 1995), a direct approach was developed by Légeron and Paultre (2003) to calculate the stress in the transverse reinforcement at the peak stress of confined concrete with the aim to eliminate the need to use the previous iterative approach. It was also found that, in some cases, the iterative approach would not converge if the initial guess of the transverse reinforcement strain was too far from the actual value. The first step of the direct approach was to determine the effective sectional ratio of the confining reinforcement with the following equation (assuming equivalent cylindrical column geometry):
[5]
c
s
sh e se=
ρ
K
A
In order to apply to prismatic columns, Equation 5 makes the following assumptions: (i) the equivalent cylindrical column diameter is equal to the lateral core dimension of the prismatic column, and (ii) the transverse reinforcement is uniformly distributed along the perimeter and length of the equivalent cylindrical column (i.e. assuming a steel jacket of equivalent thickness). Since a steel jacket would provide full confinement effectiveness (Ke = 1.0), the confinement effectiveness of the equivalent
cylindrical column was adjusted in Equation 5 by using the value of Ke for the actual prismatic column.
From a large set of published test data on 80 large-scale confined concrete columns (Sheikh and Uzumeri 1982, Mander et al. 1984, Nagashima et al. 1992, Sheikh and Toklucu 1993, Cusson and Paultre 1994), it was found by Légeron and Paultre (2003) that the stress in the transverse reinforcement at peak stress of confined concrete was related to the stiffness ratio (κ) of concrete and transverse steel in the column cross-section at the peak stress of unconfined concrete. This stiffness ratio was calculated as follows: [6] s se c c
E
f
ρ
ε
κ
=
'/
'f
f
=
where f’c and ε’c are the strength and corresponding strain of concrete measured on standard cylinders,
respectively; and Es is the modulus of elasticity of steel. Based on this stiffness ratio, the following
relationships were proposed to determine the stress in the transverse reinforcement at peak stress of confined concrete: [7a] hcc yh if κ ≤ 10 [7b] cc c s yh se c hcc
E
and
f
f
f
≥
≤
−
=
')
10
(
25
.
0
ν
ε
κ
ρ
' if κ > 10where νcc is the Poisson ratio of concrete at peak stress of confined concrete (estimated at 0.43 from
experimental evidence). For the development of Equation 7b, it was assumed that the transverse reinforcement steel has an elastic perfectly plastic stress-strain relationship. Even though this is rarely the case, strain-hardening effects can be neglected for normal-strength steel because the onset of strain hardening is not usually reached at the peak stress of confined concrete. This, however, is not true for high-strength steel presenting a rounded stress-strain relationship with no marked yield stress. The conventional yield stress defined for a 0.2% strain offset could then underestimate the confining stress in highly confined concrete columns, since the strain in the confining steel at the peak stress of confined concrete (εhcc) may actually be larger than the strain corresponding to fyh defined for a 0.2% offset.
3. PROPOSED APPROACH
In order to simplify the use of the original Cusson and Paultre (1995) model, or to eliminate the need to use the equivalent cylindrical column assumption in the Légeron and Paultre (2003) model, a new simple and direct approach has been developed. It is proposed as a starting point to estimate the minimum stress in the confining steel at peak stress of confined concrete ( ), assuming that the concrete column meets the minimum requirements for non-seismic design (CSA A23.3 2004). In other words, it is assumed initially that the lateral confinement pressure is small (fle = 0 in Equation 4). Based on
compatibility of strains and equilibrium of forces in the column section, the minimum possible stress in the confining steel is calculated as follows:
min ' min min min hcc
f
[8]f
hcc=
ν
ccε
cE
s≤
f
yhwhere νcc is the Poisson ratio of concrete at peak stress of confined concrete (taken as 0.4 from test
results on lightly confined HSC columns); ε'c is the strain corresponding to f’c tested on standard cylinders;
Es is the steel modulus of elasticity (200,000 MPa); and fyh is the confining steel yield stress. In most
cases,
f
hcc will not exceed 400 MPa.The minimum effective confinement pressure ( ) at peak stress of confined concrete, which would represent the lateral pressure typically achieved in lightly confined concrete columns, is found as follows:
le
f
[9]c
s
f
A
K
f
le e sh hcc min min=
where Ke is defined in Equation 1; Ash is the total area of transverse reinforcement within spacing s; and c
is the lateral dimension of the column core section. In most cases,
f
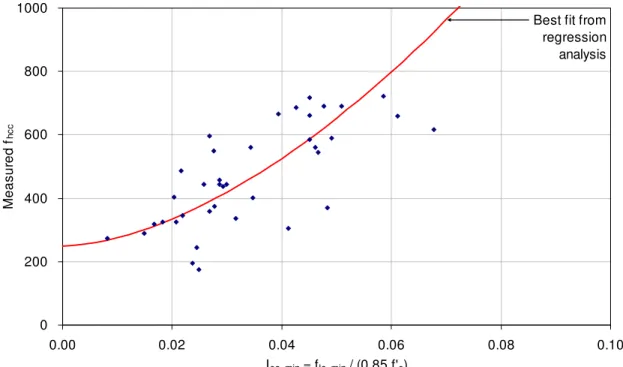
leminwill not exceed 5 MPa.Figure 2 presents the measured stress in the confining steel at peak stress of confined concrete (fhcc)
plotted as a function of the minimum effective confinement index ( ), which is divided by the unconfined column concrete strength (0.85 f’c). These data were obtained from 38 of the 50 large-scale
prismatic columns tested under compression (Cusson and Paultre 1994, and Nagashima et al. 1992). Twelve of these 50 columns were excluded from the regression analysis since their measured fhcc values
were not lower than the corresponding fyh (which would make fhcc independent). For the 38 specimens,
the concrete strength (f’c) varied from 60 MPa to 125 MPa, the transverse steel yield stress (fyh) varied
from 400 MPa to 1400 MPa, and the effective confinement index (Ice) varied from 0.01 to 0.2, providing a
wide range of experimental values for the regression analysis. Some variability is observed in Figure 2, but this can be explained by the difficulty in measuring strains on ties or hoops. Indeed, strain measurements can differ from one location to another on a given hoop, especially under large column deformations. Based on the regression analysis, the following relationship for fhcc is proposed:
min min ce
I
f
le [10] yh c le s hcc hccf
f
f
E
f
f
⎟⎟
≤
⎠
⎞
⎜⎜
⎝
⎛
+
=
7 . 1 ' min min85
.
0
33
.
0
For simplicity, Eq. 10 assumes an elastic perfectly plastic stress-strain behaviour for the confining steel. When using high-strength steel with no marked yield stress in highly-confined HSC columns, the following procedure can be used if more accurate calculations are needed: (i) determine strain εhcc by dividing fhcc
found with Eq. 10 by Es; and (ii) recalculate fhcc with the constitutive relationship of the confining steel.
Finally, the effective confinement pressure (fle) and the effective confinement index (Ice) in the column
0 200 400 600 800 1000 0.00 0.02 0.04 0.06 0.08 0.10 Ice_min = fle_min / (0.85 f'c) M e asur ed f hc c
Best fit from regression analysis
Figure 2. Correlation between fhcc and minimum effective confinement index
4. COMPARISON OF MODEL PREDICTIONS WITH EXPERIMENTAL RESULTS
Different approaches were used to predict the stress in the transverse reinforcement, the effective confinement pressure, the peak stress and the peak strain of confined concrete for the 50 large-scale HSC columns tested by Cusson and Paultre (1994) and Nagashima et al. (1992). The compared approaches included: (i) conventional approach, which assumes the steel yield stress in the transverse reinforcement at peak stress of confined concrete; (ii) iterative approach of Cusson and Paultre 1995; (iii) direct approach of Légeron and Paultre 2003; and (iv) proposed approach. For objective comparisons of the different approaches, the same equations for fcc and εcc were used in these calculations, and can be
found in Cusson and Paultre (1995).
0 200 400 600 800 1000 0 200 400 600 800 1000 Measured fhcc (MPa) P redi c ted f hc c (MP a ) 0 5 10 15 20 0 5 10 15 20 Measured fle (MPa) P redi c ted f le (MP a ) (a) (b)
4.1 Predictions of Effective Confinement Pressure
The predictions of the stress in the confining reinforcement at peak stress of confined concrete (fhcc) are
compared to the experimental results in Figure 3a; and the predictions of the effective confinement pressure (fle) are compared to the experimental results in Figure 3b. From these figures, it can be seen
that the predictions correlate very well with the experimental results, for wide ranges of concrete strengths, steel yield stresses, and confinement levels.
0 25 50 75 100 125 150 175 200 0 25 50 75 100 125 150 175 200 Measured fcc (MPa) Pr e d ic te d f cc (MP a ) Conventional approach fhcc = fyh Mean error = 9% Mean P/M = 1.08 0 25 50 75 100 125 150 175 200 0 25 50 75 100 125 150 175 200 Measured fcc (MPa) P redi c ted f cc (M P a ) Approach of
Cusson and Paultre 1995
Mean error = 5% Mean P/M = 1.01 (a) (b) 0 25 50 75 100 125 150 175 200 0 25 50 75 100 125 150 175 200 Measured fcc (MPa) Pr e d ic te d f cc (MP a ) Approach of
Légeron and Paultre 2003
Mean error = 6% Mean P/M = 1.01 0 25 50 75 100 125 150 175 200 0 25 50 75 100 125 150 175 200 Measured fcc (MPa) P red ic te d f cc (MP a ) Proposed approach Mean error = 5% Mean P/M = 1.00 (c) (d)
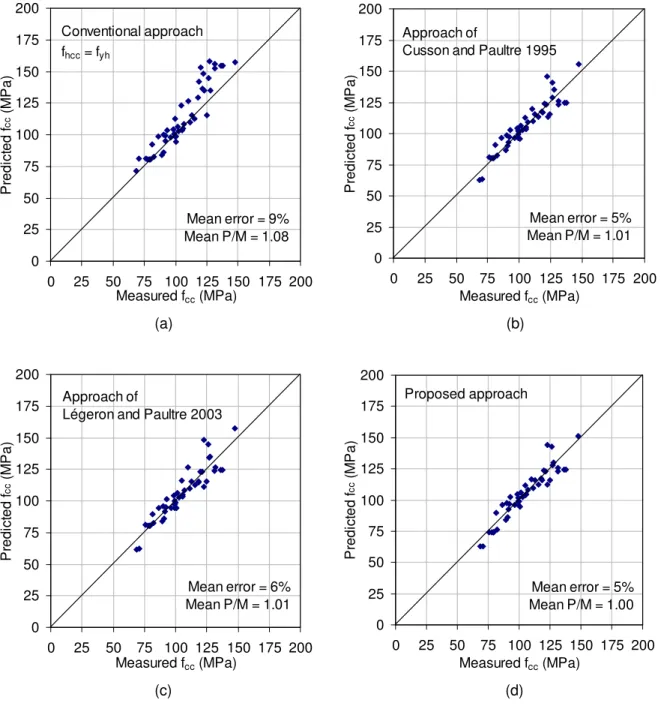
Figure 4. Comparison of measured and predicted values of fcc using different approaches
(fcc = 0.85 f’c (1+2.1 Ice 0.7
4.2 Predictions of Peak Stress
The predictions the peak stress of confined concrete (fcc) are compared to the experimental results in
Figure 4. It can be seen that the conventional approach overestimated most of the peak stresses of HSC columns when the measured fcc exceeded 100 MPa. This agrees well with the data presented in Table 1
and observations from Cusson and Paultre (1994) indicating that high-strength concrete columns may not develop the steel yield stress in the confining steel at the peak stress unless they are highly confined. The average prediction error for the conventional approach was 9% with an average ratio of predicted-to-measured values of 1.08 (mean P/M). Regarding the three other approaches, the prediction errors reduced to 5-6%, with P/M ratios near unity. As far as peak stress prediction is concerned, the last three approaches were found to be equally accurate. The proposed approach, however, has the advantage of being direct and simple, and uses fewer assumptions.
0.00 0.01 0.02 0.03 0.04 0.00 0.01 0.02 0.03 0.04 Measured εcc P redi c ted e cc Conventional approach fhcc = fyh Mean error = 33% Mean P/M = 1.24 0.00 0.01 0.02 0.03 0.04 0.00 0.01 0.02 0.03 0.04 Measured εcc P redi c ted e cc Approach of
Cusson and Paultre 1995
Mean error = 15% Mean P/M = 1.08 (a) (b) 0.00 0.01 0.02 0.03 0.04 0.00 0.01 0.02 0.03 0.04 Measured εcc Pr e d ic te d e cc Approach of
Légeron and Paultre 2003
Mean error = 16% Mean P/M = 1.04 0.00 0.01 0.02 0.03 0.04 0.00 0.01 0.02 0.03 0.04 Measured εcc P redi ct ed e cc Proposed approach Mean error = 12% Mean P/M = 0.96 (c) (d)
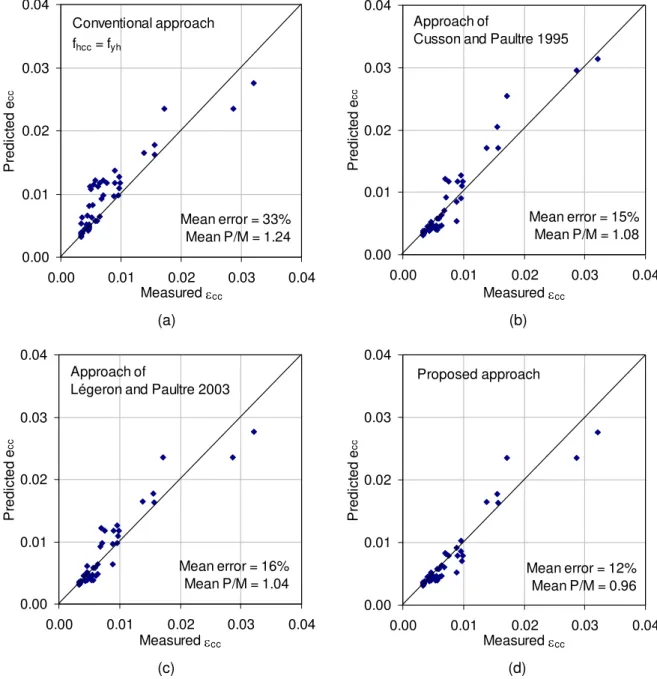
Figure 5. Comparison of measured and predicted values of εcc using different approaches
(εcc = ε’c + 0.21 Ice 1.7
4.3 Predictions of Peak Strain
The predictions of peak strain of confined concrete (εcc) are compared to the experimental results in
Figure 5. It can be seen that the conventional approach overestimated most of the peak strains when the measuredεcc was lower than 0.02, with a high average prediction error of 33% and a high average ratio of
predicted-to-measured values of 1.24. As explained before, lightly confined HSC columns may not develop the yield stress in the transverse reinforcement at the peak strain of confined concrete. The proposed approach provided the most accurate predictions with a prediction error of only 12% and a more conservative P/M ratio of 0.96.
5. OPTIMUM YIELD STRESS OF TRANSVERSE REINFORCEMENT
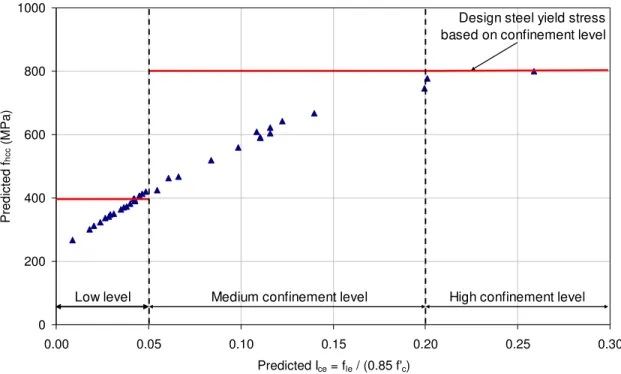
Cusson and Paultre (1995) have defined three ranges for the effective confinement index (Ice) based on
the confinement level for HSC columns tested under axial compression. These ranges are illustrated in Figure 6 and correspond to low, medium and high levels of confinement. The proposed approach was used to plot the predicted fhcc against the predicted effective confinement index (Ice) for the large-scale
columns considered in the development of the proposed approach. The resulting set of data can be used to select the yield stress of the confining reinforcement based on the required confinement level for a given column. Since lightly confined HSC columns may not develop high stresses in the confining steel even under large column deformations, it is not necessary to use the more expensive high-strength confining steel for the construction of these columns. Figure 6 suggest the following yield stress limits: • Low confinement level (0% < Ice ≤ 5%): fyh = 400 MPa
• Medium confinement level (5% < Ice ≤ 20%): fyh = 800 MPa
• High confinement level (20% < Ice ≤ 30%): fyh = 800 MPa
This means that the use of high-strength confining steel with fyh = 800 MPa would provide a very ductile
behaviour in columns designed with sufficient confining reinforcement, and that lightly confined HSC columns (Ice < 0.05) would not benefit from the use of high-strength steel for the confining reinforcement.
0 200 400 600 800 1000 0.00 0.05 0.10 0.15 0.20 0.25 0.30 Predicted Ice = fle / (0.85 f'c) Pred icted f hc c (M Pa)
Medium confinement level High confinement level Low level
Design steel yield stress based on confinement level
6. SUMMARY AND CONCLUSIONS
It was demonstrated that lightly confined high-strength concrete (HSC) columns may not develop their expected confinement pressures if the confining steel is designed assuming full development of the steel yield stress, as done in most conventional confinement models. In order to accurately predict the effective confinement pressure in HSC columns, a new simple approach is proposed. It is based on the compatibility of strains and equilibrium of forces in the column cross-section, and on actual deformations measured on the confining steel of large-scale HSC columns made with wide ranges of concrete strengths, steel yield stresses, and confinement levels. The proposed model shows that, in most cases, the stress in the transverse reinforcement at peak strength of confined concrete will not exceed 400 MPa in lightly confined concrete columns (i.e. effective confinement index lower than 5%), and 800 MPa in highly confined concrete columns (with an index up to 30%). The use of more expensive high-strength confining steels with yield stresses higher than 800 MPa may not be necessary for the range of confinement levels considered in this study. Predictions of effective confinement pressures, peak stresses and peak strains of 50 large-scale high-strength concrete columns showed a very good agreement with the experimental results. The proposed model was also found to be more accurate than other existing models, with the advantages of being less complex and using fewer assumptions.
7. REFERENCES
CSA A23.3. 2004. Design of Concrete Structures, 5th Ed., Canadian Standards Association, Rexdale, ON, Canada, 258 p.
Cusson, D., and Paultre, P. 1994. High-Strength Concrete Columns Confined by Rectangular Ties, ASCE Journal of Structural Engineering, 120(3), 783-804.
Cusson, D. and Paultre, P. 1995. Stress-Strain Model for Confined High-Strength Concrete. ASCE Journal of Structural Engineering, 91(4), 434-447.
Légeron, F. and Paultre, P. 2003. Uniaxial Confinement Model for Normal- and High-Strength Concrete Columns. ASCE, Journal of Structural Engineering, 129(2) 241-252.
Mander, J. B., Priestley, M. J. N., and Park, R. 1988. Observed Stress-Strain Behavior of Confined Concrete. ASCE Journal of Structural Engineering, 114(8), 1827-1849.
Nagashima, T., Sugano, S., Kimura, H., and Ichikawa, A. 1992. Monotonic Axial Compression Test on Ultra-High Strength Concrete Tied Columns. Tenth World Conference on Earthquake Engineering, Madrid, Spain, July 19-24, 5, 2983-2988.
Razvi, S., and Saatcioglu, M. 1999. Confinement Model for High-Strength Concrete. ASCE Journal of Structural Engineering, 125(3), 281-289.
Sheikh, S. A., and Toklucu, M. T. 1993. Reinforced concrete columns confined by circular spirals and hoops, ACI Structural Journal, 90(5), 542-553.
Sheikh, S. A., and Uzumeri, S. M. 1982. Analytical Model for Concrete Confinement in Tied Columns. ASCE Journal of Structural Engineering, 108(12), 2703-2722.