Publisher’s version / Version de l'éditeur:
Vous avez des questions? Nous pouvons vous aider. Pour communiquer directement avec un auteur, consultez la première page de la revue dans laquelle son article a été publié afin de trouver ses coordonnées. Si vous n’arrivez pas à les repérer, communiquez avec nous à PublicationsArchive-ArchivesPublications@nrc-cnrc.gc.ca.
Questions? Contact the NRC Publications Archive team at
PublicationsArchive-ArchivesPublications@nrc-cnrc.gc.ca. If you wish to email the authors directly, please see the first page of the publication for their contact information.
https://publications-cnrc.canada.ca/fra/droits
L’accès à ce site Web et l’utilisation de son contenu sont assujettis aux conditions présentées dans le site LISEZ CES CONDITIONS ATTENTIVEMENT AVANT D’UTILISER CE SITE WEB.
Technical Report (National Research Council of Canada. Ocean, Coastal and River Engineering), 2015-06
READ THESE TERMS AND CONDITIONS CAREFULLY BEFORE USING THIS WEBSITE.
https://nrc-publications.canada.ca/eng/copyright
NRC Publications Archive Record / Notice des Archives des publications du CNRC :
https://nrc-publications.canada.ca/eng/view/object/?id=b314d74a-d9bb-468b-9729-160708b0ef6e https://publications-cnrc.canada.ca/fra/voir/objet/?id=b314d74a-d9bb-468b-9729-160708b0ef6e
Archives des publications du CNRC
For the publisher’s version, please access the DOI link below./ Pour consulter la version de l’éditeur, utilisez le lien DOI ci-dessous.
https://doi.org/10.4224/23003379
Access and use of this website and the material on it are subject to the Terms and Conditions set forth at
Comparison of a thermal manikin to human thermoregulatory responses
OCRE-TR-2015-012
Comparison of a Thermal Manikin to Human
Thermoregulatory Responses
Technical Report – Unclassified
Jonathan Power, Ph.D. Andrew Baker, M.Sc. António Simões Ré, P.Eng.
St. John’s, NL
June 2015
National Research Council Conseil national de recherché Canada Canada
Ocean, Coastal and River Génie océanique, côtier et fluvial Engineering
Comparison of a Thermal Manikin to Human Thermoregulatory Responses
OCRE-TR-2015-012 Unclassified
Jonathan Power, Ph.D. Andrew Baker, M.Sc. António Simões Ré, P.Eng
Abstract
Canada is currently the only country in the world that allows the use of thermal manikins to measure the thermal protective properties of immersion suits. This is advantageous compared to having multiple human participants perform the long cold water immersions necessary for suit testing; however, previous research has shown that differences exist between the two that may cause unexpected results. The goal of this study was to compare the thermoregulatory responses of human participants and thermal manikins during cold water immersions while wearing three different custom made immersion suit ensembles. One ensemble had insulation distributed evenly around the torso and limbs (Control); another had insulation concentrated around the torso (Human Beneficial – HB); and the third had insulation concentrated around the limbs (Manikin Beneficial – MB). Eleven male participants performed three separate, three-hour immersions in 5°C water. Mean skin temperature, skin heat loss, gastro-intestinal temperature, and metabolic heat production (calculated via oxygen consumption) were measured throughout these tests. The thermal manikin also performed immersions in the same conditions to measure the clo value of each ensemble.
No significant differences were found across the three immersion ensembles in total mean skin temperature change, total mean skin heat loss, gastro-intestinal temperature change, and metabolic heat production. The total clo values of the three ensembles, as measured by the thermal manikin, were very similar with less than 10% difference between them. When comparisons were made at the regional level (i.e. torso and the limbs) significant differences were detected in the some physiological measurements between the ensembles. The thermal manikin also reported higher regional clo values in the torso in some ensembles compared to others.
The initial findings from this set of tests suggest that concentrating insulation around the torso or the limbs of an immersion suit will not affect the level of thermal stress placed upon the humans who wear it, nor will it change the clo value as measured by a thermal manikin. As a result, this may indicate that once a certain amount of insulation is contained within an immersion suit, altering its distribution between the torso and limbs may not impact the level of
Table of Contents
Abstract ... i
Table of Contents ... iii
List of Tables ... v
List of Figures ... vi
List of Acronyms ... vii
1.0 Introduction ... 1 2.0 Methods... 3 2.1 Participants ... 3 2.2 Test Conditions ... 3 2.3 Immersion Ensembles ... 3 2.4 Procedure ... 5 2.6 Thermal Manikin ... 7 2.7 Calculations ... 7 2.8 Statistical Analyses ... 9 3.0 Results ... 10 3.1 MSHL at Immersion End ... 10 3.2 Change in ... 12 3.3 Change in TGI ... 15
3.4 at Immersion End ... 16
3.5 Clo Values ... 17
4.0 Discussion ... 21
4.1 Study Results ... 21
4.3 Conclusions ... 29
5.0 Acknowledgements ... 30 6.0 References ... 31
List of Tables
Table I. Participant anthropometrics (n = 11). ... 3
Table II. Neoprene thickness (mm) for each section of the inner liners. ... 4
Table III. Regional MSHL (W·m-2) for NEMO for each ensemble. ... 12
Table IV. Clo values (clo) as measured by NEMO. ... 20
List of Figures
Figure 1. Participant in the water calorimeter during a typical test. ... 6
Figure 2. NEMO immersed in the water calorimeter during a typical test. ... 7
Figure 3. MSHL (W·m-2) at the end of the 3 hour immersions for each ensemble (n = 11. Mean [SD]). ... 10
Figure 4. Torso MSHL (W·m-2) at the end of the 3 hour immersions for each ensemble (n = 11. Mean [SD]). ... 11
Figure 5. Limbs MSHL (W·m-2) at the end of the 3 hour immersions for each ensemble (n = 11, Mean [SD], ** = P < 0.01). ... 12
Figure 6. Change in total TSK for each ensemble after the 3 hour immersions (n = 11. Mean [SD]). ... 13
Figure 7. Change in torso TSK for each ensemble after the 3 hour immersions (n = 11, Mean [SD], * = P < 0.05, ** = P < 0.01). ... 14
Figure 8. Change in limbs TSK for each ensemble after the 3 hour immersions (n = 11, Mean [SD], * = P < 0.05). ... 15
Figure 9. Change in TGI (°C) for each ensemble after the 3 hour immersions (n = 11. Mean
[SD]). ... 16
Figure 10. Metabolic heat production (W·m-2) at the end of the 3 hour immersion for each ensemble (n = 11. Mean [SD]). ... 17
Figure 12. Torso clo value (clo) as measured by the human participants at the end of the 3 hour immersion (n = 11, Mean [SD], * = P < 0.05, ** = P < 0.01). ... 19
Figure 13. Limbs clo value (clo) as measured by the human participants at the end of the 3 hour immersion (n = 11, Mean [SD], * = P < 0.05). ... 20
Figure 14. Mean predicted clo values, as measured by a thermal manikin in calm water, required to remain in thermal balance for a given water temperature for an individual with a SA of 2.0 m2, a TSK of 27°C, and a VO2 of 0.72 L min-1. ... 28
List of Acronyms
CGSB Canadian General Standards Board
HB Human Beneficial
IMO International Maritime Organization
MB Manikin Beneficial
MSHL Mean skin heat loss (W·m-2)
M Metabolic heat production (W·m-2)
NFCI Non-freezing cold injury
NRC National Research Council of Canada
REB Research Ethics Board
RER Respiratory exchange ratio
SA Surface area (m2)
TGI Gastro-intestinal temperature (°C)
T Mean skin temperature (°C)
1.0 Introduction
Every day employees of Eastern Canadian offshore petroleum industry must work or travel over cold ocean water that is below human thermoneutral temperatures (i.e. 35°C). In order to survive an accidental immersion in the water thermal personal protective equipment in the form of an immersion suit is often used. An immersion suit is a lifesaving appliance designed to reduce the cold shock response, provide flotation, and delay the onset of hypothermia (CGSB, 2005). In Canada, the thermal protective properties of immersion suits can be measured using either humans or thermal manikins, with the latter being the more popular choice. Thermal manikins offer the benefit of being able to measure the insulation value of immersion suit ensembles (measured in clo1) in a variety of conditions without having to subject humans to extreme tests; the ethical nature of which has been questioned (Barwood and Tipton, 2011).
While thermal manikins are a convenient method for testing immersion suits, previous work by Tipton and Balmi (1996) found that discrepancies exist between them and the humans who will ultimately use the suits. The authors found that when introducing leakage underneath immersion suits during tests in 10°C water humans and thermal manikins produced different responses. Thermal manikins lost more heat through their limbs compared to the torso when water leakage was introduced to these areas, while the opposite effect occurred with humans (Tipton and Balmi, 1996). As humans cool, thermoregulatory responses restrict blood flow to the extremities and redirect it towards the torso; a process that helps lessen heat loss to the environment. Thermal manikins maintain a set skin temperature and lose proportionally greater quantities of heat through the limbs when immersed; processes that do not occur in humans. Tipton and Balmi (1996) cautioned that when thermal manikins are used to certify immersions suits a natural selection process can occur that would result in a suit being selected that is optimal for the manikin and not for the actual end users. This recommendation to proceed with caution when using thermal manikins was the justification for this study.
Currently international certification standards such as those prescribed by the International Maritime Organization (IMO) only allow the use of a thermal manikin when it has
1
One clo is equivalent to the amount of insulation required to keep a seated individual comfortable in air at a temperature of 21°C, relative humidity less than 50% and air movement of 0.1 m·s-1 (Golden and Tipton, 2002)
been demonstrated to provide test results that correlate with those obtained from human subjects (IMO, 2010). Canada is the only country in the world that allows the use of thermal manikins to certify the thermal protective properties of marine abandonment suits and helicopter passenger transportation immersion suits. Canadian standards permit that the thermal protective properties of these suits be tested using either human volunteers or thermal manikins, but there has been little work done since that of Tipton and Balmi (1996) to directly compare the responses of the two.
The goal of this study was to investigate the thermal responses between thermal manikins and human volunteers during immersions in cold water wearing specially designed immersion suit ensembles. Three immersion suit ensembles were worn by the participants: a control ensemble that had insulation distributed evenly over the body (“Control”); an ensemble that had a greater concentration of insulation over the torso compared to the limbs (“Human Beneficial” - HB); and an ensemble that had a greater concentration of insulation over the limbs compared to the torso (“Manikin Beneficial” - MB). The HB and MB ensembles were based on the work by Tipton and Balmi (1996) who reported that humans lost more heat through the wetted torso, while the manikin lost more heat through the wetted limbs. All immersion ensembles weighed the same (i.e. they all had the same amount of total insulating material).
The hypotheses for this study were:
H1: For the human volunteers, the HB ensemble would result in less thermal stress compared to
the Control and MB ensembles, as indicated by less change in deep body temperature and a lower intensity of shivering.
H2: The thermal manikin would report a higher clo value for the MB ensemble compared to the
2.0 Methods
2.1 ParticipantsThe National Research Council of Canada’s (NRC) Research Ethics Board (REB) approved this study (REB#: 2014-31). Eleven males participated in this study and their anthropometrics are given in Table I. All participants gave their written informed consent to participate and were screened by a medical doctor to ensure they were physically fit to do so.
Table I. Participant anthropometrics (n = 11).
Age (yrs) Height (m) Weight (kg) Body Fat (%) Surface Area (m2) Mean 27.6 1.79 87.2 19.9 2.09 SD 9.6 0.06 8.4 4.4 0.11 2.2 Test Conditions
Participants performed three separate, three-hour immersions. All tests were conducted in the Thermal Measurements Lab (TML) located at the NRC facility in St. John’s, NL, Canada. Participants were immersed in a full body water calorimeter floating face up. Both air and water temperature were maintained at 5°C.
2.3 Immersion Ensembles
For each immersion participants wore a different immersion ensemble that consisted of the outer shell of a White’s Marine Abandonment suit (White’s Manufacturing, Victoria, BC, Canada) and one of three custom designed neoprene inner liners attached. The three inner liners were:
1. Control – neoprene distributed uniformly throughout the inner liner.
2. Human Beneficial (HB) – neoprene concentrated around the torso with a reduced amount covering the limbs.
3. Manikin Beneficial (MB) – neoprene concentrated around the limbs with a reduced amount covering the torso.
All three inner liners were the same weight and contained the same amount of neoprene. The thickness of the neoprene covering each section of the inner liners is given in Table II.
Table II. Neoprene thickness (mm) for each section of the inner liners.
Control HB MB
Torso thickness 2 3 1
Limbs thickness 2 1 3
The underclothing provided to the participants was standardized and based on that prescribed by CAN/CGSB-65.16-2005. It consisted of wool socks, swimming trunks, cotton jogging pants, a cotton undershirt, and a long sleeved cotton shirt. Swimming trunks were provided to the participants so that they could enter a hot water bath (40°C) to rewarm once the immersions were completed.
Skin heat loss and temperature were measured using heat flow transducers (Concept Engineering, Old Saybrook, CT, USA) attached to the subjects using porous adhesive tape at the following locations: right foot; left shin; right quadriceps; left abdominal; right pectoral; underside of right forearm; forehead; right calf; left hamstring; right lower back; left shoulder; and topside of the left forearm. These sites were chosen based on a similar protocol used for previous immersion suit research (Ducharme and Brooks, 1998) which was similar to the Hardy and DuBois modified 12 point system (Hardy and DuBois, 1938). The heat flow transducers were connected to self-contained data loggers (ACR Data Systems, Surrey, BC, Canada) that measured and recorded all 12 sensors once every eight seconds.
Gastro-intestinal temperature (TGI) was measured using ingestible, disposable radio
telemetry pills (HQ Inc., Palmetto, FL, USA). Telemetry from the pills was measured and recorded once every 20 seconds by a data recorder (also manufactured by HQ Inc.) that transmitted the data to a laptop and enabled a research team to monitor TGI in real-time during
Participants wore a latex oro-nasal facemask (KORR Medical Technologies, Salt Lake City, UT, USA) which was attached to a length of tubing that connected it to a Cardio Coach CO2 (also manufactured by KORR Medical Technologies) and measured oxygen consumption
(VO ).
2.4 Procedure
On the day of an immersion, participants arrived at the NRC facility and ingested a gasto-intestinal pill with a small volume of tap water approximately 45 minutes before the start of the test. Every participant received a new gasto-intestinal pill prior to each of their immersions as they all had passed the ones from their previous test.
After ingesting a gastro-intestinal pill, participants then changed into swimming trunks, were weighed, and attached an external bladder themselves to enable in-test urination. This external bladder was attached via condom catheter which excluded females from participation in the study. A research team member then attached the heat flow transducers and assisted the participants in donning the rest of the underclothing and immersion suit ensembles. The participants then proceeded to the TML.
Once in the TML, all instrumentation was checked for functionality, the suits were fully zipped, the face mask was attached, and five minutes of baseline data were collected. Participants entered the water calorimeter via a set of steps and assumed a floating position with their hands resting on their stomach (Figure 1). The participants were instructed to keep their hands out of the 5°C water as they were wearing leather mittens instead of the immersion suit gloves. During pilot testing, it was found that the immersion suit gloves constricted the blood flow to the hands causing finger temperature to drop to 6°C in under two hours. In order to reduce the likelihood of a non-freezing cold injury (NFCI) from occurring a protocol was established that required the immersions to be stopped if finger or toe temperature dropped below 8°C for more than 20 minutes. To ensure that the immersions were not terminated before the scheduled time due to safety concerns (i.e. low finger temperatures caused by the immersion suit gloves), the decision was made to have the participants wear the leather mittens. Once in position, the participants were connected via the face mask to the length of tubing attached to the Cardio Coach CO2.
Figure 1. A participant in the water calorimeter during a typical test.
During the immersions participants watched movies projected onto the TML wall, with audio transmitted through a radio located on their person.
The immersions were terminated if any of the following criteria occurred: 1. The three hour time limit had been reached.
2. TGI dropped 2°C or more below baseline values.
3. Finger or toe temperature dropped below 8°C for more than 20 minutes. 4. At the request of the participant.
Once removed from the water data were downloaded from the instrumentation before it was removed. The participants then rewarmed in a hot water bath until TGI approached
pre-immersion values. After rewarming, skin fold thickness was measured using skin fold callipers (Beta Technology, Santa Cruz, CA, USA). Once their well-being was assured, the participants were allowed to exit the facility.
2.6 Thermal Manikin
A 23 zone immersible thermal manikin (NEMO) was dressed in the same underclothing as the participants and tested in the same three immersion ensembles in the water calorimeter. NEMO was placed and secured in the water calorimeter in the same floating position as the participants (Figure 2). Each of the 23 zones was programmed to maintain a skin temperature of 35°C.
Figure 2. NEMO immersed in the water calorimeter during a typical test. 2.7 Calculations
Body fat percentage was estimated using the Durnin and Womersley method (Durnin and Womersley, 1969). This method involves measuring and summing skinfold thicknesses taken at four sites (biceps, triceps, subscapular, and iliac crest).
The surface area of the subjects was calculated using the following formula (Gehan and George, 1970):
where:
WT = Mass (kg)
HT = Height (m)
Mean skin heat loss (MSHL; W m-2) and mean skin temperature (T ; °C) were calculated by weighting each of the 12 measurement sites by the values reported by Hardy and Dubois (1938) and summing the total. The final value was divided by 0.95 to account for a lack of a measurement on the hand; this is similar to the procedure described by Ducharme and Brooks (1998).
Changes in TGI (∆TGI; °C) and T (∆T ; °C) were calculated by obtaining the mean
values of each respective parameter during a five minute period at the start of the immersion and then subtracting them from mean values taken during a five minute period at the end of the test. Clo value was calculated using the following equation (Romet et al., 1991):
clo (°C m2W-1) = (T - TW)/MSHL/0.155 (2)
The anatomies of both the human participants and NEMO were split into two separate regions: “Torso” and “Limbs” to compare regional MSHL, T change, and clo value across the three ensembles. The specific measurement sites that comprised each region on the humans are:
Torso: Left abdomen, right pectoral, right lower back, and left shoulder.
Limbs: Right foot, left shin, right quadriceps, right calf, left hamstring, under side of the right forearm, and topside of the left forearm.
Regional MSHL, T change, and clo values for the human participants were calculated using the following equation:
Torso/Limb Region: ∑ (site measurement site weighting value) (3)
The 23 separate segments on NEMO were separated into the two regions as follows: Torso: Chest, shoulders, stomach, back, and cod piece.
Limbs: Right upper arm, left upper arm, right forearm, left forearm, right hand, left hand, right thigh front, right thigh back, left thigh front, left thigh back, right calf front, right calf back, left calf front, left calf back, right foot, left foot.
Regional MSHL and clo values for NEMO were calculated using the equation 3, with each segment weighted according to its surface area.
The rate of metabolic heat production (M ; W m-2) was calculated using the rates of oxygen consumption (VO ; L min-1), reported by the Cardio Coach online system and were averaged over the last 30 min period at the end of each immersion. M was calculated based on the following formula (Peronnet and Massicotte, 1991):
M (W m-2) = (281.65 + 80.65 RER) (VO /SA) (4)
Where:
M = Metabolic heat production (W m-2)
RER = Respiratory exchange ratio VO = Oxygen consumption (L min-1)
SA = Surface area (m2)
RER was given a value of 1.0 since a change of ± 0.15 (maximum physiological range for non-protein oxidation) from a reference value of 0.85 would lead to an error of less than 3.6% in M (Tikuisis, 1999).
2.8 Statistical Analyses
Repeated measures analyses of variance (ANOVA) were performed to detect significant differences between the various immersion ensembles, with a P value less than 0.05 considered to be significant. If significant differences were detected, Tukey’s post hoc tests were performed. All results are presented as means with standard deviation [SD].
3.0 Results
All participants completed the three, three-hour immersions in the various immersion ensembles. Equipment failures resulted in skin heat loss not being recorded on the right calf and left hamstrings during some immersions. If this was the case, total and regional MSHL were recalculated by summing the remaining heat loss values and dividing by a new weighting value that took into account the loss of those unrecorded sensor locations (torso calculation only). 3.1 MSHL at Immersion End
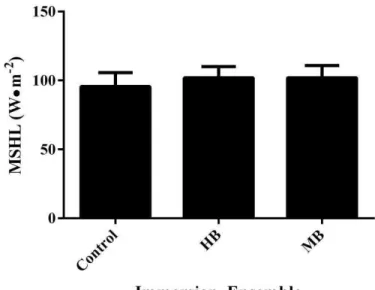
There were no significant differences in total MSHL across all immersion ensembles at the end of the immersions (Figure 3). MSHL was 95.5 [10.2] W m-2 in the Control ensemble, 101.9 [8.2] W m-2 in HB, and 102.0 [8.8] W m-2 in MB.
Figure 3. MSHL (W·m-2) at the end of the three-hour immersions for each ensemble (n = 11. Mean [SD]).
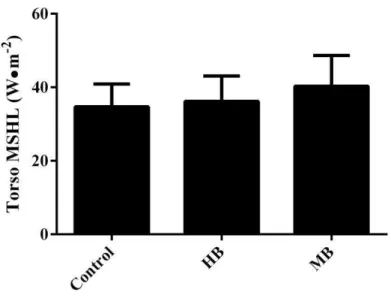
There were no significant differences in MSHL in the torso across all immersion
ensembles at the end of the immersions (Figure 4). MSHL for the torso was 34.6 [6.2] W m-2 in the Control ensemble, 36.2 [6.9] W m-2 in HB, and 40.3 [8.4] W m-2 in MB.
Figure 4. Torso MSHL (W·m-2) at the end of the three-hour immersions for each ensemble (n = 11. Mean [SD]).
There were significant differences between MSHL in the limbs across the ensembles. MSHL in the limbs was significantly greater in the HB ensemble (28.2 [4.7] W m-2) compared to both the Control (23.5 [1.3] W m-2) and MB (23.5 [1.5] W m-2) ensembles (Figure 5).
Figure 5. Limbs MSHL (W·m-2) at the end of the three-hour immersions for each ensemble (n = 11, Mean [SD], ** = P < 0.01).
MSHL for each region on NEMO is given in Table III.
Table III. Regional MSHL (W·m-2) for NEMO for each ensemble.
Region Control HB MB
Total (torso + limbs) 223.7 232.2 232.2
Torso 51.1 45.3 55.5
Limbs 172.6 186.9 176.67
3.2 Change in
There were no significant differences in total ∆T across all suit ensembles at the end of the immersions (Figure 6).Total T fell by -4.5 [0.6]°C in the Control ensemble; -4.5 [1.0]°C in HB; and -4.6 [0.9]°C in MB.
Figure 6. Change in total T for each ensemble after the three-hour immersions (n = 11. Mean [SD]).
There were significant differences in ∆T for the torso across the immersion ensembles. T fell by a significantly greater amount in the MB ensemble (-1.4 [0.4] °C) compared to both the Control (-0.9 [0.4] °C) and HB (-0.7 [0.4] °C) ensembles (Figure 7).
Figure 7. Change in torso T for each ensemble after the three-hour immersions (n = 11, Mean [SD], * = P < 0.05, ** = P < 0.01).
There was a significant difference in the change in T for the limbs across two of the ensembles. Limbs T fell by a significantly greater amount in the HB ensemble (-3.5 [0.5]°C) compared to the MB ensemble (-2.9 [0.6] °C) (Figure 8). The fall in limb T in the Control ensemble (-3.2 [0.5] °C) was not significantly different compared to that of the other two.
Figure 8. Change in limbs T for each ensemble after the three-hour immersions (n = 11, Mean [SD], * = P < 0.05).
3.3 Change in TGI
There were no significant differences in ∆TGI across all ensembles at the end of the
immersions (Figure 9). TGI fell by 0.1 [0.4]°C in the Control ensemble, 0.2 [0.4]°C in HB, and
Figure 9. Change in TGI (°C) for each ensemble after the three-hour immersions (n = 11. Mean
[SD]).
3.4 at Immersion End
There were no significant differences in the rate of metabolic heat production (M) in the human participants across all ensembles (Figure 10). M was 89.3 [13.7]W·m-2 at the end of the immersions in the Control ensemble, 93.2 [12.6] W·m-2 in HB, and 98.0 [18.5] W·m-2 in MB.
Figure 10. Metabolic heat production (W·m-2) at the end of the three-hour immersion for each ensemble (n = 11. Mean [SD]).
3.5 Clo Values
There were no significant differences in the clo values of the suit ensembles when worn by the human participants at the end of the three-hour immersions (Figure 11). The clo value in the Control ensemble was 1.39 [0.16] clo, 1.28 [0.13] clo in HB, and 1.28 [0.14] clo in MB.
Figure 11. Clo value as measured by the human participants at the end of the three-hour immersion (n = 11, Mean [SD]).
There were significant differences between the torso clo values across all immersion ensembles (Figure 12). The Control ensemble had a significantly higher clo value (0.67 [0.16] clo) compared to MB (0.55 [0.13] clo). The HB ensemble also had a significantly higher clo value for the torso (0.64 [0.10] clo) compared to the MB ensemble.
Figure 12. Torso clo value (clo) as measured by the human participants at the end of the three-hour immersion (n = 11, Mean [SD], * = P < 0.05, ** = P < 0.01).
There were significant differences in the limbs clo values across all immersion ensembles as measured by the participants. The limbs clo value for the HB ensemble (0.68 [0.13] clo) was significantly lower than the Control (0.78 [0.07] clo) and MB ensembles (0.79 [0.10] clo) (Figure 13). There was no significant difference in clo value between the Control and MB ensemble.
Figure 13. Limbs clo value (clo) as measured by the human participants at the end of the three-hour immersion (n = 11, Mean [SD], * = P < 0.05).
The total and regional clo values as measured by NEMO are given in Table IV.
Table IV. Clo values (clo) as measured by NEMO.
Region Control HB MB
Total (Torso + Limbs) 1.09 1.06 1.09
Torso 0.82 1.03 0.82
4.0 Discussion
4.1 Study ResultsThis study sought to investigate and compare the thermoregulatory responses of humans to a thermal manikin during cold water immersions. Both humans and a manikin performed tests in three custom designed immersion ensembles: one that had insulation distributed in a uniform fashion (Control); one that had insulation concentrated around the torso (HB); and one that had insulation concentrated around the limbs (MB). It was hypothesized that wearing the HB ensemble would result in less thermal stress on the human participants as indicated by a lower change in TGI and lower M values compared to the Control and MB ensembles. It was also
hypothesized that the thermal manikin would measure a higher clo value while wearing the MB suit compared to the other two ensembles.
Based on the analysis of the data both hypotheses are rejected. There were no differences in the amount of thermal stress on the human participants across all immersion ensembles and the thermal manikin only measured a small difference (<5%) in clo values between the ensembles. However, even though there were no significant differences detected in total MSHL, T , and clo values (Figures 3, 6 and 11), there were significant differences found when a comparison was made between the torso and limbs regions across all the ensembles (Figures 5, 7, 8, 12, and 13). NEMO also measured a difference in clo value greater than 10% in the torso region of the HB ensemble compared to MB (Table IV). These significant differences between regional locations indicate that changes in the regional insulation values were detected by NEMO and did have an effect on the thermal response of the participants.
There was partial agreement between the participants and NEMO with regard to regional MSHL. There were no significant differences in MSHL in the torso across all immersion ensembles for the participants (Figure 4), while NEMO measured 45.3 W·m-2 of MSHL in the torso for the HB ensemble, compared to 51.1 W·m-2 in Control, and 55.5 W·m-2 in MB (Table III). NEMO detected a 23% increase in MSHL in the torso between HB and MB while the participants experienced no significant difference. Since MSHL was measured near the end of the immersion, conductive pathways for heat loss had been established to the “core” of the body by this time so it is not surprising that there was little difference in the measurements. This
conductive pathway allowed heat to flow from the warm “core” of the body, through unperfused skin and muscle, the immersion ensemble, and into the water.
Contrary to the torso region, the participants did experience a significant difference in MSHL in the limbs across the immersion ensembles. MSHL for the limbs was significantly greater in the HB ensemble compared to both Control and MB (Figure 5). Similar to the participants NEMO also measured a greater amount of heat flow in the limbs for the HB ensemble compared to the MB, however this was a small increase (approximately 6%). For both the participants and NEMO, the extra insulation around the limbs in the MB ensemble, compared to HB, was successful in reducing heat loss in the region.
The change in total T across all ensembles was almost equivocal for the human participants, resulting in no significant differences being measured (Figure 6). However, when compared at a regional level significant differences are detected in ∆T . Torso T fell a significantly greater amount in the MB ensemble compared to both Control and HB (Figure 7). Conversely, the T for the limbs fell a significantly greater amount in the HB ensemble compared to MB (Figure 8). These results suggest that the increase in regional insulation for the both the limbs and torso was successful in reducing the fall of T for the area.
Clo values measured by the participants followed a similar trend as ∆T . Total clo value did not differ significantly across all three ensembles (Figure 11), but once broken down into regional sections, significant differences were observed. Both the Control and HB ensembles had a higher torso clo value compared to MB (Figure 12). The clo value for the limbs was significantly higher for the Control and MB ensembles compared to the HB (Figure 13). The regional clo values measured by NEMO did not completely agree with the trend observed with the participants. Similar to the participants, NEMO reported a higher torso clo value for the HB ensemble compared to Control and MB (a 25% increase moving from MB to HB), but the differences for the limbs were almost negligible (Table IV). Even though limbs MSHL was marginally greater in the HB ensemble for NEMO (coupled with a constant skin and water temperature) which should have resulted in a slightly lower clo value for the region for this condition, this did not occur. It is possible that small differences NEMO’s physical position in the tank caused these discrepancies between ensemble tests.
A high level examination of the results for the participants and NEMO (i.e. the total values for each measurement) one could conclude that there were no differences between the immersion ensembles even though there was a 200% increase in neoprene thickness in certain regions (Table II). However when the results are broken down into regional comparisons significant differences were observed. While the absolute differences between the ensembles for each variable are indeed small, they were statistically significant none the less, thereby indicating that the ensembles did have an effect on both the participants and NEMO. Interestingly, both the humans and NEMO behaved in the same fashion: differences were observed between the ensembles at a regional level, but when total values are compared these differences no longer exist. Changing the concentration of insulation over the limbs and torso had a regional effect on the participants, but this did not result in any significant differences in ∆TGI or M which are both
indicators of overall thermal strain (a fall in TGI would indicate uncompensable heat loss; a high
M would indicate a large amount of exertion to maintain deep body temperature). NEMO measured a 26% difference in torso clo value between MB and HB but this variance was not observed in the total clo value reported by it across all three ensembles. Given that all three ensembles weighed the same and there had the same amount of insulative material, these results seem to suggest that concentrating insulation in different areas will not cause a significant difference in the level of thermal strain experienced by humans or the total clo value reported by a manikin.
These findings are not in agreement with those reported by Tipton and Balmi (1996) who found significant differences between their immersion conditions with human participants. When insulation around the torso was reduced through the addition of 500 and 1000 mL of water, the participants in their experiment experienced a significantly greater rate of fall of rectal temperature and oxygen consumption compared to when insulation was reduced over the limbs via water leakage(Tipton and Balmi, 1996). The current study did not find such a difference in the human participants when insulation was concentrated over the limbs compared to the torso, as there were no significant differences in the changes in TGI and M across all ensembles.
There are a few possible reasons as to why these findings differed from those of Tipton and Balmi (1996). First, the immersion suits used in their study were a non-insulated style where the thermal protection was provided by clothing worn underneath the suit. This style of suit is
much more susceptible to the effects of water leakage since the underclothing providing the thermal protection can become easily wetted and saturated resulting in trapped air becoming displaced by water. Water conducts heat 23 times faster than air which means replacing air with water in the underclothing reduces the amount of thermal protection provided. The style of immersion suit used in the current study, and commonly used throughout Canada, is one where thermal protection is built in via an attached inner liner composed of closed cell neoprene. Compared to basic underclothing, closed cell neoprene does not lose as much thermal protection when water leakage is introduced since air is trapped inside the neoprene itself and cannot be displaced by water. The introduction of water underneath the immersion ensembles in the study by Tipton and Balmi (1996) significantly reduced the clo value compared to when there was no leakage (as was the case here).
The method used by Tipton and Balmi (1996) of changing regional insulation via water leakage is another possible reason why the results from their study differ from this one. When water leakage was introduced in their study clo values changed significantly; however in the current study insulation was shifted around by concentrating it in certain areas, while leaving the total amount of dry insulation unchanged, and resulted in clo values that did not change significantly (Table IV). Even though the water temperature of 5°C in the current study was colder compared to that in the one by Tipton and Balmi (10°C), the thermal stress on the participants in the latter was much higher due to the lower clo values of their suits. Tipton and Balmi (1996) reported a clo value of approximately 0.80 clo when their participants were floating at a natural angle with no leakage underneath their suits. In similar conditions in the current study (no leakage; natural flotation angle), the immersion ensembles had a clo value of 1.39 clo as measured by the participants; a 74% increase in clo value compared to the previous work. This higher clo value resulted in decreased thermal stress on the participants thereby allowing them to thermoregulate during the immersions and maintain a stable deep body temperature.
Similar to the human results, the values reported by NEMO differed from those reported by the thermal manikin in the study by Tipton and Balmi (1996). The authors found that when insulation was reduced around the limbs (via water leakage introduced underneath the immersion suit) the manikin reported a lower clo value compared to when insulation was reduced around
the torso. When water was introduced around the torso of the thermal manikin, a loss of insulation of approximately 40% was reported; when the same volume was applied to the limbs it resulted in a decrease of approximately 50%. Comparatively, in the current study, NEMO measured no change in insulation between the Control and the MB ensemble (extra insulation around the limbs; reduced amount around the torso) and only a 3% decrease in total clo value with the HB ensemble (extra insulation around the torso; reduced amount around the limbs). As previously mentioned the difference between adding water to reduce regional insulation compared to moving it to another location may account for these differences.
These differences in the results between the current study and those reported by Tipton and Balmi (1996) can also possibly be explained by the fact that the manikin and humans in the latter study were immersed at a 42° angle relative to the water surface in five out of the six conditions tested. This 42° orientation increased both the total surface area exposed to the water as well as the hydrostatic pressure exerted on this area, thereby decreasing the amount of trapped air underneath the immersion ensembles, and further reducing insulation (Hall and Polte, 1956). This caused the clo value to fall from approximately 0.80 clo to 0.70 clo when moving from a natural (i.e. horizontal) flotation position to 42° below the water surface without the addition of water underneath the immersion suit (Tipton and Balmi, 1996). The participants and manikins in the current study remained floating in a nearly horizontal position (Figures 1 and 2) which exposed a smaller surface area to the water and reduced the overall hydrostatic pressure.
Even though the clo values of the immersion ensembles as measured by the participants in the current study were higher than those measured by NEMO, both found that there were no significant differences between them (Table II). These findings are not in agreement with those reported in a previous study that compared immersed humans and a thermal manikin (Romet et al., 1991). Romet and colleagues found that there were no differences in the clo value between human participants and a thermal manikin in still water except in “Light” suits where there was a 11.1% difference2. When the authors tested the humans and thermal manikins in waves, they found that there was a difference of 37-41.7% in the three categories of suits between the humans and the manikins (Romet et al., 1991). They attributed this difference during the
2
Eleven different suits were used in the study by Romet and colleagues. They were classified as “Heavy”, “Moderate” and “Light” depending on the clo value as measured by the manikin. No description of what exactly comprised a “Light” suit was given.
turbulent condition to the latter being rigid in the waves and acting like a “scoop”. This caused the manikin to dig into the waves, whereas the humans were able to conform to the waves and remained floating on top of them.
A higher clo value was measured with the participants compared to NEMO during the current study for all of the ensembles. The humans had a clo value 28% higher in the Control ensemble; 21% higher in HB; and 17% higher in MB. A possible explanation is that the participants in the study by Romet and colleagues (1991) were immersed in approximately 20°C water compared to the 5°C in this study. The lower water temperature would have created a much larger thermal gradient between the humans and the water, resulting in more thermal stress than would be experienced in 20°C water. While the participants in the current study did not experience a significant change in gastro-intestinal temperature the level of thermal stress experienced during the immersion caused increased strain on the thermoregulatory system as seen by the increased M values at the end of the immersions compared to resting values (Figure 6). T also fell by approximately 4.5°C in all ensembles indicating that skin temperatures dropped from pre-immersion values throughout the tests. These changes in skin temperature and metabolic heat production may be the reason a higher clo value was measured in the current study compared to those reported by Romet and colleagues.
The differences in clo value reported between the manikin in the study by Romet and colleagues and NEMO in the current study is possibly due to water leakage underneath the immersion suit in the former study. Romet and colleagues refer to some water ingress and flushing action (water moving in and out of the suit) that occurred throughout their tests but do no report a specific amount. There was no water leakage underneath any of the immersion suits throughout the current study.
4.2 Correction Factors for Calm Water Testing
The results from the current study suggest that while wearing dry, well insulated immersion suit ensembles humans and thermal manikins respond to changes in regional insulation in a similar fashion. Both groups will detect the regional changes but neither will experience a significant difference in the total thermal protection provided by the ensembles when comparing thermal strain or clo value. Similar to previous bodies of work referenced here,
NEMO reported a higher clo value compared to humans which is expected due to the lack of change in skin temperature in manikins when in use. On average, the participants reported a clo value 1.22 times greater than NEMO. The total clo values reported by NEMO and the participants are given in Table V.
Table V. Total clo values as reported by the participants and NEMO.
Control HB MB Participants (Mean [SD], n = 11) 1.39 [0.16] 1.28 [0.13] 1.28 [0.14] NEMO 1.09 1.06 1.09
Previous work by Power and colleagues investigated the effects of wind, waves, and water leakage on clo values and found that these factors all decreased it by a significant amount compared to being dry inside an immersion suit in calm water (unpublished results). The authors proposed a series of “correction factors” for testing immersion suits in calm water to account for the deleterious effects of wind, waves, and water leakage on clo values. These correction factors would allow for the testing of immersion suits in temperature regulated calm water, while still accounting for the effects of leakage, wind and waves. The close agreement between humans and manikins in the current study could potentially allow for these correction factors to be applied to thermal manikin testing. More specifically, the factors could theoretically allow a clo value to be calculated from calm water tests that would allow for a person to remain in thermal balance with only a moderate amount of strain on the thermoregulatory strain across a range of water temperatures, in wind and waves and with water leakage (unpublished results). The hypothetical clo values reported by the authors can be divided by 1.22 to calculate the clo values that a thermal manikin would need to measure on an immersion ensemble in calm water for a human to remain in thermal balance for a given water temperature and condition. These manikin clo values are given in Figure 14.
Figure 14. Mean predicted clo values, as measured by a thermal manikin in calm water, required to remain in thermal balance for a given water temperature for an individual with a SA of 2.0 m2, a T of 27°C, and a VO of 0.72 L min-1.
The proposed values described in Figure 14 compensate for the effects that wind, waves, and water leakage have on reducing clo values. For example, if there was a requirement for a person to be able to remain in thermal balance in 2°C water with wind and waves, you would test an immersion suit on a manikin in calm water to ensure it had a clo value of 1.60. By obtaining a minimum clo value of 1.60 with the thermal manikin in calm water you would theoretically ensure that there is a sufficient level of thermal protection in an environment with 2°C water, wind and waves. The clo values proposed in Figure 14 are theoretical and should be confirmed and validated via future testing. If validated future immersion suit certification could take place in testing facilities as simple as a tank of water large enough to immerse a thermal manikin. This would provide two large benefits to immersion suit testing: simplified test facilities that do not require the ability to regulate the temperature of the water or generate waves; and not requiring
0 0.5 1 1.5 2 2.5 0 1 2 3 4 5 6 7 8 9 10 11 12 13 14 15 16 17 18 19 20 C lo v a lu e ( c lo ) Water Temperature (°C) Calm
Wind and Waves 500 mL Leakage
Wind and Waves + 500 mL Leakage
human volunteers undertake physically grueling tests to certify the thermal protective properties of the suits.
4.3 Conclusions
The findings from this study suggest that varying the concentration of insulation over different regions of the body will not result in significant differences in the thermoregulatory responses of humans and will result in very little change in clo value as measured by a thermal manikin. These findings are not in agreement with previous work by Tipton and Balmi (1996) who found that reducing the insulation in certain areas will cause significant differences in thermoregulatory responses in humans and clo values as measured by a thermal manikin. While Tipton and Balmi reduced the insulation in their immersion suits by adding water, the current study redistributed the insulative material to concentrate it in different areas. As a result, measured clo values were consistent across all three immersion ensembles and were significantly higher than those reported by the previous authors. It is possible that at higher immersed clo values, similar to those measured in the current study the level of thermal protection provided renders the distribution of insulation an insignificant factor for both humans and thermal manikins. Therefore, future work that uses thermal manikins to measure the insulative properties of immersion suits can be undertaken with increased confidence (provided the clo value is high enough) knowing that the regional distribution of insulation will not significantly affect the humans who may ultimately have to wear the suits during a marine abandonment event.
5.0 Acknowledgements
The first author is extremely grateful to Transport Canada for their financial support of this work. The research team would like to thank Peter Hackett for his hard work and expertise that he provided throughout the test program.
6.0 References
Barwood, M. J. and Tipton, M. J. (2011). Surviving prolonged cold water immersion - An evaluation of immersion dry suit test performace standards. . World Conference on Drowning Prevention. Vietnam. Canadian General Standards Board. (2005). CAN/CGSB-65.16-2005: Immersion Suit Systems.
Ducharme, M. B. and Brooks, C. J. (1998). The effect of wave motion on dry suit insulation and the responses to cold water immersion. Aviat Space Environ Med, 69, 957-64.
Durnin, J. V. and Womersley, J. (1969). The relationship between skinfold thickness and body fat in adults of middle age. J Physiol, 200, 105-106.
Gehan, E. A. and George, S. L. (1970). Estimation of human body surface area from height and weight.
Cancer Chemother Rep, 54, 225-35.
Golden, F. S. C. and Tipton, M. J. (2002). Essentials of Sea Survival. Human Kinetics. Windsor, ON, Canada.
Hall, J. F., Jr. and Polte, J. W. (1956). Effect of water content and compression on clothing insulation. J
Appl Physiol, 8, 539-45.
Hardy, J. D. and DuBois, E. F. (1938). The technic of measuring radiation and convection J of Nutr, 15, 461-75.
International Maritime Organization. (2010). Life-Saving Appliances.
Peronnet, F. and Massicotte, D. (1991). Table of nonprotein respiratory quotient: an update. Can J Sport
Sci, 16, 23-9.
Romet, T. T., Brooks, C. J., Fairburn, S. M. and Potter, P. (1991). Immersed clo insulation in marine work suits using human and thermal manikin data. Aviat Space Environ Med, 62, 739-46.
Tikuisis, P. (1999). Considerations for the measurement and analysis of heat debt for cold exposure. J.
Human-Environ. Sys., 2, 9-18.
Tipton, M. J. and Balmi, P. J. (1996). The effect of water leakage on the results obtained from human and thermal manikin tests of immersion protective clothing. Eur J Appl Physiol Occup Physiol, 72, 394-400.


![Figure 5. Limbs MSHL (W·m -2 ) at the end of the three-hour immersions for each ensemble (n = 11, Mean [SD], ** = P < 0.01)](https://thumb-eu.123doks.com/thumbv2/123doknet/14087952.464339/24.918.265.664.132.443/figure-limbs-mshl-end-hour-immersions-ensemble-mean.webp)

![Figure 7. Change in torso T for each ensemble after the three-hour immersions (n = 11, Mean [SD], * = P < 0.05, ** = P < 0.01)](https://thumb-eu.123doks.com/thumbv2/123doknet/14087952.464339/26.918.258.672.134.461/figure-change-torso-ensemble-hour-immersions-mean-sd.webp)
![Figure 8. Change in limbs T for each ensemble after the three-hour immersions (n = 11, Mean [SD], * = P < 0.05)](https://thumb-eu.123doks.com/thumbv2/123doknet/14087952.464339/27.918.256.672.132.440/figure-change-limbs-ensemble-hour-immersions-mean-sd.webp)
