Publisher’s version / Version de l'éditeur:
Vous avez des questions? Nous pouvons vous aider. Pour communiquer directement avec un auteur, consultez la première page de la revue dans laquelle son article a été publié afin de trouver ses coordonnées. Si vous n’arrivez pas à les repérer, communiquez avec nous à [email protected].
Questions? Contact the NRC Publications Archive team at
[email protected]. If you wish to email the authors directly, please see the first page of the publication for their contact information.
https://publications-cnrc.canada.ca/fra/droits
L’accès à ce site Web et l’utilisation de son contenu sont assujettis aux conditions présentées dans le site LISEZ CES CONDITIONS ATTENTIVEMENT AVANT D’UTILISER CE SITE WEB.
Annual Conference of Transportation Association of Canada [Proceedings], pp. 1-22, 2009-10-18
READ THESE TERMS AND CONDITIONS CAREFULLY BEFORE USING THIS WEBSITE.
https://nrc-publications.canada.ca/eng/copyright
NRC Publications Archive Record / Notice des Archives des publications du CNRC :
https://nrc-publications.canada.ca/eng/view/object/?id=2e6966f0-accc-4eb7-8ac7-836f5a6c56b6 https://publications-cnrc.canada.ca/fra/voir/objet/?id=2e6966f0-accc-4eb7-8ac7-836f5a6c56b6
NRC Publications Archive
Archives des publications du CNRC
This publication could be one of several versions: author’s original, accepted manuscript or the publisher’s version. / La version de cette publication peut être l’une des suivantes : la version prépublication de l’auteur, la version acceptée du manuscrit ou la version de l’éditeur.
Access and use of this website and the material on it are subject to the Terms and Conditions set forth at Measurable performance indicators for roads: Canadian and international practice
http://www.nrc-cnrc.gc.ca/irc
M e a sura ble pe rform a nc e indic a t ors for roa ds: Ca na dia n a nd I nt e rna t iona l Pra c t ic e
N R C C - 5 2 6 9 2
H a a s , R . ; F e l i o , G . ; L o u n i s , Z . ; C o w e F a l l s , L .
O c t o b e r 2 0 0 9
A version of this document is published in / Une version de ce document se trouve dans: Annual Conference of Transportation Association of Canada Best Practices in Urban Transportation Planning: Measuring Change, Vancouver, B.C. October 18-21, 2009, pp. 1-22
The material in this document is covered by the provisions of the Copyright Act, by Canadian laws, policies, regulations and international agreements. Such provisions serve to identify the information source and, in specific instances, to prohibit reproduction of materials without written permission. For more information visit http://laws.justice.gc.ca/en/showtdm/cs/C-42
Les renseignements dans ce document sont protégés par la Loi sur le droit d'auteur, par les lois, les politiques et les règlements du Canada et des accords internationaux. Ces dispositions permettent d'identifier la source de l'information et, dans certains cas, d'interdire la copie de documents sans permission écrite. Pour obtenir de plus amples renseignements : http://lois.justice.gc.ca/fr/showtdm/cs/C-42
Measurable Performance Indicators for Roads:
Canadian and International Practice
Ralph Haas
Center for Pavement and Transportation Technology Department of Civil and Environmental Engineering
University of Waterloo
Guy Felio
Infrastructure Strategies and Research Inc. Rockland, Ontario
Zoubir Lounis
Institute for Research in Construction National Research Council Canada
Lynne Cowe Falls Schulich School of Engineering
University of Calgary
Paper Prepared for Presentation
at the “Best Practices in Urban Transportation Planning: Measuring Change” Session at the 2009 Annual Conference of the
Transportation Association of Canada Vancouver, British Columbia
2
ABSTRACT
Performance indicators are an essential part of modern road asset management. The basic rationale for having measureable performance indicators is that limited availability of resources makes it necessary to allocate these resources as effectively as possible among competing alternatives; moreover, that considerations of safety, capacity, serviceability, functionality and durability are explicitly recognized.
A comprehensive approach to developing performance indicators should consider the basic rationale, a balance in use and reporting, efficiency and effectiveness, a tie to transportation values, objectivity in the measurements used and the stakeholders involved in the development of a framework.
A basic framework for the roads sector which represents a consolidation of international and Canadian practice is presented and consists of:
• General macro-level overview, and
• Detailed level involving: (a) service quality provided to road users, and (b) institutional productivity and effectiveness.
Other examples of performance indicators from OECD, Australia and the United States are also presented.
Performance indicators should be tied to an agency’s policy objectives and to implementation targets or minimum acceptable levels of performance, as described in detail in the paper.
Finally, a comprehensive set of performance indicators for roads, matched to assessment criteria, as part of a new initiative on “Development of a Framework for Assessment of the State, Performance and Management of Canada’s Core Public Infrastructure” are presented.
INTRODUCTION
Performance is a term used in everyday life, in engineering, in economics, and many other areas. It can have a general meaning or a specific meaning. For the latter, and particularly for roads, performance should be a measurable entity. This is in fact essential for assessing the current and future state of road infrastructure, as well as agency/institutional efficiency in service and safety provision to users,
productivity, cost-effectiveness, environmental protection, preservation of investment and other functions.
In practice, however, there is variation in the terminology. It includes performance measures, which is the term used in TAC’s survey of Canadian Road Networks (1), key performance indicators, which is a term originated in Australia for the performance specified road network contracts (2, 3), performance indicators, which is used in the European Harmonization on Performance Indicators in their COST-Action 354 for Road Pavements (4), and others. The usage herein is the term performance indicators, which accords with other references (3, 5, 6, 7, 8), and with World Bank performance based contracting (PCB) practices (9). In essence though, performance measures, performance indicators and key performance indicators have been used commonly and interchangeably in the roads sector.
The overall purpose of this paper is to describe the role of performance indicators in modern road asset management. More specifically, the basic objectives of performance indicators are identified, the importance of stakeholder involvement and needs are discussed as well as the need to achieve balance efficiency and relation to transportation values in using performance indicators. A framework for
3
performance indicators is defined, international and Canadian examples are presented and a process for linking policy objectives with performance indicators is suggested.
OBJECTIVES OF PERFORMANCE INDICATORS
While transportation agencies often provide extensive performance data on their websites, actual practice among these agencies is a relatively limited use of performance indicators (5). A more comprehensive view would consider the following: rationale or objectives of performance indicators; stakeholders involved; balancing the use and reporting of performance indicators; efficiency and effectiveness related to performance indicators; tying transportation values to performance indicators; objectivity in performance indicators, and a framework for performance indicators and linking policy objectives to performance indicators. Subsequent sections address these items in more detail, and are based largely on work ranging from early developments in the 1990’s to current status [1, 2, 5, 7, 20].
The underlying rationale for having performance indicators or measures is that the limited availability of resources for road infrastructure makes it necessary to allocate these resources as efficiently as possible among competing alternatives. Consequently, any framework for
performance indicators should be comprehensive enough to incorporate functional, technical, environmental, safety, economic and institutional considerations.
More specifically, the objectives of performance indicators include the following:
• Assessment of physical condition (in terms of level of service provided to road users, such as smoothness, structural distress such as cracking, structural adequacy such as the capacity to carry a specified number of loads, surface friction as related to safety, and various other (usually qualitative) condition measures related to culverts, signs, fences, curb and gutter, etc. such as good, fair or poor)
• Determination of asset value, which can vary with accounting base (e.g., financial or management accounting) and with valuation method [21].
• A monitoring mechanism for assessing policies in terms of their effectiveness and/or compliance with predefined policy objectives
• Provision of information to users or customers
• Use as a resource allocation tool in terms of quantifying the relative efficiency of investments across competing alternatives
• Diagnostic use for early identification of accelerated deterioration of assets and for appropriate remedial actions.
In essence a suite of performance indicators must provide, to all stakeholders, a balanced view of the overall efficiency and effectiveness of the transportation system, in terms of a full range of values, in a way that is objective and economical.
4
The use of performance indicators depends very much on the stakeholders involved and their interests or requirements. Figure 1 identifies the major groups of such stakeholders relevant to the roads sector. Measurable performance indicators are also based on data collection.
The reality of current practice, however, is that data collection varies in purpose, reliability, frequency, precision and extent, often with different referencing systems or bases (although a common GIS platform and relational databases implemented by a number of agencies are addressing this latter issue). Thus, there is a clear need for a consistent and comprehensive framework, which incorporates and integrates the performance measures relevant to various users and applications.
Stakeholder Groups
Stakeholder Groups
PERFORMANCE I NDI CATORS
PERFORMANCE I NDI CATORS
Private Users of Roads ( cars, motorcyclists, etc.)
Commercial Road Users ( trucking and bus firms, goods shippers, etc.)
Policy Sector ( regulators, enforcers,
collectors, etc.) Road
Netw ork Service Providers ( ow ners, investors, managers,
operators, materials supplies, etc.) Demands for Service
Demands for Service
( comfort, safety, mobility,
( comfort, safety, mobility,
accessibility, price) accessibility, price) Provision of Provision of efficient efficient infrastructure infrastructure Provision of Provision of efficient efficient infrastructure infrastructure
Figure 1 Stakeholders Involved With Performance Indicators for Roads Ref. [5] BALANCE, EFFICIENCY AND EFFECTIVENESS
Balance in the use of performance indicators is achieved in several ways:
• Each of the major transportation values (see Section to follow) has roughly the same number of performance statistics and the same level of detail.
• The statistics are understandable and meaningful to the stakeholders.
• Major stakeholders should have their key interests represented in the performance indicators.
Cost, performance, service delivery and safety are front and centre in most transportation decision-making. Regarding cost vis a vis the other three items, they are tied together in one of the following ways:
5
• Accomplishing a performance service delivery or safety objective for the least possible cost requires a maximization of efficiency, or
• Gaining the highest possible level of performance, service delivery or safety for a given funding constraint requires maximizing effectiveness.
Certain performance indicators or measures work best as targets in a cost minimization framework, while others are more suitable in an effectiveness maximization framework.
When a performance indicator is objectively measurable at the individual facility level, it may be a suitable implementation target for level-of-service standards (eg., in bridge
management), or minimum acceptable condition levels (eg., in pavement management). PERFORMANCE INDICATORS VIS A VIS TRANSPORTATION VALUES AND OBJECTIVITY
Performance indicators should be tied directly to the expectations of the transportation system, in terms of transportation values since transportation involves a derived demand. Most transportation values are negative by their nature. For example, road users wish to minimize travel time and minimize the risk of injuries.
The following is an example list of transportation values, with common units of measure, drawn from various documents cited in the references.
• Safety - Injuries and/or fatalities per unit of transportation (e.g. per trip, per bridge crossing, or per 100 million vehicle km)
• Mobility and Speed – Delays; congestion; average travel speed; closures and detours • Reliability - Standard deviation of trip time; standard deviation of link speed
• Environmental protection – Atmospheric levels of carbon monoxide, ozone, nitrous oxides and particulates
• Productivity – Units of transportation per unit of cost.
• User benefits – Cost reduction of accidents; travel time reduction; vehicle operating cost reductions
• Asset value – Rate of depreciation
• Comfort/convenience – Road smoothness
• Program delivery – Project delays; funding; traffic delays due to works
• Operational effectiveness – Response time to incidents, claims due to potholes or guardrail damage, response time to public complaints/inquiries
An objective performance indicator is one whose definition and measurement all stakeholders (including the general public) can agree upon. Depreciation is a good example of the important of objectivity. To the accounting community, depreciation is an objective concept, a way of fairly valuing the assets of an organization. However, the engineering community for example uses life cycle costing to evaluate the performance of major constructed assets, and for deciding on maintenance and improvement needs. This group feels that conventional depreciation
6
As another example, in pavement management, the International Roughness Index (IRI) is a commonly- used primary measure of riding comfort, and a secondary measure that affects the values of travel time and user cost. But the public mainly notices the discomfort. Policy-makers can easily misunderstand a presentation of IRI as mainly a measure of ride comfort, and under-value the economic implications unless the transportation under-values of travel time and user cost are also presented. Thus, even though the IRI is objectivity measured, its misuse can cause its objectivity to be lost.
INTERNATIONAL AND NATIONAL EXAMPLES OF PERFORMANCE INDICATORS The U.S. Federal Highway Administration, FHWA, carries out periodic foreign “scans” of technology, practices, etc., including in 2004 an international scan by a delegation of
professionals visiting Australia, New Zealand, Japan and Canada [19]. Among the findings were that performance measures for safety were very important but that the use of indicators to
measure performance on environmental aspects was the most challenging.
An OECD expert group carried out a study of performance indicators for the roads sector in 1997 [16], and a field test in 2000 to better define selected indicators [20]. This study revealed similarities, at least in broad categories, with Canada and the United States. The field test by OECD [20], as well summarized in Ref. [1] involved the following performance measures (note the interchangeably of terms in both the FHWA and OECD studies):
• Average road user cost (rural and urban)
• Level of satisfaction re travel time, reliability and quality of road user information (market survey, scale of 1 to 10)
• Protected road user risk re fatalities (found that more specific indicators should be developed)
• Unprotected road user risk re pedestrians, cyclists and motorcyclists (comparison of fatalities to number of registered vehicles)
• Environmental policy/programs (found that more measurable indicators should be developed)
• Market research and customer feedback (caution about phrasing questions)
• Long term programs (yes/no indicator – useful to management in achieving goals) • Allocation of resources (yes/no indicator re existence of a relevant system)
• Quality management/audit programs (yes/no indicator re existence of a system) • Forecast values of road user costs vs. actual costs (useful indicator re road
administration’s management effectiveness)
• Overhead percentage (fixed costs/total costs – indicator of road administration’s cost-effectiveness)
• Value of assets (indicator of net economic value of road infrastructure – but caution about different ways of calculating value)
• Roughness (IRI is widely used indicator – relates to pavement quality, travel cost and user satisfaction)
7
• Satisfaction with the road system (broad indicator of road users overall satisfaction). The Canadian survey in Ref. [1] states that “Outside of Europe and North America, arguably the most ambitious application of performance measurement exists in Australia and New Zealand”, which is certainly reinforced by experience of the writers of this paper. In total, 72 performance indicators in ten categories were originally selected to represent the economic, social, safety and environmental performance of the road sector [18]. Work is underway, however, by Austroads on replacing and/or abandoning a number of these indicators.
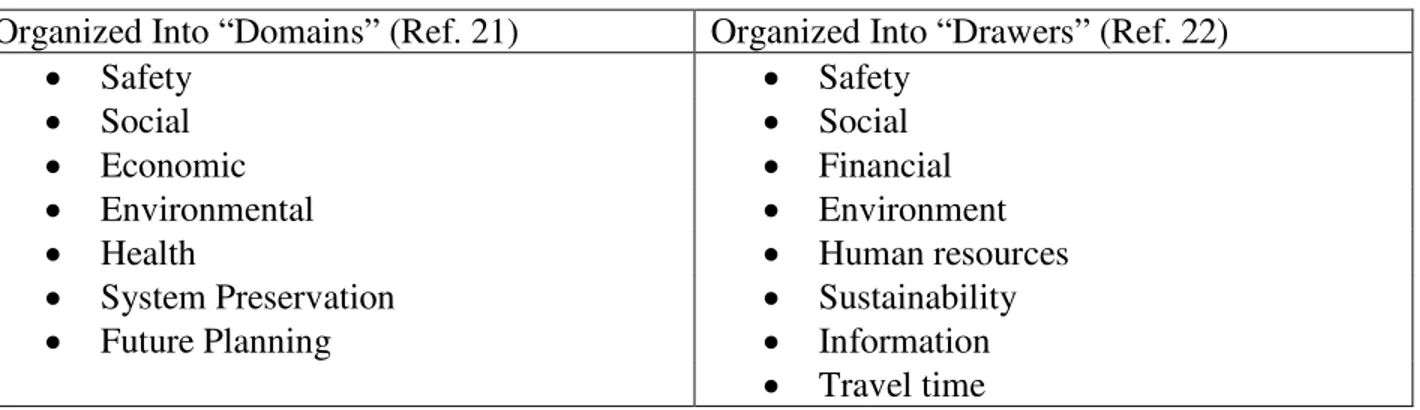
Two somewhat complementary frameworks for organizing non-technical performance indicators are described in Ref. [21] and Ref. [22]. The former, based on a literature review, organized the indicators in “domains”, while Ref [22], based on the work of a PIARC (World Road Association) Committee organizes the indicators into “drawers”. Table 1 provides a comparative listing. There are obvious similarities, but it is interesting to note that travel time seems unique in Ref. [22].
Table 1 Comparative Listing of Organizational Frameworks for Non-Technical Performance Indicators
Organized Into “Domains” (Ref. 21) Organized Into “Drawers” (Ref. 22)
• Safety • Safety
• Social • Social
• Economic • Financial
• Environmental • Environment
• Health • Human resources
• System Preservation • Sustainability
• Future Planning • Information
• Travel time
The basic framework for performance indicators or measures should incorporate the objectives previously identified, as well as the stakeholder requirements, efficiency of the road network service providers, and effective actions by the policy sector (see Figure 1).
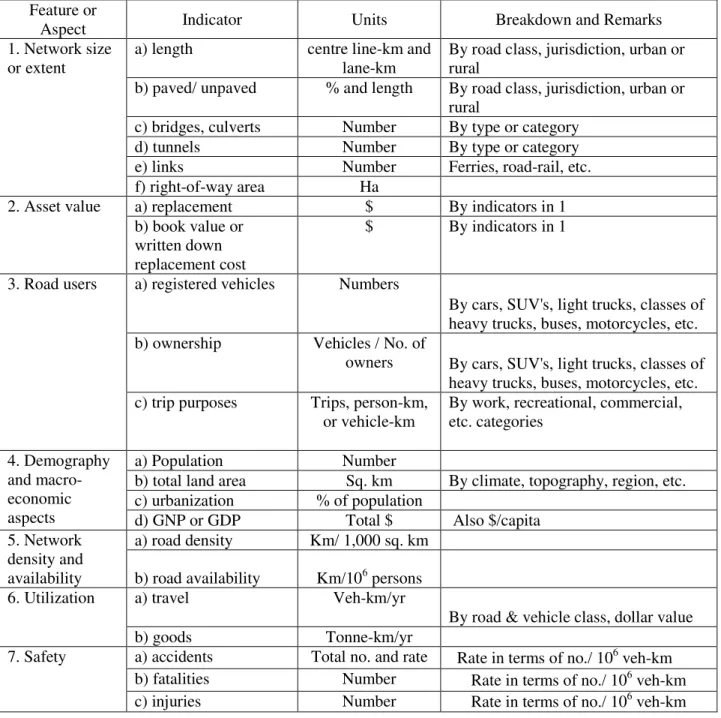
A framework of performance indicators for roads, adapted from Ref. [6, 10, 12, 23] consists of the following two basic levels:
• General performance indicators for road assets, providing an overview or macro-level view usually contained in public statistics (see Table 2). In terms of Figure 1, these indicators would be of use primarily to the Road Network Service Providers and the Policy Sector groups of stakeholders.
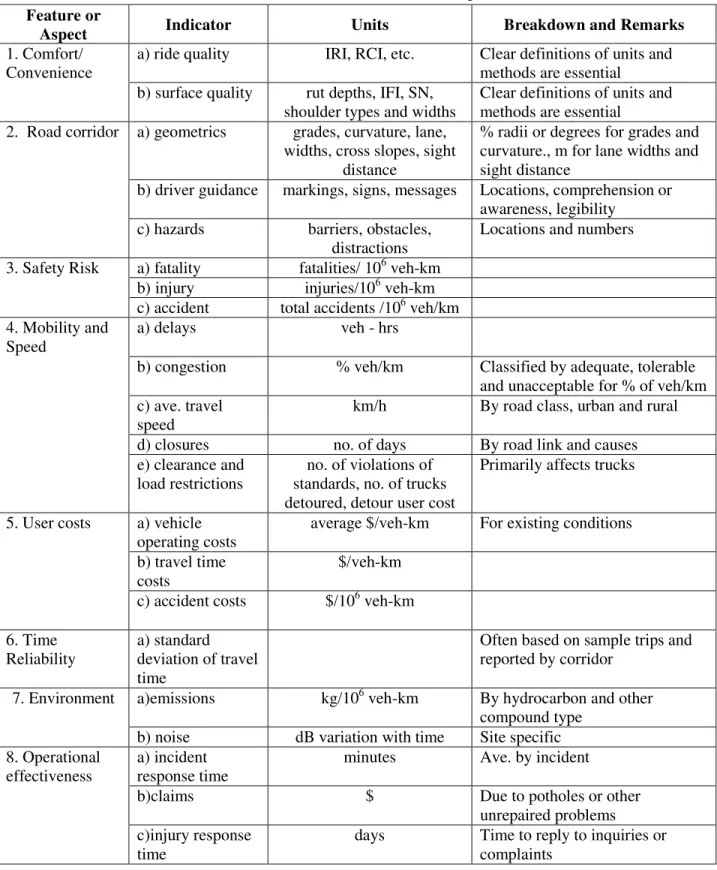
• Detailed objective performance indicators for:
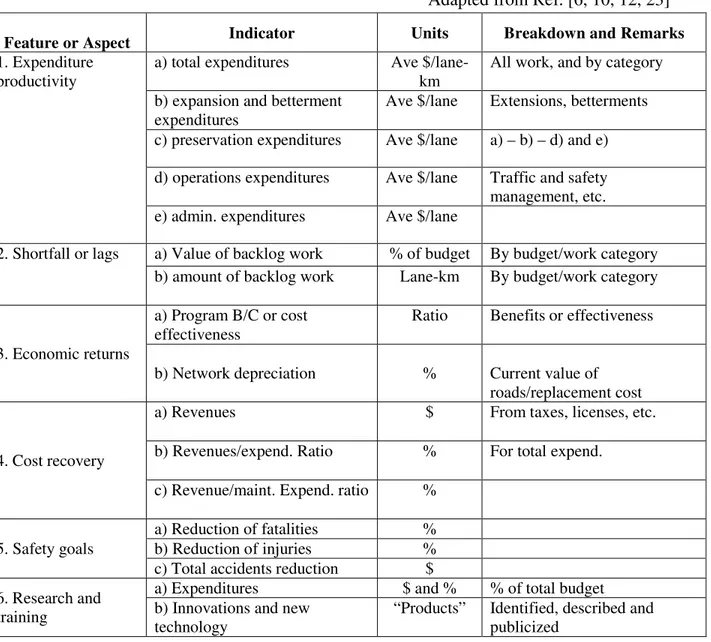
o Service quality provided to road users (see Table 3) o Institutional productivity and effectiveness (see Table 4)
8
Table 2: General, macro-level performance indicators for key road assets
Adapted from Ref. [6, 10, 12, 23]
Feature or
Aspect Indicator Units Breakdown and Remarks 1. Network size
or extent
a) length centre line-km and lane-km
By road class, jurisdiction, urban or rural
b) paved/ unpaved % and length By road class, jurisdiction, urban or rural
c) bridges, culverts Number By type or category d) tunnels Number By type or category e) links Number Ferries, road-rail, etc. f) right-of-way area Ha
2. Asset value a) replacement $ By indicators in 1 b) book value or
written down replacement cost
$ By indicators in 1
3. Road users a) registered vehicles Numbers
By cars, SUV's, light trucks, classes of heavy trucks, buses, motorcycles, etc. b) ownership Vehicles / No. of
owners By cars, SUV's, light trucks, classes of heavy trucks, buses, motorcycles, etc. c) trip purposes Trips, person-km,
or vehicle-km
By work, recreational, commercial, etc. categories 4. Demography and macro-economic aspects a) Population Number
b) total land area Sq. km By climate, topography, region, etc. c) urbanization % of population
d) GNP or GDP Total $ Also $/capita 5. Network
density and availability
a) road density Km/ 1,000 sq. km
b) road availability Km/106 persons 6. Utilization a) travel Veh-km/yr
By road & vehicle class, dollar value b) goods Tonne-km/yr
7. Safety a) accidents Total no. and rate Rate in terms of no./ 106 veh-km b) fatalities Number Rate in terms of no./ 106 veh-km c) injuries Number Rate in terms of no./ 106 veh-km
9
Table 3: Indicators of service quality provided to road users
Adapted from Ref. [6, 10, 12, 23] Feature or
Aspect Indicator Units Breakdown and Remarks
1. Comfort/ Convenience
a) ride quality IRI, RCI, etc. Clear definitions of units and methods are essential
b) surface quality rut depths, IFI, SN, shoulder types and widths
Clear definitions of units and methods are essential
2. Road corridor a) geometrics grades, curvature, lane, widths, cross slopes, sight
distance
% radii or degrees for grades and curvature., m for lane widths and sight distance
b) driver guidance markings, signs, messages Locations, comprehension or awareness, legibility
c) hazards barriers, obstacles, distractions
Locations and numbers
3. Safety Risk a) fatality fatalities/ 106 veh-km b) injury injuries/106 veh-km c) accident total accidents /106 veh/km 4. Mobility and
Speed
a) delays veh - hrs
b) congestion % veh/km Classified by adequate, tolerable and unacceptable for % of veh/km c) ave. travel
speed
km/h By road class, urban and rural
d) closures no. of days By road link and causes e) clearance and
load restrictions
no. of violations of standards, no. of trucks detoured, detour user cost
Primarily affects trucks
5. User costs a) vehicle operating costs
average $/veh-km For existing conditions
b) travel time costs
$/veh-km
c) accident costs $/106 veh-km
6. Time Reliability
a) standard deviation of travel time
Often based on sample trips and reported by corridor
7. Environment a)emissions kg/106 veh-km By hydrocarbon and other compound type
b) noise dB variation with time Site specific 8. Operational
effectiveness
a) incident response time
minutes Ave. by incident
b)claims $ Due to potholes or other unrepaired problems c)injury response
time
days Time to reply to inquiries or complaints
10
Table 4: Indicators of institutional productivity and effectiveness
Adapted from Ref. [6, 10, 12, 23]
Feature or Aspect Indicator Units Breakdown and Remarks
1. Expenditure productivity
a) total expenditures Ave $/lane-km
All work, and by category
b) expansion and betterment expenditures
Ave $/lane Extensions, betterments
c) preservation expenditures Ave $/lane a) – b) – d) and e)
d) operations expenditures Ave $/lane Traffic and safety management, etc. e) admin. expenditures Ave $/lane
2. Shortfall or lags a) Value of backlog work % of budget By budget/work category b) amount of backlog work Lane-km By budget/work category
3. Economic returns
a) Program B/C or cost effectiveness
Ratio Benefits or effectiveness
b) Network depreciation % Current value of roads/replacement cost
4. Cost recovery
a) Revenues $ From taxes, licenses, etc.
b) Revenues/expend. Ratio % For total expend.
c) Revenue/maint. Expend. ratio %
5. Safety goals
a) Reduction of fatalities % b) Reduction of injuries %
c) Total accidents reduction $ 6. Research and
training
a) Expenditures $ and % % of total budget b) Innovations and new
technology
“Products” Identified, described and publicized
The second level framework generally incorporates those performance indicators which are measured and/or reside in a corporate/agency database, with Alberta being an excellent working example [15]. While suggested units of measure representing common practise are provided in Tables 2 to 4, standardization does not exist.
LINKING PERFORMANCE INDICATORS TO POLICY OBJECTIVES
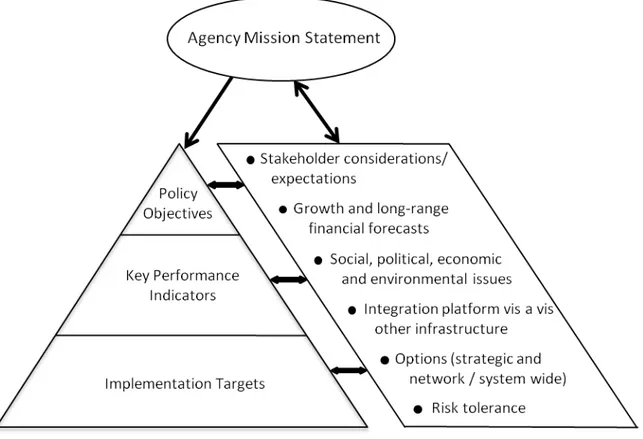
If performance indicators are to be practical and useable by a transport agency, they should be linked to realistic policy objectives. A hierarchical structure for this development is provided in Figure 2 [24]. It suggests first that policy objectives should be based on or fit with the agency’s mission statement. Almost all road agencies provide this on their websites; for example, the B.C. Ministry of Transportation’s Mission states:
11
“To maintain and improve the provincial highway system, ensuring the safe and efficient movement of people and goods, provincially, nationally and internationally.”
The development of realistic policy objectives for road asset management should be focused on the following main aspects [24]:
• Consider the interests of stakeholders and other relevant factors
• Use quantifiable performance indicators for controlling the quality of service delivered to the user
• Establish achievable implementation targets
Individual road agencies might use only a subset of policy objectives and indicators, depending on their resources, size, location and specific conditions or requirement.
An example set of realistic policy objectives and associated performance indicators is provided in Table 5. This represents a consolidation of existing information into a more practical or useable format for road agencies. Also provided are sample implementation targets, adapted from Ref. [25]. It has been shown in Ref. [25] and Ref. [26] that these targets are achievable for a provincial road network and for a long term performance based network contract in Australia.
Figure 2 Hierarchical Structure Linking Policy Objectives to Performance Indicators and Implementation Targets
12
Table 5 Suggested Institutional Policy Objectives, Performance Indicators and Example
Implementation Targets Adapted from Ref. [24]
Policy Objectives Performance Indicators Implementation Targets
1- Quality of Service to Users • Network level of service (smoothness, functionality and utilization) - % good, fair and poor
• Provision of mobility
(average travel speed by road class)
• Annual user costs ($/km)
• Maintain at 90% or greater of Network in Fair or Better Category (IRI ≤ 2)
• Greater than 50% of speed limit
• Total user costs/total network km increase at no more than CPI
2- Safety Goals • Accident reductions (%) • Reduction of fatalities and injuries by 1% or greater annually
3- Preservation of Investment • Asset value of road network ($)
• Increase (written down replacement cost) annually of 0.5% or greater
4- Productivity and efficiency • Cost effectiveness of programs (ratio) • Annual turnover (%)
• 1% or greater annual increase • 5% or less annually
5- Cost recovery ($) • Revenues • Annual increase at no less than rate of inflation
6- Research and Training • Expenditures (% of budget) • Annual commitment of 2.5% of total program budget 7- Communication with
stakeholders
• Satisfaction survey sampling (%)
• Greater than 75% of
respondents satisfied or very satisfied
8- Resource conservation and environmental protection
• Recycling of reclaimed materials (asphalt, concrete, etc) - %
• Monitoring of emissions
• Maintain at 90% or greater • Maintain at levels < 90% of
standards 9- Bridges • Remaining life (years
• Safety
• No bridge with remaining life less than 5 years • Comprehensive programme
of periodic inspections to identify any risk
13
MINIMUM ACCEPTABLE LEVELS
Minimum acceptable levels of performance can be characterized particularly in performance based contracts, PCB’s, as described extensively in World Bank Literature (see Ref. [9] and www.worldbank.org/transport/roads/resource-guide/Docs). In Canada, most provincial road agencies have privatized their maintenance, with quite a variance in the actual performance requirements. Regarding performance measures or indicators in use, this has been well reported in the survey of Ref. [1]. However, their applicability ranges from contracted maintenance to capital works contracts to safety to accessibility/mobility, etc., etc.
The application of minimum acceptable levels of performance can be achieved through implementation targets (see Table 5) on performance indicators. For example, the
implementation target in Table 5 for service to users is to maintain 90% or greater of the network at an IRI level of ≤ 2.0/km. In Ref. [25], the maximum levels of IRI are categorized as follows:
• IRI ≤ 1.0 Excellent • 2.0 ≥ IRI > 1.5 Fair • 1.5 ≥ IRI > 1.0 Good • IRI > 2.0 Poor
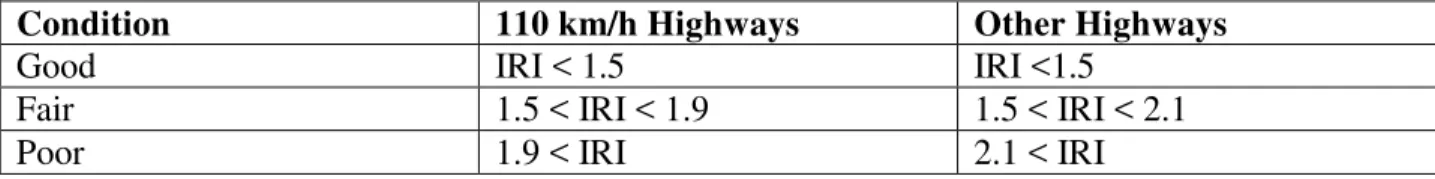
By comparison, the Province of Alberta sets the levels on IRI [15] shown in Table 6. Table 6 Province of Alberta Levels on IRI
Condition 110 km/h Highways Other Highways
Good IRI < 1.5 IRI <1.5
Fair 1.5 < IRI < 1.9 1.5 < IRI < 2.1
Poor 1.9 < IRI 2.1 < IRI
The State of Michigan, as part of its system preservation efforts, carries out a time line projection of pavement condition in terms of the percent “good”, as illustrated in Figure 3 [27]. While Fig. 3 does not contain minimum levels of performance, the 95% and 85% goals used are similar in concept to the Implementation Targets of Table 5.
14
Figure 3 Pavement Condition Tracking in Michigan
After Ref. [27]
In the United States, Virginia passed a Public – Private Transportation Act in 1995 to facilitate design, build, maintain and operate roads. The first contract involving 250 center-line miles of Interstate Highways and a total price of $131.6 million for a period of 5 ½ years was awarded in 1996. The contractor and state agreed on performance standards (in essence, their terminology for performance indicators) for each asset in 7 groups, with a tolerance level of acceptance. A unique aspect in this privatization is that the contractor functions like a mini surrogate road authority in that it does the asset management with all the work being carried out through subcontracts. Currently, Virginia’s “Turnkey Asset Management Services” (TAMS) contract, for about 320 km of interstate highways, for a period of 5 years beginning in April, 2008, involves 12 groups of assets and includes the following performance criteria for pavement surfaces (www.virginiadot.org/projects/constSTAN-181-overview.asp):
Concrete Asphalt
• Outcome: safe, durable, smooth • Outcome: Safe, durable, smooth
• Target: 95% • Target : 95%
• Criteria: no potholes, <10% area with cracks > ½ in. wide, <25% area with spalling 1 in. deep, <25% of joint material missing
• Criteria: no potholes, patches < ¼ in. higher or lower than surface
• Timelines: temporary repair to potholes immediately, permanent repairs within 30 days, removal of safety hazard obstructions immediately
• Timelines: temporary repairs to potholes immediately, all other repairs within 30 days, removal of safety hazard obstructions immediately
15
Various other countries have developed operational performance criteria/ standards/ targets. Examples from around the world can be obtained from the World Bank
(www.worldbank.org/transport/roads/resource-guide/Docs)
The Australian and New Zealand experience, starting in the mid 1990’s, has shown that realistic criteria/ targets are achievable for network wide PBC’s, as subsequently described. For example, the original New South Wales (NSW) 10 year contract involved the following basics for the pavement part of the network [2]:
1. General
• 2115 lane-km, 60% flexible and 40% rigid and composite
• Maintenance includes: (a) repairs, (b) corrective maintenance, (c) preventive maintenance and rehabilitative maintenance including reconstruction where appropriate
• Asset value, written down replacement cost basis, $700 million Australian, in 1996 • Pre-contract benchmark measurements included video log record of entire network,
roughness, skid, rutting and surface distress survey, deflection survey on 80 lane-km of most badly cracked sections and structural thickness from the Road Transport Authority Records (in 1995)
2. Periodic Data collection by the Contractor’s Engineering Consultant • Benchmark measurements noted above
• Roughness, video log and surface distress in 1996 and annually thereafter • Skid measurement spot checks only in 1996 and thereafter
• Deflection only for project level design after the benchmark measurements
• Equivalent single axle load (ESAL) estimates calculated from AADT, % commercial vehicles and truck factor
The contractor’s warranties, termed performance guarantees in the 1995 NSW contract, included the following:
• Annual increase in asset value (up to 4%)
• No flexible section with an International Roughness Index (IRI) of greater than 4.5 and no rigid/ composite section with an IRI greater than 5.5
• At the completion of the contract, not more than 10 % of Class 1 & 2 links ( arterials and collectors) in the network would have more than 10% fatigue cracking, and not more than 15% of Class 2 links would have more than 10% fatigue cracking.
• No arterial section with greater than 12 mm rut depth and no collector section with greater than 15 mm rut depth
• No section with less than 10 years of remaining structural life at the end of year 10. The success of what were considered in 1996 to be realistic performance criteria can be assessed by whether they were actually achieved. For example, in the NSW 10 year contract
16
preciously noted, the weighted network roughness decreased from an IRI of 2.57 in 1996 to 2.52 in 2006 [2]. This would indicate a small but still an increase in asset value. In a more detailed sense, there were substantial improvements in rutting, cracking and structural capacity, as described in detail in Ref. [26].
NEW INITIATIVES
A major new initiative is represented by a collaborative project between Engineers Canada and the National Research Council Canada on “Development of a Framework for the Assessment of the State, Performance and Management of Canada’s Core Public Infrastructure” (CPI). The CPI in this project includes roads, bridges, transit, potable water and storm/waste water systems.
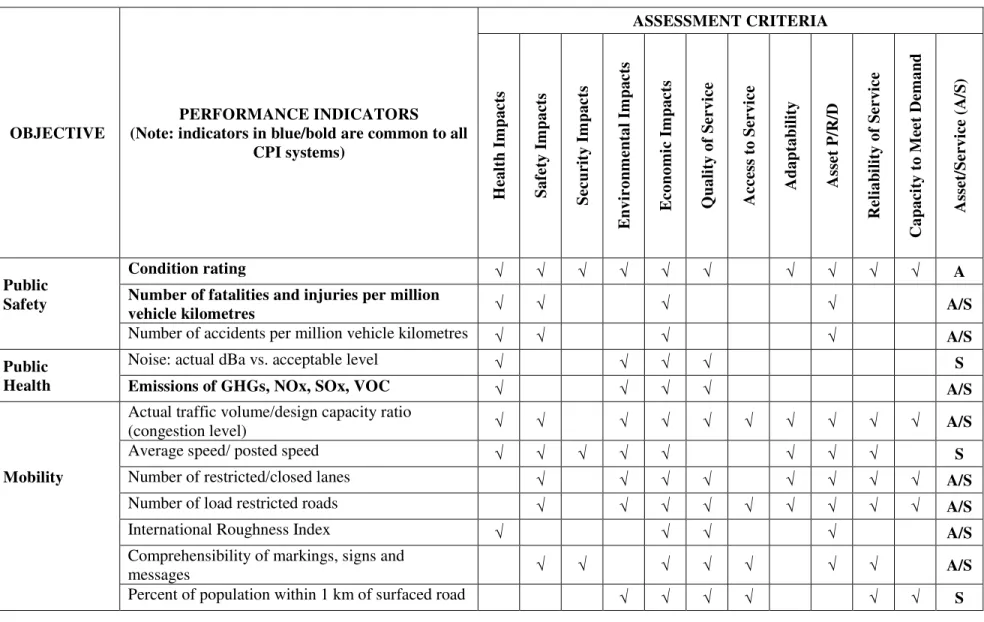
The first phase, development of the framework, was carried out in 2008, with the second phase, implementation, scheduled to begin in 2009. Regarding the roads sector, an initial list of 32 key performance indicators has been identified and matched to 12 assessment criteria, as shown in Table 7 [28, 29]. Further work on developing/adding/modifying, and providing
recommendations on adapting to agency size, needs and resources will likely occur in the second phase of the project.
Table 7 Key Performance Indicators for Roads
After Ref. [28, 29]
OBJECTIVE
PERFORMANCE INDICATORS (Note: indicators in blue/bold are common to all
CPI systems) ASSESSMENT CRITERIA H ea lt h Im p a ct s S af e ty I m p ac ts S ecu ri ty Im p a ct s E n vi ron m en tal Im p a ct s E con om ic I m p a ct s Q u al it y of S e r v ic e A ccess t o S erv ice A dap tab il it y A sset P /R /D R e liab il it y of S e r v ic e C ap ac it y t o M ee t D em an d A sset /S er vi ce ( A /S ) Public Safety Condition rating √ √ √ √ √ √ √ √ √ √ A
Number of fatalities and injuries per million
vehicle kilometres √ √ √ √ A/S
Number of accidents per million vehicle kilometres √ √ √ √ A/S
Public Health
Noise: actual dBa vs. acceptable level √ √ √ √ S
Emissions of GHGs, NOx, SOx, VOC √ √ √ √ A/S
Actual traffic volume/design capacity ratio
(congestion level) √ √ √ √ √ √ √ √ √ √ A/S
Average speed/ posted speed √ √ √ √ √ √ √ √ S
Mobility Number of restricted/closed lanes √ √ √ √ √ √ √ √ A/S
Number of load restricted roads √ √ √ √ √ √ √ √ √ A/S
International Roughness Index √ √ √ √ A/S
Comprehensibility of markings, signs and
messages √ √ √ √ √ √ √ A/S
18 Table 7 Continued
OBJECTIVE
PERFORMANCE INDICATORS (Note: indicators in blue/bold are common to all
CPI systems) ASSESSMENT CRITERIA H ea lt h Im p a ct s S af e ty I m p ac ts S ecu ri ty Im p a ct s E n vi ron m en tal Im p a ct s E con om ic I m p a ct s Q u al it y of S e r v ic e A ccess t o S erv ice A dap tab il it y A sset P /R /D R e liab il it y of S e r v ic e C ap ac it y t o M ee t D em an d A sset /S er vi ce ( A /S )
Mobility Number of days of snow and/or ice free surface √ √ √ √ √ S
Condition rating √ √ √ √ √ √ A
Environmental Quality
Vehicle emissions √ √ √ √ S
Emissions of GHGs, NOx, SOx, VOC √ √ √ √ A/S
Energy use √ √ √ A/S
Vehicle noise (dBa vs. time) √ √ √ S
Protection against climate change impacts √ √ √ √ √ √ √ √ √ A
Use of recycled materials √ √ √ √ A
Materials consumption √ √ √ √ √ A
Social Equity
Percent of population within 1 km of surfaced road
(Accessibility by road class) √ √ √ √ √ A/S
Vehicle operating costs √ √ √ √ √ S
Annual accident costs √ √ √ √ √ A/S
Economy
Benefit/cost ratio √ √ √ √ √ √ √ √ A/S
Total costs/capita √ √ √ A/S
19 Table 7 Continued
OBJECTIVE
PERFORMANCE INDICATORS (Note: indicators in blue/bold are common to all
CPI systems) ASSESSMENT CRITERIA H ea lt h Im p a ct s S af e ty I m p ac ts S ecu ri ty Im p a ct s E n vi ron m en tal Im p a ct s E con om ic I m p a ct s Q u al it y of S e r v ic e A ccess t o S erv ice A dap tab il it y A sset P /R /D R e liab il it y of S e r v ic e C ap ac it y t o M ee t D em an d A sset /S er vi ce ( A /S ) Economy
Cost- Effectiveness of programs √ √ √ A/S
Impact on business relocation, productivity or
expansion √ √ √ S
Asset value √ √ A
Public Security
Protection against deliberate acts √ √ √ √ √ √ √ √ √ √ A/S
CONCLUSIONS
• A comprehensive approach to developing performance indicators/measures should consider the basic rationale, a balance in their use and reporting, efficiency and
effectiveness, a tie in to transportation values, objectivity in the measurement used, and the stakeholders involved in development of a framework.
• A basic framework which represents a consolidation of international practice for the roads sector is suggested to consist of the following two levels:
o General, macro-level overview, and
o Detailed level involving: (a) service quality provided to road users, and (b) institutional productivity and effectiveness
• Other examples of performance measures/indicators for roads include recent work by OECD, Austroads, United States (Virginia and Michigan) and others.
• Performance indicators should be linked to policy objectives and to implementation targets or minimum acceptable levels of performance, sometimes termed performance criteria and/or benchmarks and/or compliance measures.
REFERENCES
1. TAC “Performance Measures for Road Networks: A Survey of Canadian Use”, Rept. Prepared for Transport Canada by Transp. Assoc. of Canada, March 2006
2. Yeaman, John, “Critical Review of Performance Specified Maintenance After Ten Plus Years”, Paper Presented at Transp. Res. Board Annual Conf., Washington, D.C., Jan., 2006 3. Haas, Ralph and Chris Raymond, “Long Term Performance Specified Contracts for Road
Networks”, Proc., Annual Conf. of the Transp. Assoc. of Canada, St. John, New Brunswick, Sept. 1999
4. Weninger-Vycudil, Alfred,” COST 354 – European Harmonization on Performance
Indicators In Road Pavements”, Proc., 7th Int. Conf. on Managing Pavement Assets, Calgary, June 2008
5. Haas, Ralph, Lynne Cowe Falls and Susan Tighe (2003), “Performance Indicators for Properly Functioning Asset Management Systems”, Proc., 21st ARRB and 11th REAAA Conference, Cairns, Australia, May 2003
6. Haas, Ralph, Lynne Cowe Falls and Susan Tighe (2007), “Quantifiable Performance Indicators for Managing Road Assets,” Proc., Annual Conf. of Can. Society for Civil Engineering, Yellowknife, June, 2007
21
7. Haas, Ralph, Susan Tighe, John Yeaman and Lynne Cowe Falls (2008), “Long Term Warranty Provisions for Sustained Preservation of Pavement Networks,” Proc., Transp. Assoc. of Canada Annual Conf., Toronto, Sept. 2008
8. Marcon, Antonio, Ralph Haas, Susan Tighe and Lynne Cowe Falls (2008), “Integrating Policy Objectives, Quantifiable Performance Indicators and Implementation Targets in Managing Road Network Assets,” Proc., Int. Conf. on Managing Pavement Assets, Calgary, June 2008
9. Stankevich, Natalya, Navaid Quereshi and Cesar Queiroz (2005), “Performance Based Contracting for Preservation and Improvement of Road Assets,” Transport Note No. TN-27, June 2005
10. Humplick, Frannie and W. Paterson, “Framework of Performance Indicators for Managing Road Infrastructure and Pavements,” Proc., 3rd Int. Conf on Managing Pavements, San Antonio, June 1994
11. Poister, Theodore H., “Performance Measurement in State Departments of Transportation,” NCHRP Synthesis 238, Washington, D.C., 1997
12. Cowe Falls, Lynne and Ralph Haas (2001), “Measuring and Reporting Highway Asset Value, Condition and Performance,” Rept. Prepared for Transp. Assoc. of Canada, Sept. 2001
13. Bradbury, Alison, “Performance Measures Critical for Business” in Road Talk. Volume 10, Issue 2. Ministry of Transportation of Ontario, St. Catherine’s, ON. 2004
14. Dalton, Doug, Joseph Nestler, John Nordbo, Bob St. Clair, Ernest Wittwer and Mark
Wolfgram. “Transportation Data and Performance Measurement” in Performance Measures to Improve Transportation Systems: Summary of the Second National Conference. National Academy Press, Washington, D.C., 2005
15. Jurgens, Roy and Jack Chan, “Highway Performance Measures for Business Plans in
Alberta” in Proceedings of the 2005 Annual Conference of the Transportation Association of Canada, Ottawa, 2005
16. Organisation for Economic Co-operation and Development (OECD), “Performance Indicators for the Road Sector”, OECD, Paris, 1997
17. Pickrell, Steven and Lance Neumann, “Use of Performance Measures in Transportation Decision making” in Performance Measures to Improve Transportation Systems and Agency Operations. National Academy Press, Washington, D.C., 2001
22
19. Federal Highway Administration, “Transportation Performance Measures in Australia, Canada, Japan and New Zealand,” US Department of Transportation, Washington, D.C., 2004
20. Organisation for Economic Co-operation and Development (OECD), “Field Test of Performance Indicators for the Road Sector,” OECD, Paris, 2000
21. Felio, Guy and Audrey Basham, “Indicators for the Assessment of the Performance of Core Public Infrastructure – Literature Review of the State-of-Practice”, Discussion paper
Prepared for the National Round Table on Sustainable Infrastructure, March 19, 2008 22. PIARC, “Integration of Performance Indicators”, Report 2008 R06 by PIARC Technical
Committee C4.1, ISBN: 2-84060-206-7, (see www.piarc.org), 2008
23. Haas, Ralph, Lynne Cowe Falls and Susan Tighe (2007), “Quantifiable Performance Indicators for Managing Road Assets,” Proc., Annual Conf. of Can. Society for Civil Engineering, Yellowknife, June, 2007
24. Haas, Ralph, Susan Tighe, John Yeaman and Lynne Cowe Falls, “Long Term Warranty Provisions for Sustained Preservation of Pavement Networks”, Proc., Transp. Assoc. of Canada Annual Conf., Toronto, Sept., 2008
25. Haas, Ralph, “The ICMPA7 Investment Analysis and Communication Challenge for Road Assets”, Prepared for the 7th Int. Conf. on Managing Pavement Assets, Calgary, June, 2008 (see www.icmpa2008.com)
26. Haas, Ralph, Susan Tighe, John Yeaman and Lynne Cowe Falls, “Long Term Warranty Provisions for Sustained Preservation of Pavement Networks”, Proc., Transp. Assoc. of Canada Annual Conf., Toronto, Sept., 2008
27. TR News, “Scanning the Home Front for Transportation’s Best Practices”, Washington, D.C., May-June Issue, 2008 (See NCHRP Project 20-68, June 2007, for details).
28. NRC & NRTSI, “Model Framework for the Assessment of the State, Performance and Management of Canada’s Core Public Infrastructure”, Final Draft Report Prepared by Assets Committee (NRC) and Service Committee (NRTSI), Nov. 14, 2008
29. Haas, Ralph, “Road Infrastructure (A) State-of-the-Art Review of Performance Assessment and Life-Cycle Management Approaches, (B) Performance Measures and Minimum
Acceptable Levels of Performance, (C) Framework for Assessment and Five-Year Research Plan”, Final Report Prepared for Institute for Research in Construction, National Research Council Canada, Nov. 24, 2008.
![Figure 1 Stakeholders Involved With Performance Indicators for Roads Ref. [5]](https://thumb-eu.123doks.com/thumbv2/123doknet/14153119.472122/6.918.174.747.352.728/figure-stakeholders-involved-performance-indicators-roads-ref.webp)