Publisher’s version / Version de l'éditeur:
Optics Letters, 34, 23, pp. 3598-3600, 2009-12-01
READ THESE TERMS AND CONDITIONS CAREFULLY BEFORE USING THIS WEBSITE. https://nrc-publications.canada.ca/eng/copyright
Vous avez des questions? Nous pouvons vous aider. Pour communiquer directement avec un auteur, consultez la
première page de la revue dans laquelle son article a été publié afin de trouver ses coordonnées. Si vous n’arrivez
Questions? Contact the NRC Publications Archive team at
[email protected]. If you wish to email the authors directly, please see the first page of the publication for their contact information.
NRC Publications Archive
Archives des publications du CNRC
This publication could be one of several versions: author’s original, accepted manuscript or the publisher’s version. / La version de cette publication peut être l’une des suivantes : la version prépublication de l’auteur, la version acceptée du manuscrit ou la version de l’éditeur.
For the publisher’s version, please access the DOI link below./ Pour consulter la version de l’éditeur, utilisez le lien DOI ci-dessous.
https://doi.org/10.1364/OL.34.003598
Access and use of this website and the material on it are subject to the Terms and Conditions set forth at
Silicon photonic wire biosensor array for multiplexed, real-time and
label-free molecular detection
Densmore, A.; Vachon, M.; Xu, D.-X.; Janz, S.; Ma, R.; Li, Y.-H.; Lopinski,
G.; Delâge, A.; Lapointe, J.; Luebbert, C. C.; Liu, Q. Y.; Cheben, P.; Schmid,
J. H.
https://publications-cnrc.canada.ca/fra/droits
L’accès à ce site Web et l’utilisation de son contenu sont assujettis aux conditions présentées dans le site LISEZ CES CONDITIONS ATTENTIVEMENT AVANT D’UTILISER CE SITE WEB.
NRC Publications Record / Notice d'Archives des publications de CNRC:
https://nrc-publications.canada.ca/eng/view/object/?id=37a446c4-3af0-4f01-98ab-bb6b3c28bdb1 https://publications-cnrc.canada.ca/fra/voir/objet/?id=37a446c4-3af0-4f01-98ab-bb6b3c28bdb1
Silicon photonic wire biosensor array for multiplexed
real-time and label-free molecular detection
A. Densmore,1,*M. Vachon,1D.-X. Xu,1S. Janz,1R. Ma,1Y.-H. Li,2G. Lopinski,2
A. Delâge,1J. Lapointe,1C. Luebbert,3Q.Y. Liu,3P. Cheben,1and J.H. Schmid1
1Institute for Microstructural Sciences, National Research Council Canada, Ottawa, Ontario, Canada, K1A 0R6 2Steacie Institute for Molecular Sciences, National Research Council Canada, Ottawa, Ontario, Canada, K1A 0R6
3Institute for Biological Sciences, National Research Council Canada, Ottawa, Ontario, Canada, K1A 0R6
*Corresponding author: [email protected]
We demonstrate a silicon photonic wire waveguide biosensor array chip for the simultaneous monitoring of different molecular binding reactions. The chip is compatible with automated commercial spotting tools and contains a monolithically integrated microfluidic channel for sample delivery. Each array sensor element is a 1.8 mm long spiral waveguide folded within a 130 m diameter spot, and are incorporated in a balanced Mach-Zehnder interferometer with near temperature independent response. The sensors are arranged in a 400 m spacing grid pattern, and are addressed through cascaded 1×2 optical power splitters using light from a single input fiber. We demonstrate the real-time monitoring of antibody-antigen reactions using complementary and mismatched IgG receptor-analyte pairs and bovine serum albumin. The measured level of detection for each sensor element corresponds to a surface coverage of less than 0.3 pg/mm2
Applications of molecular sensors in genomics, proteomics and drug screening often require high throughput measurements of many different binding reactions. Therefore, the ability to form sensor arrays where molecular receptors can be independently immobilized on each array element is essential for new sensor technologies. The evanescent-field waveguide sensor has proven attractive for this application due to its potential for high density integration, label-free operation and real time monitoring capability. Various waveguide sensors have been reported using a variety of material systems and configurations such as Mach-Zehnder interferometers (MZI) [1-4], microdisks [5-6], and ring resonators [7-10]. They can provide increased sensitivity compared to established techniques such as surface plasmon resonance (SPR) [11], and may be multiplexed using established methods in integrated optics.
In previous work, we have developed highly sensitive, discrete silicon-on-insulator (SOI) photonic wire waveguide sensors and we have shown that their small size and high refractive index contrast produces unusually strong evanescent field at the waveguide surface [3]. By implementing these waveguides in a balanced MZI configuration, high sensitivity to molecular binding was achieved, while almost eliminating temperature induced sensor drift [4]. In this manuscript, we report for the first time the demonstration of an integrated silicon biochip containing a multiplexed array of these sensors. The chip also incorporates a monolithically integrated microfluidic channel for sample delivery and our experiments are carried out using a commercial microarray spotter to deposit receptor molecules on individual sensor elements.
The response of an evanescent field sensor to molecular binding at the sensor surface is proportional to ∂Neff/∂Dopt, where ∂Neffis the effective index change of the waveguide mode and
∂Ddopt is the change in optical thickness of the formed molecular layer. Since ∂Neff/∂Dopt
thickness, thin SOI waveguides have higher response to molecular binding than waveguides fabricated in most other materials [3]. In an SOI photonic wire waveguide, the transverse magnetic (TM-like) mode provides the highest sensitivity, which is maximized for a waveguide thickness of 0.22 m [3].
To transform the induced effective index change into a measurable intensity change, we have developed Mach-Zehnder interferometer sensors using 0.26 m × 0.45 m photonic wire waveguides near this optimum silicon thickness. The MZI arms were designed to have similar optical path lengths to minimize the device response to temperature changes. The photonic wires were defined using electron beam lithography and reactive ion etching on an SOI wafer with a 0.26 m thick silicon layer and a 2 m buried oxide.
The waveguides were covered with a 2 m thick SU-8 polymer upper cladding for optical isolation of the waveguide mode from the analyte solution. The SU-8 was removed over the MZI sensing arms forming circular windows, thereby exposing the waveguides and then cured at 180 ºC. Both the reference and sensing arms of the MZI contain a ~ 1.8 mm long double spiral waveguide occupying a circular area of 130 m diameter. The cumulative phase shift in the MZI arm is proportional to both the surface sensitivity ∂Neff/∂Doptof the waveguide and its
length [4]. The spiral waveguide layout offers the high sensitivity of a long waveguide, while providing a compact geometry for compatibility with microarray spotting. Furthermore, when placed in a typical microfluidic channel having a width comparable to the sensor diameter (~ 100-300 m), the spiral waveguide occupies a much larger fraction of the channel floor per unit channel length compared to a conventional straight waveguide for improved molecular capture.
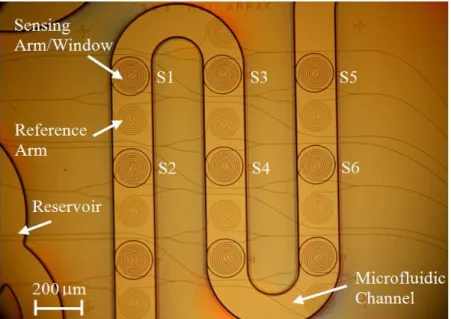
Sensors were multiplexed in a 400 × 400 m2 grid pattern as shown in Fig. 1. At the
linear taper for adiabatic expansion of the waveguide mode for efficient coupling with a lensed optical fiber. The measured fiber-to-waveguide coupling loss was found to be less than 3 dB, and the waveguide propagation loss was measured to be less than 0.6 dB/mm. Following the input waveguide, a 1×8 optical power splitter consisting of cascaded 1×2 y-junctions was used to direct light to six sensors in the array (S1-S6 in Fig. 1) and two optical test ports. The lower three sensors shown in Fig. 1 are independent test structures and were not used for this sensor array experiment. The outputs of the six MZI sensors were directed to the output chip facet.
After defining the sensor windows, a second SU-8 layer of 50 m thickness was spun onto the chip. A 190 m wide microfluidic channel was defined in this layer using contact lithography. It was aligned to pass over the SU-8 sensing windows as shown in Fig. 1. The channel is terminated at both ends with 1 mm diameter circular reservoirs. The reservoirs are added to increase the alignment tolerance of the chip to inlet and outlet fluidic connections contained in a PDMS cover plate which seals the top of the channel during testing.
After defining the fluidic channel, an oxygen plasma was used to form a 3 nm thick SiO2
layer on the exposed waveguides. This allows standard glass-based functionalization procedures to be subsequently used for molecular attachment. After fabrication, the sensor surface was cleaned and activated using nitric acid and silanized with 3-aminopropyltriethoxysilane vapor in a vacuum chamber.
The sensor array was tested using binding reactions between complementary antibody-antigen pairs: goat and anti-goat IgG, and rabbit and anti-rabbit IgG. Each sensor element in the array was individually functionalized using a non-contact robotic spotting tool (GeSiM Nano-Plotter 2.1). The spotter was used to deposit drops of solutions containing the appropriate receptor molecule (diluted in PBS) on each exposed sensor element in the array. A 450 pl drop
volume was chosen to fill the 130 m sensor diameter, and in each case the molecular concentration was 1 mg/ml. Goat IgG was deposited on sensors 1 and 2 (S1 and S2 in Fig. 1), rabbit IgG was deposited on sensors 3 and 4 (S3, S4), and bovine serum albumin (BSA) was deposited on sensors 5 and 6 (S5, S6). The spotted chip was then allowed to dry in 40% humidity at 25 ºC. The PDMS cover plate was then aligned and adhered to the chip to seal the SU-8 channel. It was attached without the use of epoxies or other binding agents, and therefore could be removed and reused. A syringe pump was attached to the outlet port of the PDMS cover and was used to draw solutions through the fluidic channel. A microfluidic switch was attached to the inlet port to switch between different analyte and buffer solutions. After attaching the cover piece a wash step was performed where PBS was passed through the channel for 10 minutes to remove any loosely bound receptor molecules and residue left from the spotting process.
A lensed optical fiber delivered a TM polarized, 1560 nm laser signal to the input waveguide of the sensor array. The six output waveguides were simultaneously monitored with a high sensitivity, 320×240 pixel infrared InGaAs camera. Intensity readings from a single pixel near the center of each imaged waveguide output were acquired every 200 ms using a 16 ms exposure time. A fiber coupled optical power of approximately 100 nW provided sufficient intensity at each array output waveguide to nearly saturate the camera pixels at the MZI fringe maxima, thereby achieving a 36 dB dynamic range (i.e. 12 bit resolution). Therefore, the number of sensors that can be interrogated using this approach will not be practically limited by loss due to optical power splitting when used with readily available laser sources with output powers of a few mW.
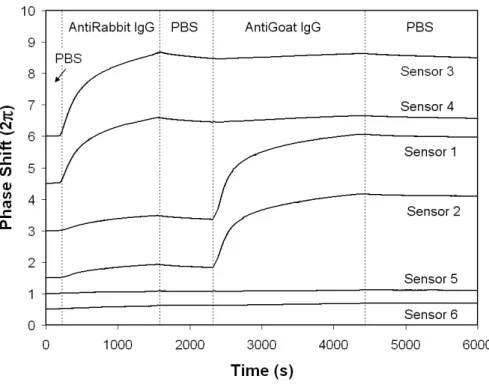
Fig. 2 shows the measured phase shift induced in the MZI sensing arm during the experiment. The phase shift was extracted from the raw MZI intensity data by fitting it with a
cosine function with varying phase. The phase shift was then cumulated at each time point and the original signal noise is preserved and transferred to the phase plots. After the rinse step (ending at t=0), PBS continued to flow through the fluidic channel for 3 minutes, followed by anti-rabbit IgG (200 nM, from inoculated chicken) and then rinsed with PBS. Sensors 3 and 4 show strong binding of the rabbit IgG receptors to the anti-rabbit IgG in solution, with total phase shifts of 2 (2and 2.4 (2after the rinsing step. As expected, sensors 1 and 2 functionalized with goat IgG demonstrate a much smaller (and ~ 10 times slower) response to the anti-rabbit IgG. We attribute their residual response to non-specific binding of anti-rabbit IgG to the silanized sensor surface, which should be further reduced by implementing a blocking step prior to testing. Following exposure to the anti-rabbit IgG, a solution of anti-goat IgG (200 nM, from inoculated rabbit) in PBS was then passed through the channel. In this step, sensors 1 and 2 now show a strong binding reaction between the goat-IgG receptor and the anti-goat IgG, with a rapid change of phase saturating at 2.6 and 3 (2At the same time, sensors 3 and 4 demonstrate a response of less than 0.03 (2. The control sensors 5 and 6 were printed with BSA, which is a commonly used blocking agent that should not bind to either molecule. The BSA effectively blocked these control sensors, which gave cumulative phase responses of less than 0.1 (2during each anti-IgG step.
An average rms phase noise of 4×10⁻⁴ (2 was observed on the MZI response curves.
Based on a saturated phase shift for the anti-rabbit IgG of approximately 2 (2 this indicates that approximately 0.02% of a saturated molecular monolayer could be resolved. From ellipsometry measurements performed on a witness sample, which was simultaneously functionalized with the sensor chip and exposed to the same concentration of analyte, we estimate a surface mass coverage of 1.2 ng/mm2[12]. The measured phase noise therefore corresponds to a resolvable
surface coverage of ~ 0.25 pg/mm2. Due to the small surface area of the sensing waveguides, the
resolvable surface coverage corresponds to a low molecular mass of ~ 0.5 fg. These values compare favorably with those from commercial SPR systems, and we believe our noise floor can be further improved by implementing multiple-pixel averaging in the InGaAs camera readout.
The measured temperature dependence of the MZI devices when exposed to PBS solution was measured using a heated stage and was found to be less than 0.005 (2) /°C. This value corresponds to ~ 0.2 % of the signal induced by the formation of the anti-IgG layer per °C. This is sufficiently low for typical sensing applications to avoid the need for high precision temperature control or reference sensors that may be required using other transducer configurations, such as resonators.
In summary, we have demonstrated a multiplexed biosensor array using silicon photonic wire waveguides to detect binding reactions at individually functionalized sensors. We have used simple optical power splitters to divide light from a single input waveguide to a Mach-Zehnder interferometer array and a high sensitivity InGaAs camera for parallel readout of sensors. Analyte was delivered to the sensors using a monolithically integrated microfluidic channel that greatly reduces alignment challenges with hybrid fluidic approaches.
References
1. B.J. Luff, J.S. Wilkinson, J. Piehler, U. Hollenback, J. Ingenhoff and N. Fabricius, “Integrated optical Mach-Zehnder biosensor,” J. Lightwave Technol. 16, 583 (1998).
2. B. Sepulveda, J.S. del Rio, M. Moreno, F.J. Blanco, K. Mayora, C. Dominguez and L.M. Lechuga, “Optical biosensor microsystems based on the integration of highly sensitive Mach-Zehnder interferometer devices,” J. Opt. A 8, S561 (2006).
3. A. Densmore, D.-X. Xu, P. Waldron, S. Janz, P. Cheben, J. Lapointe, A. Delâge, B. Lamontagne, J.H. Schmid and E. Post, “A silicon-on-insulator photonic wire based evanescent field sensor,” IEEE Photon. Technol. Lett. 18, 2520 (2006).
4. A. Densmore, D.-X. Xu, S. Janz, P. Waldron, T. Mischki, G. Lopinski, A. Delâge, J. Lapointe, P. Cheben, B. Lamontagne and J.H. Schmid, “Spiral path, high sensitivity silicon photonic wire molecular sensor with temperature independent response,” Opt. Lett. 33, 596 (2008).
5. A.M. Armani, R.P. Kulkarni, S.E. Fraser, R.C. Flagan and K.J. Vahala, “Label-free, single-molecule detection with optical microcavities,” Science, 317, 783 (2007).
6. R.W. Boyd and J.E. Heebner, “Sensitive disk resonator photonic biosensor,” Appl. Opt. 40, 5742 (2001). 7. D. X. Xu, A. Densmore, A. Delâge, P. Waldron, R. McKinnon, S. Janz, J. Lapointe, G. Lopinski, T. Mischki, E.
Post, P. Cheben, and J. H. Schmid, “Folded cavity SOI microring sensors for high sensitivity and real time measurement of biomolecular binding,” Opt. Express 16, 15137 (2008).
8. Katrien De Vos, Irene Bartolozzi, Etienne Schacht, Peter Bienstman, and Roel Baets, “Silicon-on-Insulator microring resonator for sensitive and label-free biosensing,” Opt. Express 15, 7610 (2007).
9. A. Yalcin, K.C. Popat, J.C. Aldridge, T.A. Desai, J. Hryniewicz, N. Chbouki, B.E. Little, O. King, V. Van, S. Chu, D. Gill, M. Anthes-Washburn, M.S. Unlu and B.B. Goldberg, “Optical sensing of biomolecules using microring resonators,” IEEE J. Selected Topics in Quantum Electron. 12, 148 (2006).
10. A. Ksendzov and Y. Lin, “Integrated optics ring-resonator sensors for protein detection,” Opt. Lett., 30, 3344 (2005).
11. W. Lukosz, “Principles and sensitivities of integrated optical and surface plasmon sensors for direct affinity sensing and immunosensing,” Biosens. Bioelectron. 6, 215 (1991).
Fig. 1. Top view of a silicon photonic wire Mach-Zehnder interferometer sensor array, with a monolithically integrated SU-8 microfluidic channel, that is aligned to the sensor windows for analyte delivery. The top six sensors (S1-S6) of the array are used in the experiment, while the bottom three sensors are independent test structures.
Fig. 2. Binding curves obtained using an infrared camera to simultaneously track the phase change induced in the Mach-Zehnder interferometer sensors. Sensors 1, 2 were printed with goat IgG; sensors 3, 4 were printed with rabbit IgG; and sensors 5, 6 were printed with BSA using a microarray spotter. For clarity the sensor response curves have been offset in the plot.