Prof. W. A. Rosenblith
Dr. N. Y-S. Kiang***
R. G. Mark
Prof. M. A. B. Braziert
Dr. T. T. Sandelf
P. Mermelstein
Prof. M. Eden
Dr. Eda Berger Vidale
C. E. Molnarttt
Prof. M. H. Goldstein, Jr.
J. A. Aldrich
Donna A. Molnar
Prof. W. T. Peake
R. M. Brown
R. R. Pfeiffer
Prof. W. M. Siebert
S. K. Burns
Cynthia M. Pyle
Dr. J. S. Barlow$
R. R. Capranica
D. M. Snodderly, Jr.
Dr. A. Cavaggioni**
Eleanor K. Chance
G. F. Svihula
W. A. Clark t
R. J. Clayton
Aurice V. Weiss
Dr. B. G. Farley t
A. H. Crist
T. F. Weiss
Dr. G. L. Gerstein
P. R. Gray
J. R. Welch
Dr. E. Gibermanf$
J. L. Hall II
M. L. Wiederhold
Dr. R. D. Hall
F. T. Hambrecht
G. R. Wilde
J. G. Krishnayya
A.
DESIGN PHILOSOPHY FOR PSYCHOPHYSICAL EXPERIMENTS RELATED TO
A THEORY OF AUDITORY FUNCTION
Psychophysics should play a major role in the evolution of a theory of auditory
func-tion, together with anatomy and physiology.
We feel that the psychophysical tests that
will be most valuable for this purpose are those that can be related to the physiological
information now available about hearing. In terms of this objective of relating
psycho-physical and physiological data, it is possible to argue for a "best" psychopsycho-physical test
procedure.
A good deal is known about the mechanical properties of the ear,1 and about the
neural activity at the level of the acoustic nerve,2 that is, about what might be called
the peripheral auditory system.
In particular, it is now clear that some information
about the external acoustical stimulus is destroyed by the peripheral auditory system,
and that psychophysical test performance is thereby fundamentally limited. By utilizing
the available physiological information about the periphery in a statistical hypothesis
testing formulation, the limits on performance imposed by the periphery in certain
psychophysical tests could be described quantitatively, except, perhaps, for a few
unknown parameters and functional forms. The more central system also imposes
*This work was supported in part by the National Science Foundation (Grant
G-16526); and in part by the National Institutes of Health (Grant MH-04737-02).
Visiting Professor in Communication Sciences from the Brain Research Institute,
University of California at Los Angeles.
SResearch Associate in Communication Sciences from the Neurophysiological
Labo-ratory of the Neurology Service of the Massachusetts General Hospital.
From Istituto di Fisiologia, Universith. di Pisa.
tStaff Member, Lincoln Laboratory, M. I. T.
"From the Department of Physics, Weizmann Institute of Science, Israel.
***Also at the Massachusetts Eye and Ear Infirmary, Boston.
(XV. COMMUNICATIONS BIOPHYSICS)
limits on performance, but these more central limitations cannot be described quanti-tatively on the basis of physiological information, as present understanding of what is done centrally with the information available from the periphery is relatively incomplete. It may be that in some psychophysical tests, the dominant limitations on performance are peripheral; that is, the central processing is effectively as good as the mathemat-ically optimal processing. If such is the case, the quantitative description of peripheral limitations for these tests should correctly describe the characteristics of the psycho-physical data. Since some psychophysical data must be used to complete the formulation of peripheral bounds, the only fact that can really be demonstrated experimentally is that there exists a class of psychophysical tests in which the data are as if peripheral bounds were dominant. We can look for a class of psychophysical tests in which the
data from one test are related to the data from another in the same way as they would be if peripheral limitations were dominant, but, even if we are successful, we cannot claim to have demonstrated that peripheral limitations are really dominant. However, this approach seems to be a legitimate and promising way in which to try to relate physiological and psychophysical phenomena.
If we subscribe to this approach, we must look first for psychophysical experiments that can be related to the statistical hypothesis testing formulation of peripheral bounds and hold some promise of being tests in which peripheral factors are dominant. Given these conditions, we can argue for several desirable attributes of psychophysical tests:
(i) The tests should involve discriminations rather than absolute recognitions. (ii) The subject should be thoroughly informed about every aspect of the experi-mental design except the actual sequence of presentations to be used (the subjects used in the experiments described here were graduate students in electrical engineering, and hence had no difficulty in understanding a quantitative description of the stimuli).
(iii) The subject should be asked to choose from a finite and preferably small set of responses, say, two.
(iv) The stimulus parameters should unambiguously define which response is cor-rect and the subject should be informed of which response was corcor-rect after each trial.
(v) The subject should be asked to use all of the information available to him to do as well as possible in terms of some scoring system.
(vi) There should be a minimum of different possible stimuli, say, two.
These points lead to consideration of two general types of discrimination tests, each of which involves only two possible stimuli and two possible responses. In one config-uration, the subject is presented stimulus A followed by stimulus A (AA), or stimulus A followed by stimulus B (AB), and asked whether the two stimuli are the same or dif-ferent. In the other configuration the subject is presented either AB or BA and asked in which position is B.
A series of experiments in frequency discrimination was run to evaluate the relative
merits of variations of these two presentations. Stability of performance was a major consideration in evaluating the various psychophysical test schemes, since unstable behavior was regarded as a clear indication that peripheral bounds were not dominant.
We found that the symmetric presentations - those in which either pair occurred with a priori probability 1/2 - were better in terms of stability than the asymmetric. This conclusion was supported by the subjective feelings of the observers and the quantita-tive aspects of the experimental data. We also found that the High-Low (AB, BA) presen-tation was better in terms of stability than the Same-Different (AA, AB). The subjects preferred the (AB, BA) configuration because they felt that high-low was exactly the question they first answered in listening to the stimuli, whereas in the (AA, AB) con-figuration the stimuli all sounded different and they asked themselves "different enough?" The subjects' feelings were reflected quantitatively in the data, with the (AB, BA) data being significantly more stable than the (AA, AB). We feel that the two-alternative forced-choice experiment (AB, BA) would also be "best," given the goal of relating physiological to psychophysical data, in tests of discrimination other than frequency and in detection tests.
Further details of these arguments, the statistical hypothesis testing formulation, and the experiments referred to in this report may be found in the author's thesis.3
P. R. Gray
References
1. G. von B6k6sy's papers have been collected in Experiments in Hearing (McGraw-Hill Book Company, Inc., New York, 1960).
2. H. Davis, Advances in the neurophysiology and neuroanatomy of the cochlea, J. Acoust. Soc. Am. 34, 1377-1385 (1962).
3. P. R. Gray, A Design Philosophy for Psychophysical Experiments, S. M. Thesis, Department of Electrical Engineering, M. I. T., January 1963.
B. EVOKED RESPONSES IN RELATION TO VISUAL PERCEPTION AND OCULO-MOTOR REACTION TIMES IN MAN
[This report is a summary of an invited paper read at the Conference, "Sensory Evoked Response in Man," sponsored by the New York Academy of Sciences and Albert Einstein College of Medicine, New York, February 14-15, 1963. The paper will be pub-lished as a part of a Conference Monograph in the Annals of the New York Academy of Sciences.]
Responses evoked at the occiput in man by visual stimuli have been studied in rela-tion to oculomotor reacrela-tion times, and in relarela-tion to some of the associated phenomena of visual perception. Sudden changes in the vertical position of a spot on an oscilloscope screen were used as stimuli and as tracking signals, and motor responses consisted of the corresponding redirections of gaze to the successively new positions of the spot.
(XV. COMMUNICATIONS BIOPHYSICS)
For subsequent analysis, simultaneous recordings were made onto magnetic tape and
paper of: (a) spot position, (b) eye position (monitored electro-oculographically), and
(c) EEG potentials recorded bipolarly from a pair of midline parieto-occipital scalp
electrodes.
Averages of parieto-occipital evoked potentials for a large number of stimuli were
obtained from recordings made during visual tracking of the spot, and also from
recordings carried out while gaze was maintained fixed at the center of the oscilloscope
screen. Also, averaged responses, with eyes closed, to flashes of light from a
strobo-scope were obtained. Oculomotor reaction times were determined by averaging of
electro-oculographic potentials, and by crosscorrelation of the latter with the
spot-position signals.
In separate psychophysical experiments with some subjects, an attempt was made
to determine, by indirect means, the approximate time interval for subjective
percep-tion of the stimuli, and for subjective perceppercep-tion of eye movements, for comparison
with the latencies of various components of the parieto-occipital evoked responses.
Potentials evoked by the shifting spot of light were generally appreciably smaller,
and greater in latency, than those evoked by bright flashes of light with the eyes closed,
but the amplitude of certain components of the former (that is, those with an output at
approximately 80-90 msec) was clearly increased during tracking for some subjects,
an effect that may have been due to the fact that the fovea of the retina was more
fre-quently stimulated during tracking than it was when the eyes were maintained fixed.
Consideration of the latencies of these components suggests that they may represent
nonspecific rather than specific evoked responses in the visual system. Comparison
of averages of EEG responses with those of EOG responses established that the
above-mentioned components appearing during tracking did not represent the electrical field,
at the parieto-occipital scalp electrodes, of the EOG potentials, the amplitude of the
latter being much larger than that of the EEG potentials. Suggestive, but not
con-clusive, evidence for different forms of evoked responses for different directions of
spot-shifts were obtained for some subjects.
A comparison, for one subject, of the results of the psychophysical experiments
with those of the electrophysiological recordings provided some tentative evidence that
the subjective perception of spot-shifts takes place, on the average, rather early
(that is, within 50 msec), a finding that suggests that visual perception of simple
stimuli may be more closely related to specific visual pathways than to nonspecific
ones. Only minimal evidence of an early, specific response was, however, obtained
in the present series of experiments for spot-shifts as visual stimuli. It appears
probable that a component appearing in the averaged parieto-occipital EEG response
at a constant interval of time after the mean oculomotor reaction time represents
the same basic phenomenon as that of the "lambda waves" following eye movements
that have been described previously.
The findings from these electrophysiological and psychophysical experiments are discussed in relation to the question of quantization of time in the nervous system.
This work was supported in part at the Massachusetts General Hospital by a U. S. Public Health Service career program award (Number 5-K3-NB-9201), and by a Public Health Service research grant (Number B-3752), from the National Institute of Neuro-logical Diseases and Blindness.
J. S. Barlow
C. A MODEL FOR FIRING PATTERNS OF AUDITORY NERVE FIBERS
Acoustic signals are represented by sequences of spike potentials in the auditory (VIIIt h ) nerve. The form of this code and the encoding mechanism have been subjects of considerable interest in physiology. Recent experimental results of Kiang and others1 have revealed the highly systematic structure of the spike activity of fibers in the VIIIth nerve of cats. These results have led to the work, summarized here, on the construc-tion and testing of-a model of the peripheral auditory system that relates the firing of an VIIIth-nerve fiber to sound coming into the ear.
Sound enters the outer ear, impinges on the eardrum, and is transmitted through the middle-ear structures to the fluids of the cochlea or inner ear. The fluid motion results in motion of the cochlear partition, which in turn results in forces on and/or movements of the auditory receptor cells or hair cells. The hair cells are thought to be transducer elements whose function is to produce local excitation of nearby VIIIt h -nerve fibers. The spike potentials resulting from this excitation are transmitted to the brain via the VIIIt h nerve.
Figure XV-1 shows a model of this system. The "Mechanical System" represents the functional relationship between an acoustic pressure input to the ear and a displace-ment of the cochlear partition and is assumed to be representable as a linear system over a range of approximately 80 db of sound intensity. The transfer function of this part of the system for a particular point along the cochlear partition is assumed to be given by the work of von B~k6sy2 for frequencies below approximately 2 kc. The
"Transducer" is intended to represent the functional relationship between the displace-ment of the cochlear partition at a point along its length and the output of a hair cell at that point. The final block shows a stereotyped or idealized "Model Neuron." In this model the output of the transducer is summed with noise at the input of the neuron. This noise is included to account for both the spontaneous activity and the probabilistic
th
response behavior characteristic of VIII -nerve fibers. The existence of this noise (additive to the membrane potential) can be justified to some extent on the basis of extrapolations from some empirical evidence that is due to Verveen.3
(XV. COMMUNICATIONS BIOPHYSICS)
p(t), Pressure at the ear drum
y(t,x), Displacement of the cochlear partition
z(t,x), Output of hair cell f(t,x), Action potentials of fiber
h(t,x), Impulse response of the cochlear partition at a point x cm from the stapes
G(y), A function relating the output of a hair cell to displacement of the cochlear partition at a point x cm from the stapes
g(t), Impulse response of a linear filter r(t,x), Threshold of the neuron model at time t
Fig. XV-1.
Model relating the firing patterns of fibers
in the auditory nerve to acoustic stimuli.
noise and the input to the neuron is filtered and then compared with a threshold in the
box labelled "C." If the threshold is exceeded, then a spike is defined as occurring,
and the threshold is reset to some larger value, by the box labelled "R."
tlNC
THRESHOLD POTENTIAL
tMAX
tREST MEMBRANE POTENTIAL
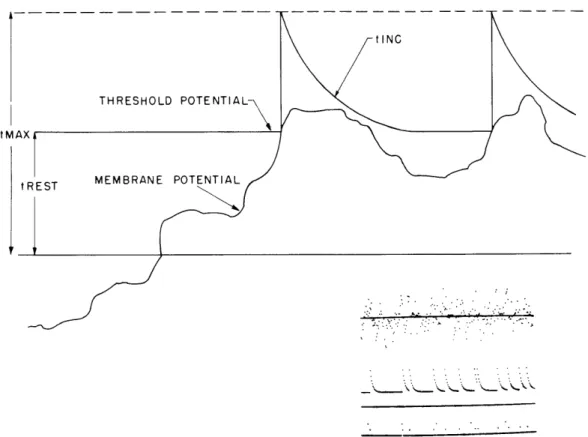
Fig. XV-2. Threshold and membrane potential of the model neuron as a function of time.
QPR No. 69
218
Figure XV-2 shows both the noisy membrane potential of the model neuron and the
threshold as a function of time.
The threshold is reset to some large value (tMax) upon
the occurrence of a spike and decays to its resting value (tRest) with a decrement (tInc).
In the lower right-hand corner there is a representation of the membrane and threshold
potentials generated by the TX-2 computer simulation of this system. The top trace
shows the noisy membrane potential.
The center trace shows the threshold as a function
of time.
The bottom trace of dots shows the times of occurrence of spikes and a set of
time markers.
The fundamental assumptions in this model are:
(i) The mechanical system is assumed to be representable by a linear system.
(ii) A point-to-point relation between the displacement of the cochlear partition
and the neural excitation is assumed.
A particular neural fiber is assumed to be
excited by a neighboring hair cell, which in turn responds to the displacement of the
cochlear partition at a point along its length.
(iii) The process of neural excitation is represented by a simple model neuron.
This model is probabilistic and characterized by threshold and refractory effects.
(iv) The effects of efferent fibers on the peripheral system are ignored.
This model has been simulated on the TX-2 computer at Lincoln Laboratory, M.I.T.,
SPONYTNEOUS RUN SERIAL • 494
2/1/3 I1-05 100 -J I z - *30 00 0 00 z - 5 KC ee e * * I , I I I 2 3 INTERVAL 4 5 (MILLISECONDS) 6 7 8
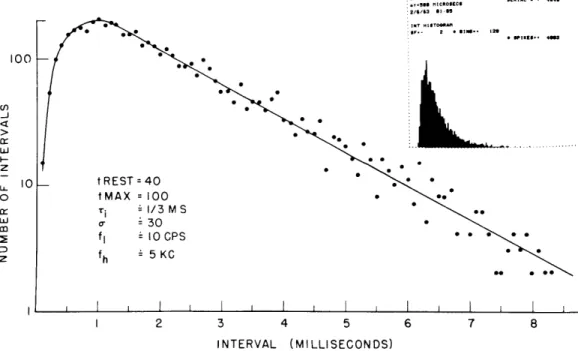
Fig. XV-3.
Histogram of intervals between spikes generated
by the model in the absence of a stimulus.
The
time constant of the decay of the threshold to its
resting value is 1/3 msec.
The noise spectrum
is flat from 10 cps to 5 kc.
I I I I I I I
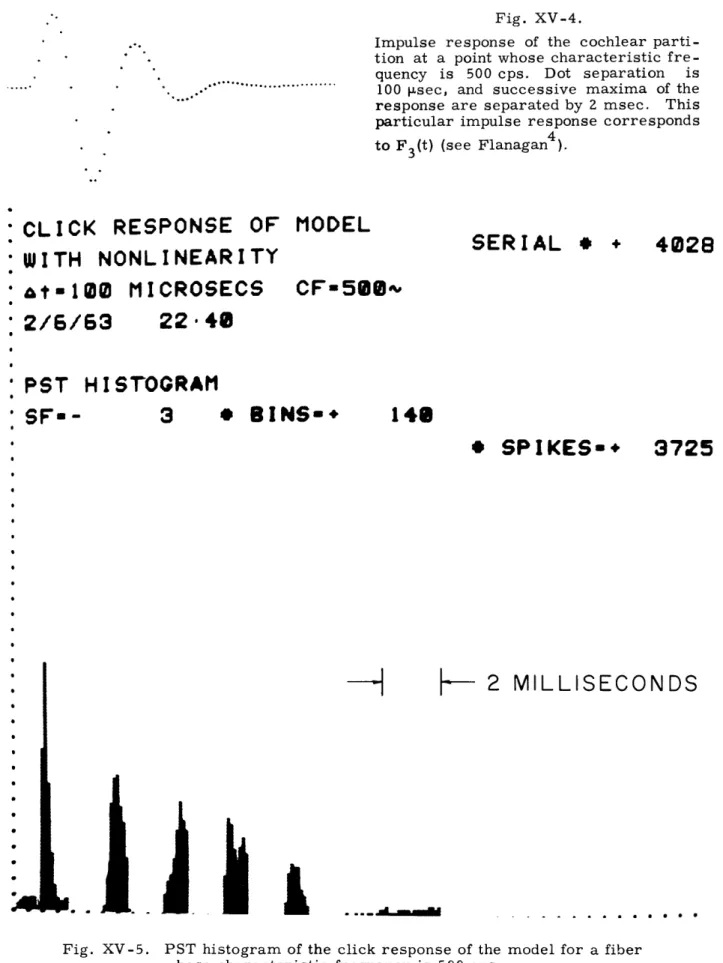
Fig. XV-4.
Impulse response of the cochlear parti-tion at a point whose characteristic fre-quency is 500 cps. Dot separation is
100 p.sec, and successive maxima of the response are separated by 2 msec. This particular impulse response corresponds to F3(t) (see Flanagan4).
:CLICK
RESPONSE OF
:WITH NONLINEARITY
•tw-100 MICROSECS
MODEL
CF=58 ~
SERIAL
*
+
:
2/6/63
22
48
:
PST
HISTOGRAM
'
SF-
3
*
BINS-*
148
* SPIKES*
-H
L.
I..
I
Fig. XV-5.
I
3725
--
2 MILLISECONDS
PST histogram of the click response of the model for a fiber whose characteristic frequency is 500 cps.
QPR No. 69
4028
... * . ... .. . ...~1
-
o--
AM 1 --"W - .- . . . a 0 0 220and statistics of the spontaneous activity and response of the model to a variety of acous-tic stimuli have been studied and compared with the VIIIth-nerve data obtained by Kiang and others.1
Figure XV-3 shows a histogram of interspike intervals of the spontaneous activity generated by the model. The insert shows this histogram as photographed from the TX-2 oscilloscopic output. The rest of the figure shows the interval histogram plotted in semi-logarithmic coordinates. Notice that the tail of the distribution is linear with these coordinates, or exponential on linear coordinates. For very short intervals, the the number of firings decreases to zero, a reflection of the refractory properties of the model. This general form of the distribution of intervals in the spontaneous (or unstimulated) case is characteristic of VIIIth-nerve fibers.
Figure XV-4 shows the response of the cochlear partition to a short click determined by Flanagan from the data of von B6kdsy. In this case, the response is given for a point along the cochlear partition whose characteristic frequency is 500 cps. Figure XV-5 shows the response of a model fiber that is assumed to innervate a hair cell at the same spot on the cochlear partition. The response is in the form of a PST (Post Stimulus Time) histogram. This histogram shows the number of firings that occur at a time t after the onset of a stimulus. The peaks in this histogram are separated by an interval of 2 msec and correspond to the times of the maximum positive deflections in the response of the cochlear partition at the 500-cps point to the click. This general form of the model PST histogram agrees quite well with the form of similar histograms com-puted from the VIIIth-nerve data.
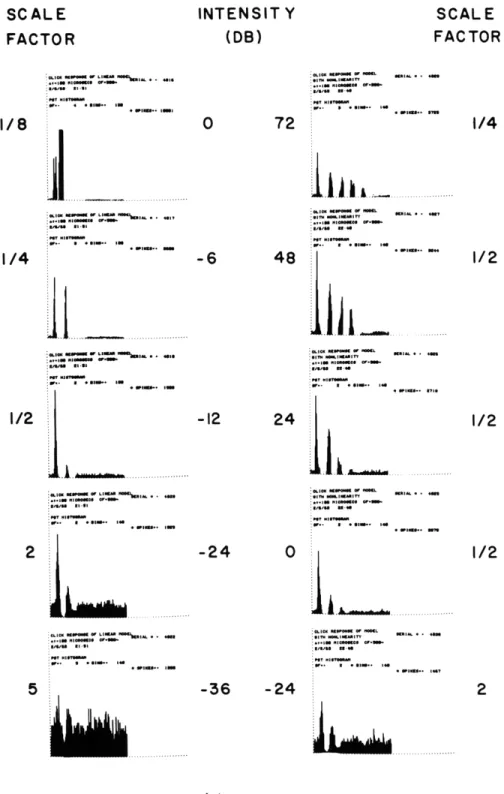
Figure XV-6 shows PST histograms of the click response of the model for two dif-ferent forms of the transducer as a function of sound intensity. The histograms on the left side show the results for a linear transducer, that is, the output of the transducer is proportional to its input. Note that there is a 36-db range between the intensity at which a response first appears to be visible in the PST histogram and the intensity at which the response of the model becomes stereotyped (that is, the model responds to the largest positive deflection of the cochlear partition every time a stimulus is pre-sented.) This behavior does not agree with the observed response of VIIIth-nerve fibers. Since the envelope of the impulse response of the cochlear partition decays at a rate exceeding 20 db per cycle of oscillation, there can be at most two or three peaks in the PST histogram when a linear transducer model is used. The linear transducer function thus yields PST histograms that are at variance with the empirical evidence of Kiang and others. The histograms on the right side of Fig. XV-6 show the results obtained for a transducer model that is a nonlinear saturation function. The results obtained with the nonlinear transducer model agree qualitatively with the results of Kiang and others.
INTENSIT
Y
(DB)
1 l nlirc • in WellI i OPIUM~ lm1/8
40 1.111/4
2 IlJ
..
...
...
t~llllNell
alemoen :VlI • i 1 . I:Bm Its-11
I/ 2m
.
616.m
..
...
:•,. so o m :~ au , I, agw- IN I. n . .. . . .. . . . .. !"N ""N m v1[*1IMWI at- i 116 SI1 . II5
72
i
.J
~l
i..,
..
...
...
:11"m ... Ne :.,.IN loom" -801-• t~ll ll -I IItllr U. I :11A/111 W00M al m1.. IM-
4
8
..,1
...
• . . ... . NN "llefl I l ii :8/11,1110 1111-411 .111TOW,, (r a INt~-12
24
-24
Moaldem •. lll u.*o :8,1111 U.".
.
.
-36
-24
r ,I II.I....ir .... ....-36
-24
jt Z=IOO/sec
CF
= 500 cps
Fig. XV-6.
PST histograms of the click response of the model for two
different transducer functions vs intensity of click. The
left-column histograms were computed for a linear transducer.
The right-column histograms were computed for a nonlinear
transducer [G(y)
=yk
Y
QPR No. 69
SCALE
FACTOR
SCALE
FACTOR
1/4
1/2
1/2
1/2
2
a Me. alle"I L
~
IY 0il. ln IrlNOR :.I_ 1010 O .10nom WMes Bie" l' 1II ll$ITo~ W.. 9 -daeel.. am1~ R 222zz
the sensitivity of neurons responding to sinusoids at their characteristic frequency increases as a function of frequency (at a rate of approximately 40 db/decade) in the
range 100 cps-2 kc. Such a change in sensitivity is seen at higher auditory centers5 and even in the human audiogram,6 but it was surprising to encounter this effect so close to the periphery, particularly since the mechanical part of the system does not exhibit so large a change in sensitivity. Preliminary results tend to indicate that this effect can be explained by the model. That is, the model predicts a change in sensitivity as a function of frequency which is qualitatively the same as the change in sensitivity seen in VIIIth-nerve fibers, but the quantitative results depend upon the definition of the threshold of firing of a unit and a knowledge of the exact parameters of the system.
To summarize, this model of the peripheral auditory system seems capable of fitting certain available VIIIth-nerve data over a considerable range of stimuli. The important constituents of the model are a linear bandpass filter, followed by a nonlinear saturation function, followed by a probabilistic threshold device with refractory properties.
T. F. Weiss
References
1. N. Y-S. Kiang, T. Watanabe, Eleanor C. Thomas, and Louise F. Clark, Stim-ulus coding in the cat's auditory nerve, Ann. Otol. Rhinol. Laryngol. 71, 1009-1016 (1962).
2. G. von B6k6sy, Experiments in Hearing, edited by E. G. Wever (McGraw-Hill Book Company, Inc., New York, 1960).
3. A. A. Verveen, Fluctuation in Excitability (Drukkerij Holland N. V., Amsterdam, 1961); Axon diameter and fluctuation in excitability (in press).
4. J. L. Flanagan, Models for approximating basilar membrane displacement, Bell
System Tech. J. 39, 1163-1192 (1960).
5. J. E. Hind, Unit activity in the auditory cortex, Neural Mechanisms of the Audi-tory and Vestibular Systems, edited by G. L. Rasmussen and W. F. Windle (Charles C. Thomas, Springfield, Ill., 1960), p. 203.
6. J. C. R. Licklider, Basic Correlates of the Auditory Stimulus, Handbook of Experimental Psychology, edited by S. S. Stevens (John Wiley and Sons, Inc., New York,
1951), p. 995.
D. CORTICAL FACILITATION FOLLOWING ONSET OR TERMINATION OF A LIGHT
The present report concerns the shock-evoked response complex (SERC) recorded from the primary visual cortex. This response has been the subject of considerable study. The complex of deflections is obtained whether one delivers the "test" shocks to the optic nerve, chiasm, tract, the lateral geniculate body or the optic radiation.
(These deflections are usually numbered as illustrated in Fig. XV-8, trace D. 12) There is general agreement that deflection no. 1 is related to the volley of impulses in nerve
(XV. COMMUNICATIONS BIOPHYSICS)
fibers that feed into the cortex, and that deflections no. 3, no. 4, and no. 5 are measures of intracortical events resulting from this influx. The SERC for a given size of test shock may be modified by changing the animal's physiological state, or by changing con-ditions of retinal stimulation. The most striking modification of this SERC is an enhancement, which has been demonstrated under a number of conditions, including arousal by reticular stimulation or other means,3 ' 4 presentation of a continuous diffuse illumination,5 and retinal deafferentation. 6 Besides these effects which last long, there are transient changes in the SERC following a sensory or arousing stimulus. In this report we shall deal with such a transient effect; specifically, with a strong enhancement following the onset or termination of the presentation of a light. The effect is most clearly demonstrated when the shocks are delivered to the optic radiation rather than to more peripheral loci in the afferent pathway, and it is abolished by deep barbiturate anesthetization. The experiments were performed with unanesthetized cats with mid-pontine pretrigeminal brain-stem sections.
Recording was by a monopolar electrode (silver ball or cotton wick soaked in NaCl solution), with the neutral electrode on the skin of the neck. Shocks were delivered by concentric electrodes. The light source was a Westinghouse 47 bulb placed in the end of a hollow cylinder, 18 cm long and 3 cm in diameter. At the other end of the cylinder was a glass diffuser that was placed directly in front of the cat's eyes at a distance of approximately 8 cm. The bulb was excited by a 6-volt dc source. The electrocortical
SHOCKS
--
----LIGHT STIMULUSI
I
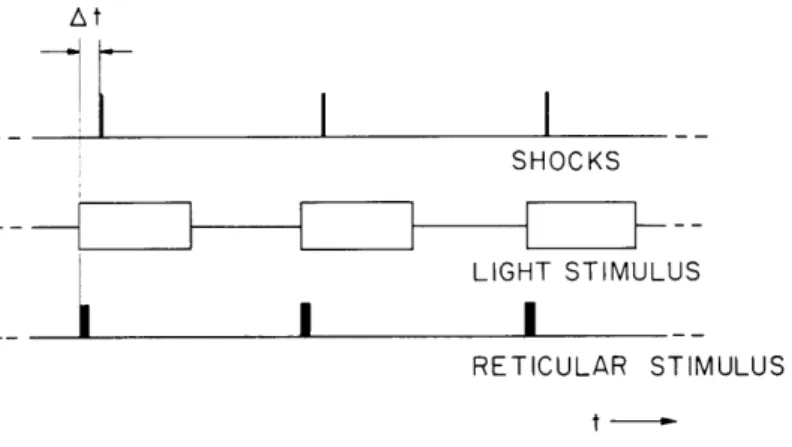
RETICULAR STIMULUS t-Fig. XV-7. Temporal pattern of stimuli. Top line shows the timing of the shocks to the optic pathway. Stimuli are delivered repetitively at the rate of 1 per
2 seconds or 1 per 4 seconds. In control conditions the cat is in the dark. When light or reticular stimulation is coupled with the shocks the time sequence is as shown, with AT the time between the onset of the electric signal to the light, or the train of shocks to the reticular formation (repre-sented by a solid bar) and the shock to the optic pathway. (For the time course of the light onset see Fig. XV-8.) Duration of the light stimulus is
I sec; duration of the train of shocks to the reticular formation, 0. 1 sec.
(XV. COMMUNICATIONS BIOPHYSICS)
activity was recorded on magnetic tape and processed by the ARC-1 average response
computer.
Figure XV-7 illustrates the temporal pattern of stimuli used in the experiments. The
average waveform of cortical responses to the onset of the light is shown in Fig. XV-8,
trace A.
Figure XV-8, trace B shows, on the same time and amplitude scale as in
trace A, the average of responses to the light together with a single shock to the optic
A
0
-50 MSEC---.
o
5 MSEC
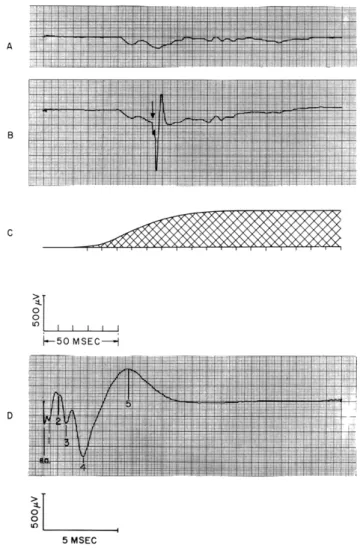
Fig. XV-8.
Evoked responses from primary visual cortex. A: average of responses
to the onset of the light.
B: average of responses to the onset of the light
together with a shock to the optic radiation homolateral to the recording
electrode delivered at the time indicated by the arrow. C: time course
of the light as measured by a photomultiplier tube. The trace starts at the
onset of the electric signal to the bulb.
D: detail of the part of the
wave-form in B following the shock. The shock artefact (s. a.) and
characteris-tic deflections of the shock-evoked response complex (SERC) are indicated
in this and subsequent figures.
The shocks are 4 v in amplitude, and 0. 2
msec in duration, and presented once every 4 seconds. In this and
subse-quent figures the number of responses in each average is 32.
-TT
Ff
P
(XV. COMMUNICATIONS BIOPHYSICS)
radiation delivered at the time marked by the arrow. Figure XV-8, trace C shows the time course of the onset of the light. It is clear that the SERC is larger and of much shorter duration than the response to the light alone, so that large changes in the sizes of its deflections cannot result from an addition of these two responses. Figure XV-8, trace D shows a more detailed view of the SERC on a different time scale.
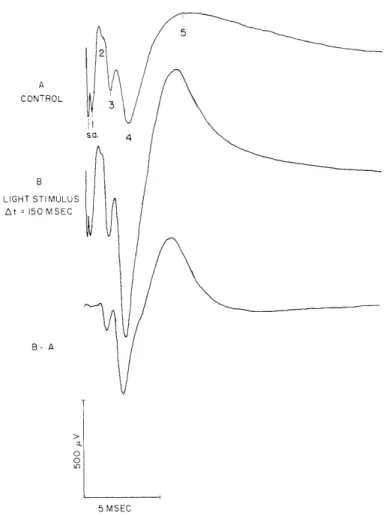
The enhancement effect is illustrated in Fig. XV-9. Figure XV-9, trace A shows the SERC (shocks delivered to the optic radiations) with control (dark) conditions.
Figure XV-9, trace B shows the SERC when the shocks are delivered 150 msec following the electric signal to the light source. (Note that there is an approximate 30-msec delay between this event and the light onset, see Fig. XV-8, trace C.) It is interesting to
5 2 A CONTROL S.Q. 4 B LIGHT STIMULUS At = 150 MSEC B- A 5 MSEC
Fig. XV-9.
Enhancement of the SERC by the onset of a light. A: average of responses
to shocks to the optic radiation under control conditions of darkness.
B: average of responses to shocks together with the presentation of light.
The third trace is the difference between the waveforms obtained in B and
A.
The shocks were given 150 msec after the electric signal to the light.
Other stimulus parameters are the same as in Fig. XV-8.
SHOCKS TO OPTIC CHIASM CONTROL3 4 LIGHT STIMULUS At = 150 MSEC RETICULAR STIMULUS At = 200M SEC 5MSEC
Fig. XV-10.
SHOCKS TO OPTIC RADIATION
CONTROL 4 12 LIGHT STIMULUS At = 2OOMSEC RETICULAR STIMULUS At = 200MSEC 0 5MSEC
Modification of the SERC by the onset of a light and by reticular
stimula-tion.
Left column shows averages of responses to shocks to the optic
chiasm, and their modification by the onset of a light and by the onset of
a train of shocks to the reticular formation. Right column gives similar
results for shocks delivered to the optic radiation.
The stimuli were
delivered repetitively at a rate of 1 per 2 seconds.
The shocks to the
chiasm were 4 v in amplitude, 0. Z2 msec in duration; those to the optic
radiation were 3 v in amplitude, 0. 2 msec in duration.
Reticular
stim-uli were 0. 1-sec trains of shocks having 2-volt amplitude, 300/sec rate,
and 0. 2-msec duration.
observe that only deflections no. 3, no. 4, and no. 5 are modified significantly. The differential waveform of Fig. XV-9 illustrates this point. A similar enhancement effect
may be demonstrated following termination of the light.
The rate of presentation of the light is important in determining the extent of enhancement. For rates of 1 per second, or greater, the enhancement is small. In several cases a considerably greater enhancement was observed for the rate of 1 per 4 seconds than for the rate of 1 per 2 seconds. The enhancement effect is obtained for a wide range of light intensities, and can be demonstrated with the stimulating light shining directly into the animal's eyes, or with the light overhead.
In a number of experiments we have attempted to enhance the SERC by retic-ular stimulation. In these midpontine pretrigeminal preparations such an enhance-ment is possible, but difficult to obtain. The effect is extremely sensitive to the location of the stimulating electrode in the reticular formation. When an enhancement is obtained it occurs in the period following the onset of the train of shocks to the reticular formation, and cannot be demonstrated during a con-tinuous reticular stimulation. This enhancement is greatest if the test shocks are delivered to the optic pathway approximately 200 msec after the onset of
(XV. COMMUNICATIONS BIOPHYSICS)
the train of shocks to the reticular formation. A 100-msec train of shocks to
the reticular formation seems to provide as much enhancement as a longer one. Figure XV-10 shows enhancement of the SERC for shocks to the optic chiasm and enhancement of the SERC to shocks to the optic radiations following retic-ular stimulation (third waveform in each column). Note that in both cases the size of deflection no. 1 is practically unchanged, while deflections no. 3, no. 4, and no. 5 are enhanced.Figure XV-10 also shows corresponding modification of the SERCs for shocks to the optic chiasm and optic radiations following the onset of a light (second waveform in
each column). For shocks delivered to the optic radiations results are very similar to those obtained with reticular stimulation. However, for shocks delivered to the optic
chiasm the modification is more complex; deflection no. 1 is smaller than in the control, while the later events show some enhancement.
We interpret these results as follows: Following the onset or termination of a light there is a facilitation of the neurons of the primary visual area of the cortex. This
facil-itation is demonstrated by the "test probe" of a shock to the optic radiations. There is an enhancement of the intracortical events 3, 4, and 5 in the SERC when the test shock is delivered in the appropriate time interval following the onset or termination of the light. The modification of the SERC when the test shock is delivered to the chiasm demonstrates an inhibitory effect which is caused by the retinal activity following the onset of the light. (Arduini and his co-workers 6' 7 have hypothesized and demon-strated that such an inhibition exists.) This inhibitory effect is evident in the decrease of deflection no. 1 (see Fig. XV-10). The facilitation of the cortical neurons following the flash is still evident in enhancement of the later deflections.
The mechanism of the enhancement effect is being investigated. Similarity of the waveforms for enhancement following the light onset and following a reticular stimulation
suggests that the effects may involve the reticular formation. An important feature of the enhancement is that it disappears completely following deep anesthetization by Nem-butal, which would not be at variance with this suggestion. However, there are findings that cast doubt upon a reticular involvement. First, there is the difficulty of obtaining the enhancement by reticular stimulation in the midpontine preparation, con-trasted with the constancy and ease of the demonstration of enhancement following onset or termination of light. Second, the interval between light onset (or termination) and the time of delivery of the test shock for greatest enhancement is considerably shorter than the corresponding interval between the onset of the train of shocks to the reticular forma-tion and the test shock. Finally, it appears that the enhancement following reticular
stimulation is diminished more by a very light dosage of barbiturate anesthetic than the enhancement produced by transients in the light. None of these findings provides con-clusive evidence one way or the other.
Further studies include a detailed investigation of the enhancement as a function of
the time between the light onset (or termination) and delivery of the test shock.
The
question whether the facilitation of cortical neurons is limited to the primary visual
area is also being investigated.
A. Cavaggioni, M. H. Goldstein, Jr., Eleanor K. Chance
References
1. G. H. Bishop and J. O'Leary, Potential records from the optic cortex of the cat,
J. Neurophysiol. 1, 391-408 (1938).
2.
F. Bremer and N. Stoupel, Analyse oscillographique comparde des r6ponses des
aires de projection de l'corce c6r6bral du chat, Arch. ital. Biol. 95, 1-19 (1957).
3.
F. Bremer and N. Stoupel, Facilitation et inhibition des potentials 6voqu6s
cor-ticaux dans l'veil c~rdbral, Arch. internat. Physiol. Bioch. 67, 240-275 (1959).
4.
S. Dumont and P. Dell, Facilitation r~ticulaire des m6canismes visuels
corti-caux, EEG Clin. Neurophysiol. 12, 769-796 (1960).
5. H. T. Chang, Cortical responses to stimulation of lateral geniculate body and
the potentiation thereof by continuous illumination of the retina, J. Neurophysiol. 15,
5-26 (1952).
6.
A. Arduini and T. Hirao, Enhancement of evoked responses in the visual system
during reversible retinal inactivation, Arch. ital. Biol. 98, 182-205 (1960).
7.
A. Arduini and M. H. Goldstein, Jr., Enhancement of cortical responses to
shocks delivered to lateral geniculate body. Localization and mechanism of the effects,
Arch. ital. Biol. 99, 397-412 (1961).
E.
STUDY OF THE HANDWRITING MOVEMENT
An experimental system to investigate the detailed properties of pen displacement
and velocity as a function of time during handwriting has been put into operation. A
commercial handwriting transmitter (Telautograph) has been modified so that its
out-put signals, voltages from two precision potentiometers mechanically coupled to the pen,
may be sampled, converted to digital form, and written on magnetic tape by the
TX-0 computer. The analysis of these data is carried out by the IBM 7090 computer of
the Computation Center, M. I. T.
Data analysis proceeds as follows.
The x and y coordinate sequences are first
recovered by solving the equations of mechanical constraint of the pen and then
differ-entiated to yield the pen velocity vector function. A segmentation into strokes is carried
out by using the zeros of the y velocity as segmentation points. A parametric
descrip-tion of the strokes thus obtained is determined on the basis of the following models.
1.
Model A
This model matches half-wave sinusoidal segments i
(t), y
(t) to the
experimen-tally obtained functions x(t) and
jr(t).
It corresponds closely to that of Eden1 with the
(XV.
COMMUNICATIONS BIOPHYSICS)
exception that his slope parameter a- has been replaced by a phase-shift parameter
for mathematical convenience.
Approximating Equations
xm(t) = X sin [w(t-t
0)+] + Xc
It
0 < t I tYm(t) = Y sin w(t-t
0)
Constraints
w = r/(t -to) (1)x (to) = (to)
(2)
x (t2) = x(t2) (3)2
m(t) dt =
2
(t) dt
(4)
to
t
t2
m(t) dt =
y(t) dt,
(5)
0
t0
where tO and t
2are the experimentally determined segmentation points.
2.
Model B
This model is an extension of Model A which allows for differences between the
acceleration and deceleration sections of any stroke.
The x-velocity amplitude, the
frequency, and the phase shift between x and y velocities are allowed to take on
dif-ferent values over the two ranges.
Approximating Equations
Wm(t) = X1 sin [wl (t-t 0)+l] +Xc
t < t = X2 sin [Wo2(t2-t)- 2] + Xc tl < t < tYm(t)
=
Y sin [o
l(t-t
0 ) ]to < t < t
=Y sin [w2(t2-t)]
t
1< t < t
C onstraints
Equations 2-5 of Model A and
W1
= 1T/2(t -t0)
02
= T/2(t2-tl)Xl cos 01 = X2 cos 2Z
WlX
I sin 1 = 2XZ sin(continuity at t=t
l)
(continuous derivative at t=t
) 'where t0 and t are experimentally determined segmentation points, as above, and
t1 is mathematically unconstrained but experimentally determined by minimizing the
rms error between the experimental and matching functions. 3. Discussion
Writing samples produced by two input methods were obtained from one subject and processed. The first utilized the handwriting transmitter mentioned above in which the writing is executed on a horizontal surface (Input 1). In the second the writing is exe-cuted on the vertical face of the TX-0 computer oscilloscope (Input 2). The rms error ratios (rms error/rms signal) have been calculated to obtain an indication of the matching accuracy for both velocity and displacement functions and are given in Table XV-1. The extension of these results to include data from different subjects is under way at the present time.
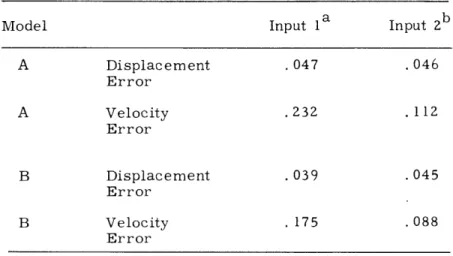
Table XV-1. Matching accuracy of handwriting models.
Model Input la Input 2b
A Displacement .047 .046 Error A Velocity .232 . 112 Error B Displacement .039 .045 Error B Velocity . 175 .088 Error aAverage of 9 samples bAverage of 4 samples
It is immediately apparent that a relatively poor match in the velocity domain will, when integrated, result in a quite acceptable match in the displacement domain. Hence, for Input 1, the input method of major interest, while Model A can be considered ade-quate in the displacement domain, it appears inadeade-quate for the study of the detailed
(XV. COMMUNICATIONS BIOPHYSICS)
intrastroke kinematics that are observable only in the velocity domain. Model B clearly effects a significant improvement for the velocity error over Model A. The differences between the two models for Input 2, for which the major part of the writing movement is executed by the elbow and the upper arm rather than the wrist and fingers, are much
reduced and thus indicate that the kinematics of the segments of positive and negative acceleration within any stroke are much more alike. The smaller errors obtained for Input 2 indicate that this mode of writing is smoother and corresponds more closely to a harmonic oscillator system.
For Model A five parameters [, X, , ,
]
and for Model B eight parameters [il'X2Z Xc ' ' 2' I' 2] are required to be known for the regeneration of any stroke. In each case the validity of the approximation is revealed by the close match between the original and regenerated two-dimensional handwriting patterns. The representations also achieve a reduction in the information storage per word over function samples at the minimum sampling frequency for perfect signal recovery if the velocity function is considered bandlimited at 20 cps.
The usefulness of the models for recognition work is primarily determined by the statistical properties of the above-given parameters. Experimental studies of the vari-ations in stroke parameters with writer and context, as well as their consistency in the absence of such variations, are now being carried out. It is desired to determine the conditional probability densities p(v /s.), where v. is the jth parameter and s. is the
th j 1
i stroke group, and strokes are grouped according to topological similarities. If the information content of the parameters is sufficiently high, that is, if p(v /s k) >> p(v/s 1) for all k * 1, then reliable recognition of which stroke group the sample belongs to may be expected. The strong statistical constraints in sequences of particular strokes are to be used in the final identification of the individual letters.
P. Mermelstein References
1. M. Eden, Handwriting and pattern recognition, IRE Trans., Vol. IT-8, pp.
160-166, 1962.
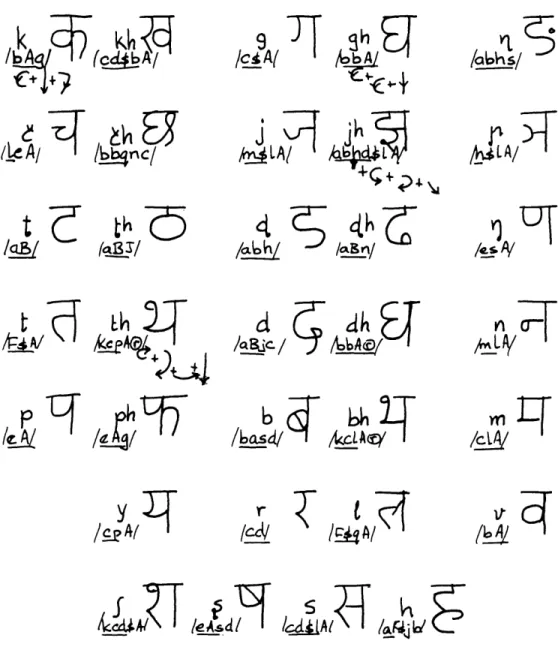
F. STROKE ANALYSIS OF DEVANAGARI CHARACTERS
Recent studies of the characteristics of English cursive handwriting have raised the question whether writing systems unrelated to English might be a useful comple-mentary study. For this purpose, the Devanagari script of India offers interesting possibilities because in its present form it has been fairly static for more than a
thou-sand years, despite the development of closely related scripts, such as Bengali and Gujarati, which are much faster to write.
It is only in the past hundred years that mechanical methods of writing have become
widespread in the West; and during the past decade strenuous efforts have been made to
develop a satisfactory typewriter for Indian languages.
Meanwhile, typesetting
equip-ment that can produce aesthetically satisfying printed material is also being sought. At
the present time, only hand-set type fonts making use of 400-800 pieces of type come
close to looking authentic, and such useful devices as linotype have basic structural
lim-itations that prevent them from accommodating such a variety of symbols.
Devanagari writing (used for Sanskrit, Hindi, Marathi, Punjabi, and in modified
form for Gujarati and Bengali) is syllabic.
That is, the unit of writing is the consonant
(or consonant cluster) combined with the following vowel, which is written to the left,
right, above or below.
This combination is called an akshar.
For example,
Vowels have a special written form when they appear without a preceding consonant.
1. Research Objectives
The aim of this-research, then, is to study the structure of the Devanagari symbols
with a view toward understanding whether and how the consonants and consonant clusters
(a brief survey uncovered 221 distinct clusters) can be generated, and described,
dis-tinguished or selected, in a consistent manner.
A consonant (or cluster) appearing alone is read as containing the "intrinsic" vowel,
/a/.
Frequency studies in Hindi and Marathi show that the most frequent occurrences
are of a single consonant with /a/,
and therefore we shall study the writing of the 33
Devanagari consonants first.
In this report a stroke analysis appropriate to Devanagari is presented, together
with the joining rules for normal writing.
These rules form a complete set with respect
to generation of the consonants, as shown in Fig. XV-11.
2.
Development of the Set of Basic Strokes
In contrast to English cursive script, penlifts occur in Devanagari even in the writing
of a single "letter." Strokes are written from left to right and from top to bottom. There
are very few exceptions.
It is possible to develop most of the strokes by applying two
kinds of transformations to a basic Straight Stroke
1 /A/
and Curved Stroke
,
/B/.
We call the operator Reflection (about a vertical), a.
We call the operator Rotation, B
(Rotation by 450, P
1; Rotation by
90
,
P.
) .Applying
P1
and
P2
to /A/, we get
A 1A P 2A - P A /' 2A PP2A P 32A
r r2 2 r 2 2
A2
A1 2
(XV.
COMMUNICATIONS BIOPHYSICS)
subscripts): /A/, /D/, /L/, /Q/. Applying a and 32 to /B/, we get
3B
ppB3J
j3B42
.?4-
Of these, all occur except the last. They are labelled (again, for convenience): /B/,
/E/, /J/, /N/, /H/, /M/, /K/.
Two other strokes
<-/f/
and
2 /g/ are reflections
of each other. Two miscellaneous strokes ) /C/ and ,. /P/ complete the set of 15
Basic Strokes.
The stroke sizes have been quantized to two levels.
For the larger, we use
upper-case labels; and for the smaller, we use lower-upper-case labels. (Concerning the third Basic
Stroke see II (iii) below.)
Al.'
BC ,
c.)J d\,e.u,
FC,9.2,h.)
C.j.
k..
U )/
For three strokes, both large and small sizes occur. In all other cases only the
smaller size is utilized.
A distinctive feature of Devanagari is the top line that "ties" together the character
(and is written last).
Certain characters have a broken top line, and for these /(r)/ is
added to the linear-form description of the character.
One other symbol, /s/, is used to signify a penlift.
Where this is redundant
infor-mation (the penlift being due to the direction in which the previous stroke was written),
/$/ is used.
3.
General Comments on Characteristic Features of the Strokes
We shall list some characteristic features of the strokes in a purely descriptive
manner.
Then we shall discuss some cases in which contextual clues are relevant to
the role of the individual stroke in forming the characters.
Relatively simple rules
suf-fice to indicate whether the larger or smaller size of a given stroke is to be used in a
given situation. Thus the same code could unambiguously apply to both. Similarly, in
certain contexts a variant on the usual form (or shape) of a stroke is used.
To simplify
reading, we have retained the lower- and upper-case designations in the "linear forms"
given in Fig. XV-11.
I.
Characteristic Features of the Strokes
(i) Written from top to bottom:
A B c d F g h
Written from left to right:
d e 1 p q
Written from right to left:
c F m n
Written from bottom to top:
J k q
(ii) Initial movement downward: A c d e m p
Initial movement to right:
d g h J p q
Initial movement to left:
B F k
Initial movement upward:
n q
(iii) Requiring counterclockwise movement: B e f
j
m p
Requiring clockwise movement:
c g h n k
(iv) Positioning in letter space: Height
Always found at same distance below top line: A a B c F G J k 1 m p
Height in character can vary:
b d e h n q
The rarity of strokes written leftward or upward, as indicated in I (ii), is even more
striking when the relative frequency of these strokes is taken into consideration.
The data of I (iv) indicate a high degree of redundancy, in that most strokes are not
found except in certain regions of the letter space and may perhaps explain the
reada-bility of the script despite its complexity.
II.
Notes on Certain Strokes
(i) /A,a/
Both large and small forms are always written from the top line
As an initial stroke, it occurs only as /a/
As medial or final stroke, it occurs only as /A/
It is interesting to note that none of the characters has a vertical line segment except
that hanging from the top line.
(ii) /B,b/
As an initial stroke this occurs only as /b/, starts from the top line
only in sequence /bb. .
Otherwise it is written in the middle of the
letter space.
In medial position the form is /b/ in context /abh/; otherwise B as in
aB, aBJ, aBn, aBjc.
(iii) /c/
This stroke has two forms. It is written
(J )
when followed by /1/;
otherwise it is written
(3
).
(iv) /e/
In context /le.
. /
the form is ( V) instead of the normal (u).
(v) /J,j/
In context /aBJ/ the form is ((i); i.e., /J/.
Otherwise (
),
/j/.
(vi) /1/ Always written at mid-height in letter space. The group /.. A. . / is
frequent and is uniformly written
-.
4. General Rules of Formation of Characters from Strings of Strokes
The rules presented below may be considered a preliminary set. As formulated at
present, they deal with the construction of the consonants.
They have been left flexible,
however, in order to accommodate the numerous and complex cases of conjunct
charac-ters. A significant feature of the rules is that transitional strokes are obviated except
bA
(
A/
,C+I+?
/e
A
t
iE_5
t
'N L)
/t 4 A/
*--SeA4 +
SLA/
+ ;
.
h
k
LO FI&6 AOD E
TbkC
2
r
T
t
I2
1 q2 A(
f
it E/
5
IkIA1F
Fig. XV- 11.
The 33 Devanagari consonants and their
"linear" representation.
QPR No. 69
/,9A(
/abbs/
YL
p
UT
b
/
.jc
/
P/
/A
Er
L 9
nbsc
14 C/
LLSIg
4i6
k?
236r~bA/
gh
a
Ye~ J,
CrP
/LA
0
III. General Rules
(i) The highest point of the first stroke is always at the top line, except that initial
/b/, /F/, /h/, /I/,
/m/ are written at mid-height.
(Note that initial /bb.
. /
is
written from the top line.)
(ii) Strokes always commence from the end point of the previous stroke except as
in III (v) below.
(iii) Mark
/$/
implies a penlift that is due to the direction of stroke, and is a
redun-dant instruction. Mark /s/ implies a penlift that is due to the fact that the
char-acter has two segments, and implies a space left between the segments.
(iv) After the listed strokes comes the conventional top line. In cases in which the
additional instruction /(r)/ is added, it implies that the top line is written over
the right half of the character only.
(v) Added transitional strokes are used before and after /A/ as follows:
X