HAL Id: inserm-00369925
https://www.hal.inserm.fr/inserm-00369925
Submitted on 23 Mar 2009HAL is a multi-disciplinary open access archive for the deposit and dissemination of sci-entific research documents, whether they are pub-lished or not. The documents may come from teaching and research institutions in France or abroad, or from public or private research centers.
L’archive ouverte pluridisciplinaire HAL, est destinée au dépôt et à la diffusion de documents scientifiques de niveau recherche, publiés ou non, émanant des établissements d’enseignement et de recherche français ou étrangers, des laboratoires publics ou privés.
High reproducibility of two-dimensional liquid
chromatography using pH-driven fractionation with a
pressure-resistant electrode.
Elsa Suberbielle, Daniel Gonzales-Dunia, Frédéric Pont
To cite this version:
Elsa Suberbielle, Daniel Gonzales-Dunia, Frédéric Pont. High reproducibility of two-dimensional liquid chromatography using pH-driven fractionation with a pressure-resistant electrode.: High reproducibil-ity of two-dimensional liquid chromatography using pH-driven fractionation with a pressure-resistant electrode.. Journal of Chromatography B - Analytical Technologies in the Biomedical and Life Sci-ences, Elsevier, 2008, 871 (1), pp.125-9. �10.1016/j.jchromb.2008.06.043�. �inserm-00369925�
High reproducibility of two-dimensional liquid chromatography
separation of intact proteins using pH-driven fractionation with a
pressure-resistant electrode
Elsa Suberbielle1, Daniel Gonzalez-Dunia1 and Frédéric Pont2*
1,2
INSERM, U563, Toulouse, France; 1,2Université Paul-Sabatier, Toulouse, France;
2
Plateau Technique de Spectrométrie de Masse, Institut Claude de Préval (IFR30),
Toulouse, France.
*To whom correspondence should be addressed: Service de Spectrométrie de
Masse de l'IFR30, Bât B Pavillon Lefèbvre, CHU Purpan, BP 3028, 31024 Toulouse
Cedex 3, France. Phone: +33 5 6274 8398; Fax: +33 5 6274 8384; Email:
frederic.pont@toulouse.inserm.fr
Running title: two-dimensional liquid chromatography reproducibility in proteomics
5
10
The abbreviations used are: 2D-LC, two-dimensional liquid chromatography; 2-DE,
two-dimensional gel electrophoresis; HPLC, high performance liquid
chromatography; MS, mass spectrometry; HPCF, high performance
chromatofocusing; RPHPLC, reverse phase high performance liquid
chromatography; NPS, non-porous silica; ACN, acetonitrile; TFA, tri-fluoro-acetic
acid.
Abstract
Two-dimensional liquid chromatography using the PF2D system from Beckman
Coulter is increasingly used in proteomics to provide an automated fractionation
platform and to circumvent some limitations of fractionation using 2-D
electrophoresis. To date, the reliability and reproducibility of the PF2D fractionation
procedure has not been formally tested. Here, we used an optimized software and a
pressure-resistant pH electrode, allowing a precise and reproducible control of the pH
limits for each fractions. We tested the reliability of this improved system by
performing several rounds of PF2D using aliquots of the same protein extract. Three
UV maps were generated, leading to 54 chromatograms and more than 3000 protein
peaks. We used a semi-automated software tool for peak-to-peak comparison
between 2D-LC fractionation experiments to provide an accurate measurement of the
reproducibility. The mean peak concordance was very high. The rates of
concordance were higher in the second dimension repeatability tests, indicating that
the limiting factors in 2D-LC reproducibility rely in the pI fractionation and sample
preparation steps. The reproducibility between maps was closely related to pH curves
25
30
35
similarities, further stressing the need of careful pH adjustment and precise electrode
calibration. Combined with good laboratory practice, 2D-LC using the PF2D system is
a reproducible fractionation platform well suited for differential proteomics.
Introduction
One of the main challenges in proteomics centers on the ability to generate a
reproducible fractionation of the protein samples. Indeed, the discovery of novel
biomarkers, together with studies of disease pathogenesis, such as for cancer, rely
on differential proteomics i.e., on the accurate comparison between control and
pathological situations (1). Although the resolution and speed of mass spectrometers
have been significantly improved these recent years, protein fractionation still
represents a limiting step in a proteomic study. Indeed, it has been shown that the
improvement of the fractionation step significantly increases the number of proteins
that can be subsequently analyzed by a mass spectrometer, thereby resulting in a
dramatic increase of the dynamic range of an analysis (2). To date, there is no single
fractionation strategy that has demonstrated the capacity to cover the whole
proteome, but several complementary approaches are now available. Protein
fractionation has been traditionally performed using 2-DE. However, this
franctionation method exhibits several limitations. It often restricts the analysis to the
most abundant proteins, has demonstrated a relative lack of reproducibility and has
trouble resolving proteins of extreme hydrophobicity, mass or isoelectric point (pI) (3,
4). To circumvent these limitations and to provide an alternative to 2-DE, liquid-based
50
55
2D liquid chromatographic (2D-LC) systems have been developed (5). The recent
availability of an automated system based on 2D-LC, the Proteome-LabTM PF2D from
Beckman Coulter, facilitates the effective implementation of a 2D-LC experiment. The
PF2D system separates proteins in the first dimension according to their pI using
chromatofocusing, followed by a fractionation according to hydrophobicity, using
reversed phase chromatography in the second dimension. The pI-based
fractionation, as performed during the first dimension of the PF2D (and in 2-DE), has
been shown to be especially useful to study proteins post-translational modifications,
such as phosphorylation (6). Several recent proteomic studies comparing the
different available fractionation strategies have shown that the different technologies
are highly complementary, with a remarkably low number of common proteins
identified by all technologies (7, 8). However, it seems clear that 2D-LC allows the
identification of more proteins than 2D-gels and may be more suited for novel protein
discovery (7, 8).
Automated 2D-LC fractionation, such as that provided by the PF2D system, is
relatively new and the reliability and reproducibility of this fractionation procedure
remains to be formally assessed and quantified accurately. It was shown that PF2D
could generate relatively reproducible UV profiles, based on the visual examination of
the chromatograms (9-11). However, a certain level of variability was due to the
65
70
75
dynamic nature of the pI fractionation in the first dimension fractionation. As a result,
the pH limits of the fractionation gradient could not be fixed, leading sometimes to
small shifts in fractionation. In this work, we present a systematic assessment of the
reproducibility of PF2D fractionation, using an improved methodology for the first
dimension fractionation. We used a software patch, ensuring that all fractionation
experiments would start at the exact same pH value. In addition, we used a prototype
pH electrode allowing the accurate pH measurement under pressure. We tested the
reliability of this improved system by performing several rounds of PF2D fractionation
using aliquots of the same protein extract. We used a semi-automated software tool
for peak-to-peak comparison between 2D-LC fractionation experiments, facilitating
the systematic analysis of more than 3000 peaks. We provide herein the first formal
demonstration of the high level of reproducibility of PF2D fractionation, which
underscores the interest of this fractionation method for studies of differential
proteomics.
85
90
Experimental
Cell cultures - Vero E6 cells (ATCC CRL-1586) were grown to confluence in DMEM
(Gibco-Invitrogen), supplemented with 10% heat-inactivated fetal calf serum (PAA)
and 1X Bufferall (Sigma-Aldrich). Cells (140 x 106) were harvested by scraping,
washed once in Phosphate Buffered Saline (Invitrogen) and recovered by
centrifugation for 5 min. at 430 x g at room temperature. Cell pellets were then
resuspended in lysis buffer (ProteomeLabTM PF2D, Beckman) containing a cocktail of
protease inhibitors (Sigma-Aldrich) and lysis was performed according to the
ProteomeLabTM PF2D human cell lysis protocol. Protein concentration was
determined using the 2D quant protein assay (Amersham, Biosciences, Piscataway,
NJ, USA). Aliquots of cell extracts were stored at -80 °C until ready for use.
Liquid chromatography - Prior to chromatofocusing, an aliquot of the cell extract was
thawed, desalted on a PD-10 SephadexTM G-25 gel filtration column with a 5 kDa
cut-off (Amersham Biosciences, Piscataway, NJ, USA) and eluted using the
chromatofocusing Start Buffer. 1.5 mg of protein extract was used in each 2D-LC
experiment. 2D-LC was performed using the ProteomeLabTM PF2D Protein
Fractionation System (Beckman Coulter, Fullerton, CA, USA), which consists of two
100
105
110
HPLCs, two UV detectors, an auto sampler and a fraction collector. The first
dimension fractionation of PF2D consists in chromatofocusing, based on charge.
After collection of the fractions from the first dimension in the collector module, each
of them is automatically introduced into the second dimension reversed phase
chromatography column, which separates proteins based on their hydrophobicity. The
fractions can be finally collected into 96-deep-well plates.
Chromatofocusing was performed on an HPCF 1-D column (250 x 2.1 mm, Beckman
Coulter). This first dimension HPLC module was equipped with a 5 ml sample loop.
The signal was recorded at 280 nm. The pH gradient was generated using Start
Buffer (pH 8.5) and Elution Buffer (pH 4), both included in the ProteomeLabTM PF2D
kit. The chromatofocusing column was first equilibrated for 130 minutes with Start
Buffer at pH 8.5 at a flow rate of 0.2 ml/min, before being loaded with 1.5 mg of the
desalted protein extract. The flow-through was collected and after a stable baseline
was established (35 minutes), a linear pH gradient was initiated by infusing the
elution buffer for 95 minutes with a constant flow rate of 0.2 ml/min. The proteins with
a pI < 4 were finally eluted by washing the column with 1 M NaCl. A software patch
(SP1 Beckman Coulter) was used to ensure that each fraction collection experiment
would start at a pH value of 8.3. Fraction collection from the first dimension was
controlled with an in-line pH meter equipped with a prototypic pressure-resistant pH
120
125
130
electrode (replacement kit p/n A48657). Fractions were collected every 10 min,
except during the pH gradient portion of the run, from pH 8.5 to 4.0, when fractions
were collected at 0.3 pH unit-intervals.
The second dimension analysis used a nonporous RPHPLC using a C18 column (4.6
x 33 mm, Beckman Coulter) packed with 1.5 µm non-porous silica and kept at 50 °C
in a heated column jacket. Eighteen fractions from the first dimension were injected in
the NPS-C18 column and eluted using a water/acetonitrile gradient at 0.75 ml/min.
The injection volume was between 50 and 500 µl depending on the protein
concentration in the first dimension fraction. Solvent A was 0.1% TFA in water and
solvent B was 0.08% TFA in ACN. The gradient consisted in 100% solvent A for 2
minutes, 0-100% solvent B for 30 min and 100% solvent B for 4 minutes. The UV
signal was recorded a 214 nm.
Chromatogram analysis - Chromatograms were integrated using the 32Karat software
(Beckman Coulter, Fullerton, CA, USA). Data containing the surfaces and retention
times of the peaks were exported as a text file and a peak-to-peak analysis was
performed using the 4.020 version of the GC-LC-concordance software
(Spectrochrom, Bouc Bel Air, France. http://www.spectrochrom.com/). Briefly, this
software converts the chromatograms into histograms and performs pair-wise
comparisons. The software automatically finds the best quadratic equation to model
140
145
the peak positions using the retention time tolerance and the equation order specified
by the operator. A surface ratio between concordant peaks can also be calculated
and used as a constraint to exclude peaks. The retention time tolerance was set to
5% and the surface of the peaks analyzed was set between 0.1% and 100% of the
largest peak area. The percentage of concordance between the chromatogram A and
B was calculated as follows:
% concordance = (number of peaks in chromatogram A concordant with
chromatogram B x 100) / (total number of peaks in chromatogram B)
In addition to the peak-to-peak analysis using the GC-LC-concordance software,
each concordant peak was visually examined and validated. When required, some
peaks were manually integrated, in particular when a shoulder was not correctly
detected by the automated analysis.
155
160
Results and discussion
Sample preparation: the procedure used for sample preparation is an important
parameter that can drastically affect reproducibility and is particularly important
during the design of a differential proteomic study. For our repetitive 2D-LC maps, we
prepared aliquots of the same cellular extract that were stored in the lysis buffer at
-80 °C, to limit the risks of protein degradation. The simultaneous preparation of the
cellular extracts for all repetitive PF2D rounds allowed us to ensure that any residual
proteolysis occurring during the lysis procedure would be similar for all experiments,
thereby limiting the addition of another variable in the analysis. However, the last
steps of desalting/gel filtration of the sample were performed prior to each
fractionation experiment, to match the conditions of a differential proteomic study, in
which these steps are mandatory and could be responsible for a decrease in
reproducibility.
Chromatofocusing fractionation: One of the limitations of the chromatofocusing step
in the PF2D system is the difficulty to precisely control the pH gradient from one run
to another. Although the fraction collector is triggered by an online pH meter, there is
still a significant level of variability, due to the difficulty to measure accurately a pH
170
175
180
value under pressure. Indeed, the pH electrode has been designed to detect
accurately pH changes, but not necessarily to record precise pH values. As a result,
the repeatability of this fractionation step is completely dependent on the repeatability
of the pH gradients. In addition, the pH limits of the fractions are not exactly similar
between maps, which further complicates the analysis. In this work, we have
implemented two significant improvements to the PF2D chromatofusing step. First,
we used a novel prototypic electrode (p/n A48657) that has been designed not only to
accurately measure changes in pH, but also to give accurate pH measurements
under pressure. With this new electrode, the pH value under pressure was 8.51 ±
0.01 at the beginning of the gradient for all three experiments (Figure 1). This pH
value measured at a calibrated bench pH meter was 8.55, indicating that the
accuracy of the measurements under pressure is in the range of 0.04 pH units.
Second, we used a software patch, which enables the fractions to start precisely at
pH 8.30 for each experiment. Consequently, the pH limits for each fraction are exactly
the same between experiments (Figure 1), provided that the collection volume is not
limiting. As a matter of fact, we increased the collecting time to 10 minutes, because
we observed that the volume could be limiting for some fractions of the gradient with
the usually recommended collecting time of 8.5 min. Indeed, reproducibility was
improved when comparing a collecting time of 10 minutes and 8.5 minutes (data not
190
195
shown).
Chromatogram concordance analysis: A total of 54 chromatograms were generated,
representing more than 3000 peaks. In order to assess accurately the reproducibility
of the chromatograms with such a large amount of data, we performed a
peak-to-peak analysis using a modified version of the GC-LC-concordance software. This
software enables the comparison of two histograms obtained after peak integration of
the chromatograms (Figure 2). The software uses a mathematical model and the
retention time error to determine the theoretical position of a peak (see methods).
Second dimension repeatability: the repeatability of the second dimension is an
important parameter to test because it gives the theoretical limit of the repeatability of
the 2D-LC experiment. To test for the second dimension repeatability, the same
series of first dimension fractions were used several times for a second dimension
fractionation. The use of a C18 NPS column in association to a UV detector at 214
nm enables the detection of proteins in the nanogram up to the microgram range
(13). For this reason the chromatograms were analyzed with a dynamic range of 103.
When testing the reproducibility of a simple chromatogram containing about 30
peaks, the peak concordance between chromatograms was 100% (Figure 3A).
The most complex chromatogram of a 2D-LC experiment is generally obtained with
205
210
215
the fraction of basic proteins (pI > 8.5) not retained by the column. We injected this
fraction in triplicate onto the NPS column and we obtained chromatograms of about
80 peaks (Figure 3B). With these complex chromatograms, the peak concordance
between chromatograms was 96.76 ± 0.98 % (n = 3) .
The lower concordance rate for complex chromatograms may be due to different
factors. First, it is important to note that most of the peaks are not well resolved in
these complex chromatograms. Indeed, MS analysis of 2D-LC peaks has shown that
most of the peaks are in fact composed of a mixture of proteins. A large peak can
contain 10, 20 or even more proteins. Therefore, the peak integration of such
chromatograms is a critical step, since a small change in a shoulder slope can be
responsible for a different integration of the same peak between two chromatograms.
As a result, the same peak will be split into two peaks in one case and not in the
other, creating a mismatch immediately detected during the software processing of
the chromatograms. Second, this decreased concordance rate may be the result of
local deformations of the chromatograms, due to slight variations in the ACN gradient
between experiments. An example of these local deformations is shown on Fig 3B,
where we observed that the first peaks of the top chromatogram had a slightly higher
retention time than the 2 other chromatograms. While not globally affecting the rest of
the chromatogram, this nevertheless impacted the resolution of peaks located at
225
230
235
around 12 min (Fig 3B).
In any event, the concordance rates remained remarkably high, and our results
indicate that the second dimension is repeatable enough to detect small changes in
peak intensities.
2D proteins maps: Three 2D maps were obtained after subjecting aliquots of the
same protein extract to the whole PF2D fractionation procedure, including sample
preparation. The maps were obtained with a starting protein amount of 1.5 mg. In
some fractions, the protein amount was barely sufficient to obtain a good UV signal,
stressing the necessity of using at least 1.5 mg of protein to obtain a satisfactory map
when working with a whole proteome. A visual inspection of the maps revealed good
similarities and the differential maps displayed peaks of small intensities, indicating a
good reproducibility of the experiments (data not shown).
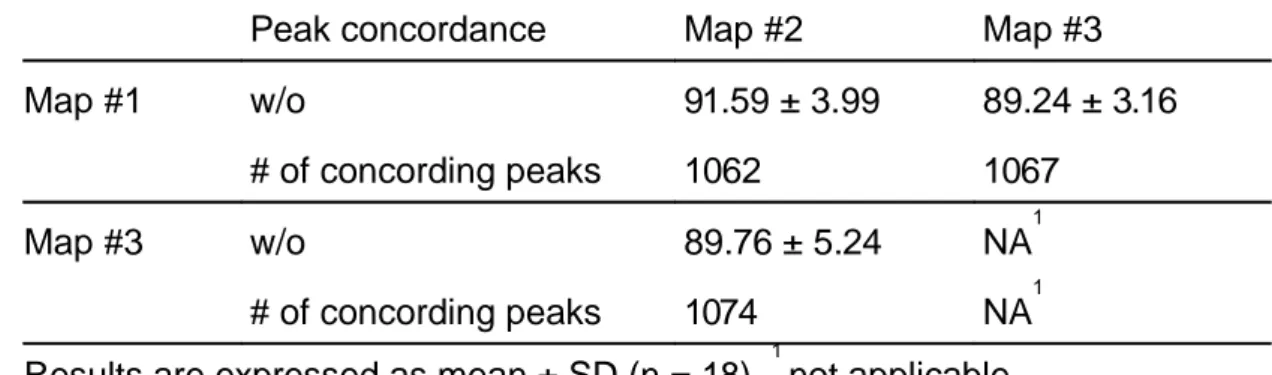
A peak-to-peak analysis of all chromatograms was performed, leading to an accurate
measurement of the reproducibility. Results of the map-to-map reproducibility are
displayed in Table I.
When performing the overall analysis of the reproducibility between all three
experiments, we concluded that the mean peak concordance was 90.19 ± 4.26 % (n=
54). It should be stressed that these values reflect faithfully the reproducibility of the
245
250
whole fractionation procedure, including not only the two HPLC steps of 2D-LC but
also the last steps of sample preparation, in particular the gel filtration step, and the
potential impact of sample storage.
In order to explain the slight variations in reproducibility observed between the three
performed experiments, we calculated the residual sum of squares (RSS) for each
couple of curves of the pH gradients. The RSS is an evaluation of the distance
between two pH curves and we found that the RSS(#1,#2) = 6.7, the RSS(#2,#3) =
8.19 and the RSS(#1,#3) = 13.62. Therefore, it appears that the most reproducible
maps have also the most reproducible pH curves, further stressing the importance of
this initial fractionation step and the interest of the improvements tested herein. In any
event, it remains clear that the reproducibility of a fractionation experiment using
PF2D depends on several, non exclusive parameters: the reproducibility of the
sample preparation and the effect of sample storage, the reproducibility of the pH
curves during the fractionation and the reproducibility of the second dimension
gradient. Our results indicate that the reliability of fractionation using PF2D is well
suited to perform an accurate differential proteomic study. It should nevertheless be
kept in mind that this two-dimensional fractionation method will not permit the
complete fractionation of all the proteins from a global cell extract and that the UV
intensity of a peak reflects the signal of a mixture of proteins. However, the high level
260
265
270
of reproducibility of the 2D maps, as demonstrated in this study, enables a quick
identification of the fractions in which an abundant protein is responsible for a UV
change. In addition, when a subproteome is analyzed by 2D-LC, the resulting peaks
are sharper and less coelution is observed (14). In most cases, a subsequent
quantification strategy by MS will nevertheless be required to evaluate the amount of
each protein individually, either at the level of the intact protein (15) or at the peptide
level after tryptic digestion (12).
Conclusions
Here, we provide the first comprehensive assessment of protein fractionation using
PF2D, by performing a systematic peak-to-peak measurement of 2D-LC
reproducibility. We took advantage of recent hardware and software improvements in
the chromatofocusing step of 2D-LC, in particular the use of a new pH electrode
giving accurate measurements under pressure combined with a software modification
enabling a fractionation based on fixed pH values. Our results demonstrate the high
level of reproducibility of the PF2D system, indicating its suitability for differential
proteomic studies.
280
285
290
Acknowledgements
This work was supported by grants from INSERM, from Région Midi-Pyrénées, from
the Genopôle and Canceropôle Grand-Sud-Ouest and from an
ANR-06-MIME-005-01 grant to DGD. ES is a recipient of a "poste d'accueil" from INSERM.
DGD is supported by the CNRS.
The authors would like to acknowledge Beckman Coulter and especially Jerald S.
Feitelson, Michael Simonian and Jeff Chapman for their support and for providing the
prototype electrode and software patches. Raymond Loyer, from Spectrochrom, is
acknowledged for providing the GC-LC-concordance software and for his useful
collaboration in the tuning of the mathematical parameters.
300
REFERENCES
1. Monteoliva, L. and Albar, J.P. (2004) Differential proteomics: an overview of
gel and non-gel based approaches. Brief Funct Genomic Proteomic 3, 220-239
2. Sheng, S., Chen, D. and Van Eyk, J.E. (2006) Multidimensional liquid
chromatography separation of intact proteins by chromatographic focusing and
reversed phase of the human serum proteome: optimization and protein database.
Mol. Cell Proteomics 5, 26-34
3. Issaq, H.J. and Veenstra, T.D. (2007) The role of electrophoresis in disease
biomarker discovery. Electrophoresis 28, 1980-1988
4. Skalnikova, H., Halada, P., Dzubak, P., Hajduch, M. and Kovarova, H. (2005)
Protein fingerprints of anti-cancer effects of cyclin-dependent kinase inhibition:
identification of candidate biomarkers using 2-d liquid phase separation coupled to
mass spectrometry. Technol. Cancer Res. Treat. 4, 447-454
5. Lubman, D.M., Kachman, M.T., Wang, H., Gong, S., Yan, F., Hamler, R.L.,
O'Neil, K.A., Zhu, K., Buchanan, N.S. and Barder, T.J. (2002) Two-dimensional liquid
separations-mass mapping of proteins from human cancer cell lysates. J.
Chromatogr. B Analyt. Technol. Biomed. Life Sci. 782, 183-196
6. Zhu, K., Zhao, J., Lubman, D.M., Miller, F.R. and Barder, T.J. (2005) Protein pI
shifts due to posttranslational modifications in the separation and characterization of
proteins. Anal. Chem. 77, 2745-2755
7. McDonald, T., Sheng, S., Stanley, B., Chen, D., Ko, Y., Cole, R.N., Pedersen,
310
315
320
P. and Van Eyk, J.E. (2006) Expanding the subproteome of the inner mitochondria
using protein separation technologies: one- and two-dimensional liquid
chromatography and two-dimensional gel electrophoresis. Mol. Cell Proteomics 5,
2392-2411
8. Li, X., Gong, Y., Wang, Y., Wu, S., Cai, Y., He, P., Lu, Z., Ying, W., Zhang, Y.,
Jiao, L., He, H., Zhang, Z., He, F., Zhao, X. and Qian, X. (2005) Comparison of
alternative analytical techniques for the characterisation of the human serum
proteome in hupo plasma proteome project. Proteomics 5, 3423-3441
9. Park, K.H., Lipuma, J.J. and Lubman, D.M. (2007) Comparative proteomic
analysis of b. cenocepacia using two-dimensional liquid separations coupled with
mass spectrometry. Anal. Chim. Acta 592, 91-100
10. Soldi, M., Sarto, C., Valsecchi, C., Magni, F., Proserpio, V., Ticozzi, D. and
Mocarelli, P. (2005) Proteome profile of human urine with two-dimensional liquid
phase fractionation. Proteomics 5, 2641-2647
11. Yan, F., Subramanian, B., Nakeff, A., Barder, T.J., Parus, S.J. and Lubman,
D.M. (2003) A comparison of drug-treated and untreated hct-116 human colon
adenocarcinoma cells using a 2-d liquid separation mapping method based upon
chromatofocusing pI fractionation. Anal. Chem. 75, 2299-2308
12. Old, W.M., Meyer-Arendt, K., Aveline-Wolf, L., Pierce, K.G., Mendoza, A.,
Sevinsky, J.R., Resing, K.A. and Ahn, N.G. (2005) Comparison of label-free methods
for quantifying human proteins by shotgun proteomics. Mol. Cell Proteomics 4,
1487-1502
13. Dauly, C., Perlman, D.H., Costello, C.E. and McComb, M.E. (2006) Protein
separation and characterization by np-rp-hplc followed by intact maldi-tof mass
330
335
340
345
spectrometry and peptide mass mapping analyses. J. Proteome Res. 5, 1688-1700
14. Cussac, D., Pichereaux, C., Colomba, A., Capilla, F., Pont, F., Gaits-Iacovoni,
F., Lamant, L., Espinos, E., Burlet-Schiltz, O., Monsarrat, B., Delsol, G. and
Payrastre, B. (2006) Proteomic analysis of anaplastic lymphoma cell lines:
identification of potential tumour markers. Proteomics 6, 3210-3222
15. Zhao, J., Chang, A.C., Li, C., Shedden, K.A., Thomas, D.G., Misek, D.E.,
Giordano, T.J., Beer, D.G. and Lubman, D.M. (2007) Comparative proteomic analysis
of barrett's metaplasia and esophageal adenocarcinomas using 2-d liquid mass
mapping. Mol. Cell Proteomics 6, 987-999
355
Figure Legends
Figure 1. Reproducibility of the pH gradients using the optimized PF2D system.
pH gradients from experiments #1(circles), #2 (squares), #3 (diamonds) generated
during the chromatofocusing step. The gradients were generated inside the
chromatofocusing column by injecting an eluent buffer at pH 4.0 in the column,
previously equilibrated with the start buffer at pH 8.5. Vertical dotted lines represent
the fractions limits, which start at pH 8.3 and end at pH 4.0. The software patch SP1
enables fractions from each experiment to have exactly the same pH limits.
Figure 2. Comparative chromatogram analysis using the GC-LC-concordance software. Screenshot of one analysis output. The chromatograms were integrated
and converted into histograms, with bar lengths being proportional to the original
peak surface. Two mirroring histograms are represented in black. Concording peaks
are linked together by blue lines, while non-concording peaks are tagged with a red
line.
365
370
Figure 3. Representative examples of the repeatability of 2D-LC fractionation.
Top: protein UV (214nm) profiles obtained after two injections of the same first
dimension fraction (pH 6.8-7.1) on a C18 NPS column. Inset: detail of the peak
integration performed by the 32karat software for the analysis. The inset table shows
the results of peak concordance.
Bottom: protein UV (214nm) profiles obtained after three injections of the same first
dimension fraction (pH>8.5) on a C18 NPS column. The inset table shows the results
of peak concordance.
Tables
TABLE 1: Mean peak concordance between 2D maps (%)
Peak concordance Map #2 Map #3 Map #1 w/o 91.59 ± 3.99 89.24 ± 3.16
# of concording peaks 1062 1067 Map #3 w/o 89.76 ± 5.24 NA1
# of concording peaks 1074 NA1 Results are expressed as mean ± SD (n = 18). 1 not applicable
380
385
Figures
Figure 1.
Figure 2.