HAL Id: hal-02138814
https://hal.inria.fr/hal-02138814
Submitted on 20 Jul 2020HAL is a multi-disciplinary open access archive for the deposit and dissemination of sci-entific research documents, whether they are pub-lished or not. The documents may come from teaching and research institutions in France or abroad, or from public or private research centers.
L’archive ouverte pluridisciplinaire HAL, est destinée au dépôt et à la diffusion de documents scientifiques de niveau recherche, publiés ou non, émanant des établissements d’enseignement et de recherche français ou étrangers, des laboratoires publics ou privés.
Plasma protein biomarkers and their association with
mutually exclusive cardiovascular phenotypes: the
FIBRO‑TARGETS case–control analyses
Joao Pedro Ferreira, Anne Pizard, Jean-Loup Machu, Emmanuel Bresso,
Hans-Peter Brunner-Larocca, Nicolas Girerd, Céline Leroy, Arantxa González,
Javier Díez, Stephane Heymans, et al.
To cite this version:
Joao Pedro Ferreira, Anne Pizard, Jean-Loup Machu, Emmanuel Bresso, Hans-Peter Brunner-Larocca, et al.. Plasma protein biomarkers and their association with mutually exclusive cardiovascular pheno-types: the FIBRO‑TARGETS case–control analyses. Clinical Research in Cardiology, Springer Verlag, 2020, 109 (1), pp.22-33. �10.1007/s00392-019-01480-4�. �hal-02138814�
Plasma protein biomarkers and their association with mutually exclusive cardiovascular phenotypes: the FIBRO-TARGETS case-control analyses
João Pedro Ferreira*1,2 & Anne Pizard*1; Jean-Loup Machu1; Emmanuel Bresso3; Hans-Peter
Brunner-La Rocca4; Nicolas Girerd1; Céline Leroy1; Arantxa González5,6; Javier Diez5,6,7; Stephane
Heymans7,8,9; Marie-Dominique Devignes3; Patrick Rossignol1 & Faiez Zannad1
On behalf of the FIBRO-TARGETS investigators
*co-first authors
1. Université de Lorraine, Centre d’Investigation Clinique- Plurithématique Inserm CIC-P 1433, and Inserm U1116, CHRU Nancy Brabois, F-CRIN INI-CRCT (Cardiovascular and Renal Clinical Trialists), Nancy, France
2. Department of Physiology, University of Porto, Porto, Portugal. 3. Université de Lorraine, CNRS, Inria, LORIA, Nancy, F-54500, France.
4. Department of Cardiology, CARIM, Maastricht University Medical Center, Maastricht, the Netherlands.
5. Program of Cardiovascular Diseases, Centre of Applied Medical Research, University of Navarra, Pamplona, Spain.
6. CIBERCV, Carlos III Institute of Health, Madrid, Spain.
7. Departments of Cardiology and Cardiac Surgery and Nephrology, Clinic University of Navarra, Pamplona, Spain.
8. Department of Cardiology, CARIM School for Cardiovascular Diseases Faculty of Health, Medicine and Life Sciences, Maastricht University, The Netherlands.
9. Department of Cardiovascular Sciences, Centre for Molecular and Vascular Biology, KU Leuven, Belgium.
Abstract
Background: Hypertension, obesity and diabetes are major and potentially modifiable “risk factors”
for cardiovascular diseases. Identification of biomarkers specific to these risk factors may help understanding the underlying pathophysiological pathways, and developing individual treatment.
Methods: The FIBRO-TARGETS (Targeting Cardiac Fibrosis for Heart Failure Treatment)
consortium has merged data from 12 patient cohorts in one common database of >12,000 patients. Three mutually-exclusive main phenotypic groups were identified (“cases”): 1) “hypertensive”; 2) “obese”; and 3) “diabetic”; age-sex matched in a 1:2 proportion with “healthy controls” without any of these phenotypes. Proteomic associations were studied using a biostatistical method based on LASSO and confronted with machine-learning and complex network approaches.
Results: The case:control distribution by each cardiovascular phenotype was: hypertension (50:100),
obesity (50:98), and diabetes (36:72). Of the 86 studied proteins, 4 were found to be independently associated with hypertension: GDF-15, LEP, SORT-1 and FABP-2; 3 with obesity: CEACAM-8, LEP and PRELP; and 4 with diabetes: GDF-15, REN, CXCL-1 and SCF. GDF-15 (hypertension+diabetes) and LEP (hypertension+obesity) are shared by two different phenotypes. A machine learning approach confirmed GDF-15, LEP and SORT-1 as discriminant biomarkers for the hypertension group, and LEP plus PRELP for the obesity group. Complex network analyses provided insight on the mechanisms underlying these disease phenotypes where fibrosis may play a central role.
Conclusion: Patients with “mutually exclusive” phenotypes display distinct bioprofiles that might
underpin different biological pathways, potentially leading to fibrosis.
Key-words: cardiovascular diseases; phenotypes; proteomics; LASSO; decision tree; complex networks.
Introduction
Cardiovascular diseases (CVDs) are the leading cause of death and health loss worldwide1. Hence, cardiovascular prevention (primary and secondary) is essential to reduce CVDs burden2. Hypertension, obesity and diabetes are major and potentially modifiable “risk factors” for CVD3, 4, that, if left untreated, may lead to major CV events and reduce life expectancy.
In order to achieve diagnostic and therapeutic advances, it is important to identify new pathophysiological mechanisms that may be associated with specific disease phenotypes. Therefore, phenotyping cardiovascular (CV) “risk factors” and diseases may help in the identification of specific biomarkers relevant for understanding the underlying mechanisms, and may allow the study of pathway-specific therapies including personalized approaches to treatment5.
To this aim, the FIBRO-TARGETS (Targeting Cardiac Fibrosis for Heart Failure Treatment: http://www.FIBRO-TARGETS.eu/) consortium has merged data from 12 patient cohorts in a common database consisting of >12,000 patients with a large spectrum of CV clinical phenotypes6. Patients from the merged databased were organized in mutually exclusive “cases” of patients with clinically-phenotyped conditions: hypertension, obesity, and diabetes with matched “controls” to identify protein bioprofiles specific to each of these phenotypes.
Methods
Study population
FIBRO-TARGETS is a multinational academic–industrial consortium funded by the European Commission Seventh Framework Programme (FP7). The consortium was built to create synergies and collaborative efforts between clinical investigators, basic scientists, and small- and medium-sized enterprises, combining complementary approaches, disciplines, technologies, resources, and expertise. It aims at bridging pre-clinical findings related to myocardial interstitial fibrosis to the clinical setting with the objective of changing and improving outcomes through the advent of tailored anti-fibrotic therapies. For the present study 406 subjects were selected from 2 cohorts (HVC and STANISLAS7), that included both “healthy” and “cardiovascular risk” participants to serve as either cases or controls. Patients from the merged database were organized into three mutually-exclusive clinical phenotypes (“cases”): 1) hypertensive (defined by a systolic blood pressure ≥140 mmHg or diastolic blood pressure ≥90 mmHg or ongoing treatment for hypertension)8
; 2) obese (body mass index [BMI] ≥30 kg/m2)9; and 3) diabetic (defined by a random blood glucose ≥200 mg/dL or a fasting blood glucose ≥126 mg/dL or a glycated hemoglobin ≥6.5% or treatment for diabetes)10
. Cases for a given clinical phenotype could not have other condition but the one of interest (i.e., “mutually-exclusive”). Cases were age-sex matched in a 1:2 proportion with “healthy controls” free of any of these phenotypes. For a given phenotype, a maximum of 50 triplets (1:2) were selected. With regards to diabetes we were able to identify only 36 patients without any other condition.
Plasma samples were analysed for protein biomarkers using the Olink Proseek® Multiplex CVD-II panel. The use of the proximity extension assay (PEA) technology11 (allowing the measurement of 92 proteins within a very limited volume of plasma - 5µL), where 92 oligonucleotide-labelled antibody probe pairs per panel are allowed to bind to their respective targets in the sample in 96-well plate format. When binding to their correct targets, they give rise to new DNA amplicons with each ID-barcoding their respective antigens. The amplicons are subsequently quantified using a Fluidigm BioMark™ HD real-time PCR platform. The platform provides log2-normalized protein expression (NPX) data. A detailed description of the Olink® technology is depicted in the Supplemental Addenda 1. The abbreviations, full names and respective Olink® multiplex panels of the studied proteins are described in the Supplemental Table 1.
Six additional biomarkers (for a total of 98) were also measured by “standard methods” and independently of the Olink® technology. These were: galectin-3 (Gal-3), growth differentiation factor-15 (GDF-factor-15), matrix metalloproteinase-1 (MMP-1), stromal cell derived factor-1 alfa (SDF-1α) expression level were assessed using cyplex protein simple ELLA technology; N-terminal pro-peptide of type III collagen (PIIINP) was measured in plasma with the PIIINP-EL-US kit and neutrophil gelatinase-associated lipocalin (NGAL) in serum was measured by sandwich ELISA assay. The assays were performed in a “blind” fashion to case/control status with cases and controls randomly distributed across plates. The proteomic results were then merged with the baseline data, which included the case-control status, matching variables and clinical risk factors.
Statistical and machine-learning methods
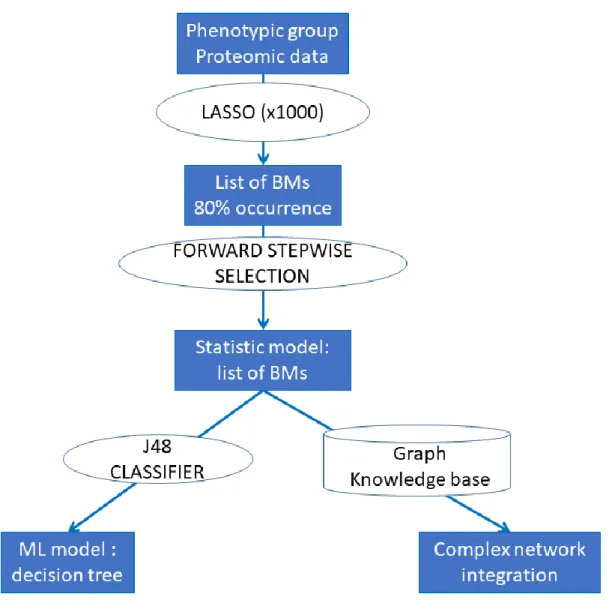
Continuous variables are described as mean ± standard deviation or median (inter-quartile range), as appropriate. Categorical variables were described as frequencies and percentages. In order to compare the phenotypic groups and due to matched nature of the data, p-values were computed using paired t-test or Wilcoxon signed rank t-test for continuous variables and with Cochran-Mantel-Haenszel t-test for categorical ones. Olink® biomarkers with more than 25% non-detectable values (n=12; see also the Supplemental Table 1 for information on these specific biomarkers) were excluded, hence the total number of studied biomarkers was =86. The association of the candidate biomarkers and each outcome was examined as one continuous or three binary variables (>1st tertile [T1], >median, >2nd tertile [T2]) in univariable models. Among these four representations, the one presenting the strongest association with the phenotype of interest was kept. In the next step, a LASSO (Least Absolute Shrinkage and Selection Operator) approach was performed with each clinical phenotype as outcome and the 86 biomarkers of interest as explanatory variables (the LASSO method penalizes the sum of the absolute values of the regression coefficients leading to some coefficients shrinking to zero and thus simultaneously performs variable selection). In order to find the best subset of biomarkers associated with each phenotype, we used the following principle consisting of two stages of selection: 1) for each outcome, the LASSO was computed 1000x and we kept a subset of biomarkers that were retained in >80% of the models; 2) then we performed a forward selection procedure on this subset of
biomarkers to only keep those that were significantly associated with the studied phenotype (forward elimination was selected instead of backward to avoid excessive “overfitting” during the stepwise procedure). The odds ratios (ORs) were then presented with their respective 95% confidence intervals (95%CI). Since proteins were measured using NPX (Normalized Protein eXpression) values (the details about NPX values can be found here: https://www.olink.com/question/what-is-npx/), the OR for each protein estimates the increase in the odds of HF associated with a doubling in the protein concentration. The statistical analyses were performed using the R® software, clogitL1 R package (http://www.R-project.org). A p-value <0.05 was considered as statistically significant after correcting for false discoveries with the 1000x repetition procedure.
In the machine-learning (ML) analyses, the case:control proportion (1:2) in each phenotypic group led us to reweight the instances in the datasets using the “distribution class balancer” method, so that each class in each dataset had the same total weight. Then we used a simple and robust supervised classification method known as decision tree (J48 algorithm) because it can provide models explaining the classification process in the form of “explicit decision trees” that identify “cases” by the levels of the expressed biomarkers in an unsupervised fashion i.e. the program choses the best level of proteins expression to define the cutoff. To improve and quantify classification performance of the models, the J48 algorithm was combined with AdaBoostM1, an iterative metaclassifier. Classification models were evaluated by “leave one out cross validation” (i.e., learn with the whole dataset minus one example, test with this example and repeat to test each example) repeated 1000x. For each phenotypic group, the biomarkers selected by the biostatistical approach were considered as input features. Results are given as the Adaboost decision tree with the highest weight and average values of the area under the ROC curve (AUC) over the 1000 cross-validations. The Weka®data mining software was used for the ML analyses. The statistical procedures are resumed in the Figure 1.
Complex network analyses
The FHF-GKB (Fight Heart Failure - Graph Knowledge Box) resource, representing most available public knowledge about human protein-disease, protein-protein and protein-pathway relationships is a customized upgraded version of the EdgeBox provided by the EdgeLeap company (available from: https://www.edgeleap.com/edgebox/). FHF-GKB data is extracted from public data sources resulting in 20,386 protein nodes imported from Uniprot12, including all biomarkers involved in this study, 28,176 disease nodes from Disease Ontology13 and DisGenet14 and 2,222 pathway nodes from Reactome (v65)15. Protein - protein relationships were retrieved from STRING (v10.5)16 or Reactome or WikiPathways17 or Mentha18 or BioGrid19, protein – disease associations from DisGenet (2018-08-24) and protein – pathway relationships from Reactome. The FHF-GKB complex network was queried in order to explore pathways and proteins that connect BM to fibrosis. Three distinct nodes from FHF-GKB were merged to represent fibrosis: fibrosis per se (Unified Medical Language System - UMLS code C0016059), myocardial fibrosis (C0151654) and endomyocardial fibrosis (C0553980). Relations between proteins and disease nodes are retrieved from FHF-GKB under stringent score conditions that
imply that at least one animal model or a manually curated report supports the relation in DisGenet. Queries were expressed according to query patterns defining a path structure between two nodes namely BM-fibrosis, BM-protein-fibrosis and BM-pathway-protein-fibrosis, where the BM nodes were taken from the list of BMs identified for each phenotypic group by the statistical approach. The resulting graphs were merged in a figure illustrating all possible paths not longer than three edges, connecting BMs and fibrosis through pathways and proteins.
Results
Study population
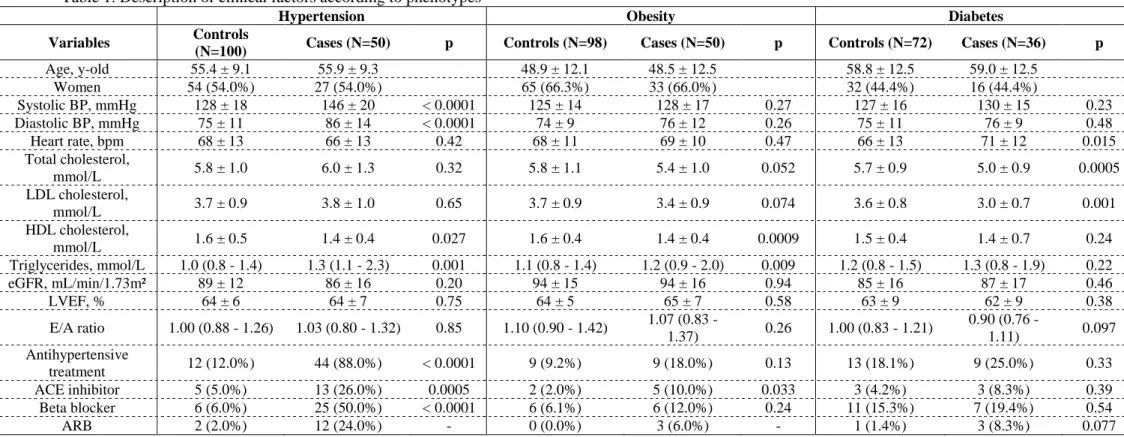
The case:control distribution by each cardiovascular phenotype was as follows: hypertension (50:100), obesity (50:98), and diabetes (36:72). Table 1. These phenotypes were “mutually-exclusive” i.e. cases could only have one only condition and controls could not have any of these conditions. The baseline characteristics of the studied population for each studied cardiovascular phenotype is depicted in Table 1.
Biomarkers associated with the studied phenotypes: LASSO approach
In the present section we describe only the biomarkers associated with each phenotype that were retained in >80% of the LASSO runs followed by the forward stepwise multivariable logistic model. The results for all the biomarkers and the respective selection process are presented in the Supplemental Material Tables 2 to 4.
Biomarkers associated with hypertension
Of the 86 proteins studied, 4 were found to be independently associated with hypertension in the statistical approach: GDF-15 and leptin (LEP) were positively associated (i.e., with an odds ratio >1), whereas sortilin-1 (SORT-1) and fatty acid-binding protein 2 (FABP-2) where negatively associated (i.e., with an odds ratio <1). Table 2.
Biomarkers associated with obesity
Three biomarkers were found to be independently associated with obesity in the statistical approach: carcinoembryonic antigen-related cell adhesion molecule 8 (CEACAM-8) and LEP were positively associated, whereas proline/arginine-rich end leucine-rich repeat protein (PRELP) was negatively associated. Table 2.
Biomarkers associated with diabetes
Four biomarkers were found to be independently associated with diabetes in the statistical approach: GDF-15 and renin (REN) were positively associated, whereas chemokine (C-X-C motif) ligand 1 (CXCL-1) and stem-cell factor (SCF) were negatively associated. Table 2.
Interpretation of the biostatistical model: machine-learning approach
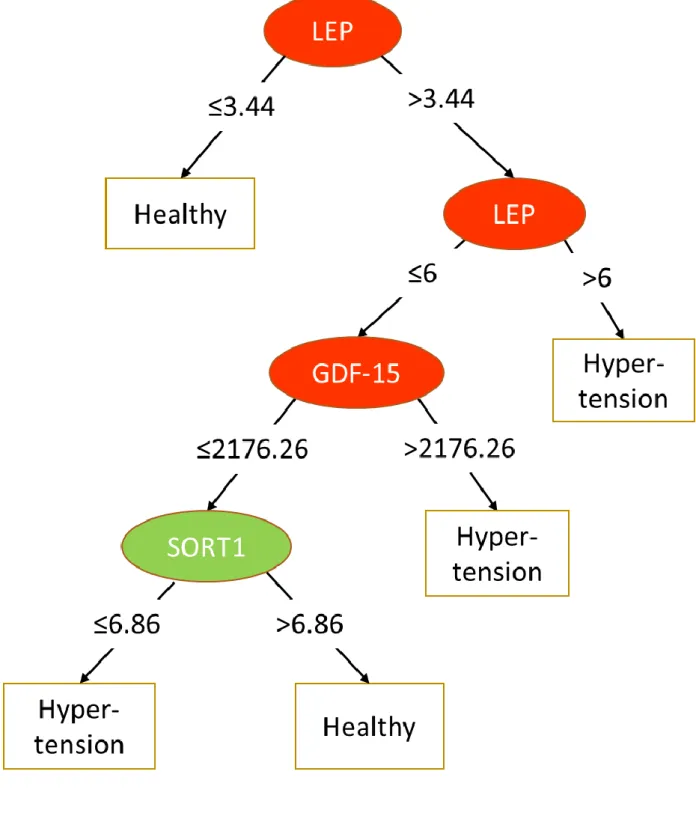
The biomarkers retained in the best statistical models were used as selected features in a ML approach aimed at producing descriptive and predictive models of each phenotypic group. The three decision
trees obtained of the hypertension, obesity and diabetes groups are represented in Figure 2A to C. The decision trees are organized according to sequential testing of discriminant biomarkers.
For the hypertension group, three such biomarkers are retained: LEP, GDF-15 and SORT-1 but not FABP-2, however, the AUC of the predictive model is rather low (0.61). For obesity only one discriminant biomarker is retained (LEP) for an AUC of 0.77. For diabetes, the four biomarkers of the statistical model were used: CXCL-1, REN, GDF-15 and SCF for an AUC of 0.70.
Synthesis of the findings
The above-described findings are summarized in the Table 3 and in the Supplemental Tables 5 & 6. Interestingly, LEP is shared between the hypertension and obesity, whereas GDF-15 is shared between hypertension and diabetes phenotypes.
Decision trees obtained using machine learning provide insight into the way biomarkers can be used to discriminate between healthy and at-risk “pro-fibrotic” patients.
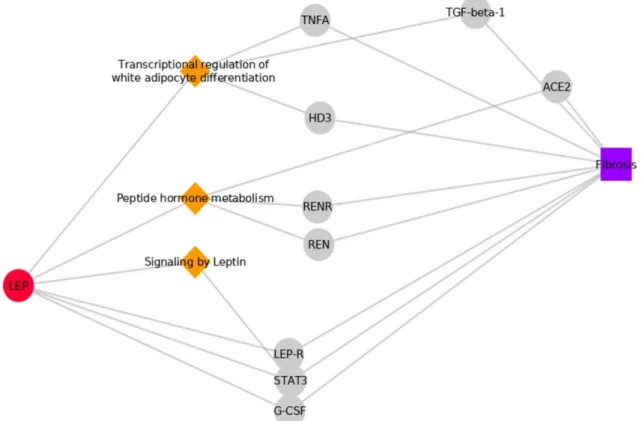
Induced network analyses
The three networks underpinning the identified proteins for each phenotypic group are presented in Figures 3A to C. Relations between each biomarker and fibrosis (including myocardial and endomyocardial fibrosis) may point to potential common disease mechanisms. In the hypertension group and under the conditions used for network retrieval, relevant paths are found only for the LEP biomarker. The same paths are therefore present in the obesity group but they co-exist with specific ones involving the PRELP and CEACAM-8 biomarkers such as diseases of glycosylation and neutrophil degranulation respectively. The neutrophil degranulation pathway is also present in the diabetes group but linked to the CXCL-1 biomarker. In this group other specific pathways appear involving the REN and SCF biomarkers such as metabolism of angiotensinogen and signalling by interleukins, respectively. A resume of the findings is displayed in Figure 4.
Discussion
In the present study we identified 9 biomarkers (from which 7 are exclusive, and 2 overlap) associated with the “mutually-exclusive” phenotypes: hypertension (GDF-15, LEP, SORT-1); obesity (LEP, PRELP); and diabetes (GDF-15, REN, CXCL-1, SCF). Two biomarkers overlapped in different phenotypes: GDF-15 [hypertension+diabetes] and LEP [hypertension+obesity]. To the best of our knowledge, this is the first study to assess proteomic bioprofiles in “mutually exclusive” cardiovascular phenotypes, highlighting the distinct bioprofiles that may underpin different biological pathways specific of each condition. However, the overlap observed between cardiovascular “at-risk” phenotypes (hypertension, obesity and diabetes), suggests that the transition to cardiovascular disease may share mechanistic pathways. The identification of these proteomic bioprofiles may help in the understanding of the different mechanisms that are associated with these cardiovascular diseases and potentially enable the development of CVD targeted diagnostic tools and treatments20, 21. The utilization of two independent statistical methods for the reproducibility of the results reinforced the
internal validity of our findings. While still requiring further comparison in larger samplings, those analytical approaches resulted in sound biological results externally comforted in animal models and humans (see discussion below).
Hypertension
Patients with hypertension (compared to the matched controls) had higher levels of GDF-15 and LEP and lower levels of SORT-1. GDF-15 is a stress responsive cytokine, highly expressed in cardiomyocytes, adipocytes, macrophages, endothelial cells, and vascular smooth muscle cells in normal and pathological conditions22. GDF-15 increases during tissue injury and inflammatory states such as left ventricular hypertrophy and endothelial dysfunction caused by hypertension and/or diabetes and has been shown to predicted incident CVD and adverse CV outcomes5, 23, 24. Leptin excess has been associated with hypertension, obesity, insulin-resistance/diabetes, subclinical inflammation, atherosclerosis, and incident CVDs25, 26. On the other hand, patients with hypertension expressed lower levels of SORT-1, that plays a role in the secretion of proinflammatory cytokines (such as IL-6 and TNFα) and is implicated in LDL-cholesterol metabolism. Moreover, SORT-1 likely plays an important role in the development of cardiovascular disease and atherosclerosis beyond LDL-cholesterol regulation27, 28. As SORT-1 attenuates inflammatory response, it is thus expected that patients with hypertension and/or myocardial infarction express lower levels of this protein. Lower levels of FABP-2 (a cytoplasmic lipid chaperon expressed in adipocytes and macrophages) were identified only using the biostatistical model in hypertensive patients. While additional bibliographic data regarding its association with hypertension are yet lacking, lower levels of FABP-2 have been associated with an increased risk of diabetes29.
Obesity
Obese patients expressed higher levels of LEP and lower levels of PRELP using both statistical approaches. The positive association with LEP is sound (as described in the “hypertension” subsection) and the PRELP directly inhibits complement pathways downregulating the inflammatory cascade. PRELP is a component of member of the small leucine-rich proteoglycans30 and is present in the extracellular matrix playing an essential role in tissue repair and scar formation31. The lower expression of PRELP in obese patients (vs. controls) is thus plausible from a pathophysiological viewpoint. CEACAM-8 levels were also increased in obese patients (with the “biostatistical” approach only). This marker has been implicated in cell adhesion, cellular invasiveness, angiogenesis, and inflammation32, which are key processes in the pathophysiology of obesity. However, data directly relating CEACAM-8 and obesity are lacking and further study is required.
Diabetes
Patients with diabetes expressed higher concentrations of GDF-15 and REN, and lower concentrations of CXCL-1 and SCF, compared to the matched controls. GDF-15 has been associated with diabetes and CVD, as above described (hypertension subsection). Excessive expression of REN has been associated with diabetes and coronary artery disease33, 34. Patients with diabetes expressed lower levels
of SCF. Supporting our findings, lower levels of SCF have also been associated with increased rate of coronary events and all-cause death35, 36. Contrary to our findings, CXCL-1 levels have been found to be elevated in patients with diabetes mellitus37, 38.
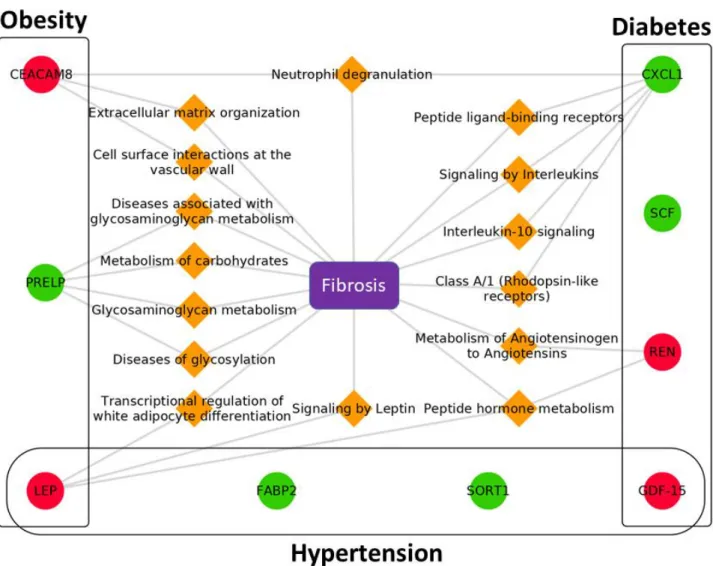
The link of the studied proteins to fibrosis
The machine learning techniques used in the current manuscript aim to help in revealing the underlying mechanistic pathways associated with the study biomarkers, by enriching our observations with varied data sources available via the FHF-GKB. The query patterns with “direct” link biomarker-fibrosis where inexistent i.e. no “intrinsic” profibrotic activity of the measured biomarkers has yet been reported in the literature. Enlarging the query to protein-fibrosis” and to “biomarker-pathway-protein-fibrosis” showed intermediary proteins that are involved in pathways that link the study biomarkers to fibrosis. Our findings are resumed in the figure 4, with the detected biomarkers shown in circles, the enriched pathways deduced by the “machine learning” procedure in orange diamond, structured into biological processes that may lead to the development of fibrosis.
Limitations
Several limitations should be highlighted in the present study. First, this is an observational case-control study, hence causality cannot be ascertained. The ML approach is performed on a small number of patients in each group and this can lead to somewhat overfitted descriptive and predictive models despite of extensive cross-validation. The bioinformatical approach, also does not allow causality assessment. Second, this study lacks external validation, hence these data cannot be extrapolated to other populations. Third, the proteomics assay does not provide standard concentration units, making comparisons with clinically applied cut-offs difficult. Finally, we did not use large unbiased screens but rather selected protein biomarkers based on mechanistic hypotheses. Therefore, we cannot exclude the role of other mechanisms not targeted with our proteomics screen.
Conclusion
Patients with “mutually exclusive” cardiovascular phenotypes have distinctive bioprofiles that might underpin different biological pathways, which may be associated with fibrosis via intermediate links, such as inflammation. Our results support the FIBROTARGETS consortium objectives aiming the development of treatments personalized for specific phenotypic groups of patients.
Conflict of interest
All authors are actively involved in the FIBROTARGETS consortium.
This work was funded through the European Commission Seventh Framework Programme (FIBRO-TARGETS project grant #602904 HEALTH-2013-602904) and the REBIRTH Excellence Cluster, Hannover Medical School.
Acknowledgements
JF, AP, JLM, PR, NG, MD D, EB and FZ are supported by the French National Research Agency Fighting Heart Failure (ANR-15-RHU-0004), by the French PIA project «Lorraine Université d’Excellence » GEENAGE (ANR-15-IDEX-04-LUE) programs, and the Contrat de Plan Etat Région Lorraine and FEDER IT2MP. The authors thank the CRB Lorrain biobank for handling biosamples. The research leading to these results has received funding from the European Union Commission’s Seventh Framework programme under grant agreement N° 602904 (FIBROTARGETS) and N° 261409 (MEDIA). SH acknowledge the support from the Netherlands Cardiovascular Research Initiative, an initiative with support of the Dutch Heart Foundation, CVON2016-Early HFPEF, 2015-10, and CVON She-PREDICTS, 2017-21. This research is co-financed as a PPP-allowance Research and Innovation by the Ministry of Economic Affairs within Top Sector Life sciences & Health in the Netherlands.
Bibliography
1. Roth, G. A.; Johnson, C.; Abajobir, A.; Abd-Allah, F.; Abera, S. F.; Abyu, G.; Ahmed, M.; Aksut, B.; Alam, T.; Alam, K.; Alla, F.; Alvis-Guzman, N.; Amrock, S.; Ansari, H.; Arnlov, J.; Asayesh, H.; Atey, T. M.; Avila-Burgos, L.; Awasthi, A.; Banerjee, A.; Barac, A.; Barnighausen, T.; Barregard, L.; Bedi, N.; Belay Ketema, E.; Bennett, D.; Berhe, G.; Bhutta, Z.; Bitew, S.; Carapetis, J.; Carrero, J. J.; Malta, D. C.; Castaneda-Orjuela, C. A.; Castillo-Rivas, J.; Catala-Lopez, F.; Choi, J. Y.; Christensen, H.; Cirillo, M.; Cooper, L., Jr.; Criqui, M.; Cundiff, D.; Damasceno, A.; Dandona, L.; Dandona, R.; Davletov, K.; Dharmaratne, S.; Dorairaj, P.; Dubey, M.; Ehrenkranz, R.; El Sayed Zaki, M.; Faraon, E. J. A.; Esteghamati, A.; Farid, T.; Farvid, M.; Feigin, V.; Ding, E. L.; Fowkes, G.; Gebrehiwot, T.; Gillum, R.; Gold, A.; Gona, P.; Gupta, R.; Habtewold, T. D.; Hafezi-Nejad, N.; Hailu, T.; Hailu, G. B.; Hankey, G.; Hassen, H. Y.; Abate, K. H.; Havmoeller, R.; Hay, S. I.; Horino, M.; Hotez, P. J.; Jacobsen, K.; James, S.; Javanbakht, M.; Jeemon, P.; John, D.; Jonas, J.; Kalkonde, Y.; Karimkhani, C.; Kasaeian, A.; Khader, Y.; Khan, A.; Khang, Y. H.; Khera, S.; Khoja, A. T.;
Khubchandani, J.; Kim, D.; Kolte, D.; Kosen, S.; Krohn, K. J.; Kumar, G. A.; Kwan, G. F.; Lal, D. K.; Larsson, A.; Linn, S.; Lopez, A.; Lotufo, P. A.; El Razek, H. M. A.; Malekzadeh, R.; Mazidi, M.; Meier, T.; Meles, K. G.; Mensah, G.; Meretoja, A.; Mezgebe, H.; Miller, T.; Mirrakhimov, E.; Mohammed, S.; Moran, A. E.; Musa, K. I.; Narula, J.; Neal, B.; Ngalesoni, F.; Nguyen, G.;
Obermeyer, C. M.; Owolabi, M.; Patton, G.; Pedro, J.; Qato, D.; Qorbani, M.; Rahimi, K.; Rai, R. K.; Rawaf, S.; Ribeiro, A.; Safiri, S.; Salomon, J. A.; Santos, I.; Santric Milicevic, M.; Sartorius, B.; Schutte, A.; Sepanlou, S.; Shaikh, M. A.; Shin, M. J.; Shishehbor, M.; Shore, H.; Silva, D. A. S.; Sobngwi, E.; Stranges, S.; Swaminathan, S.; Tabares-Seisdedos, R.; Tadele Atnafu, N.; Tesfay, F.; Thakur, J. S.; Thrift, A.; Topor-Madry, R.; Truelsen, T.; Tyrovolas, S.; Ukwaja, K. N.; Uthman, O.; Vasankari, T.; Vlassov, V.; Vollset, S. E.; Wakayo, T.; Watkins, D.; Weintraub, R.; Werdecker, A.; Westerman, R.; Wiysonge, C. S.; Wolfe, C.; Workicho, A.; Xu, G.; Yano, Y.; Yip, P.; Yonemoto, N.; Younis, M.; Yu, C.; Vos, T.; Naghavi, M.; Murray, C., Global, Regional, and National Burden of Cardiovascular Diseases for 10 Causes, 1990 to 2015. J Am Coll Cardiol 2017, 70 (1), 1-25.
2. Bertram, M. Y.; Sweeny, K.; Lauer, J. A.; Chisholm, D.; Sheehan, P.; Rasmussen, B.; Upreti, S. R.; Dixit, L. P.; George, K.; Deane, S., Investing in non-communicable diseases: an estimation of the return on investment for prevention and treatment services. Lancet 2018, 391 (10134), 2071-2078.
3. Mozaffarian, D.; Benjamin, E. J.; Go, A. S.; Arnett, D. K.; Blaha, M. J.; Cushman, M.; de Ferranti, S.; Despres, J. P.; Fullerton, H. J.; Howard, V. J.; Huffman, M. D.; Judd, S. E.; Kissela, B. M.; Lackland, D. T.; Lichtman, J. H.; Lisabeth, L. D.; Liu, S.; Mackey, R. H.; Matchar, D. B.; McGuire, D. K.; Mohler, E. R., 3rd; Moy, C. S.; Muntner, P.; Mussolino, M. E.; Nasir, K.; Neumar, R. W.; Nichol, G.; Palaniappan, L.; Pandey, D. K.; Reeves, M. J.; Rodriguez, C. J.; Sorlie, P. D.; Stein, J.; Towfighi, A.; Turan, T. N.; Virani, S. S.; Willey, J. Z.; Woo, D.; Yeh, R. W.; Turner, M. B., Heart disease and stroke statistics--2015 update: a report from the American Heart Association. Circulation 2015, 131 (4), e29-322.
4. Townsend, N.; Wilson, L.; Bhatnagar, P.; Wickramasinghe, K.; Rayner, M.; Nichols, M., Cardiovascular disease in Europe: epidemiological update 2016. Eur Heart J 2016, 37 (42), 3232-3245.
5. Ho, J. E.; Lyass, A.; Courchesne, P.; Chen, G.; Liu, C.; Yin, X.; Hwang, S. J.; Massaro, J. M.; Larson, M. G.; Levy, D., Protein Biomarkers of Cardiovascular Disease and Mortality in the
Community. J Am Heart Assoc 2018, 7 (14).
6. Ferreira, J. P.; Machu, J. L.; Girerd, N.; Jaisser, F.; Thum, T.; Butler, J.; Gonzalez, A.; Diez, J.; Heymans, S.; McDonald, K.; Gyongyosi, M.; Firat, H.; Rossignol, P.; Pizard, A.; Zannad, F., Rationale of the FIBROTARGETS study designed to identify novel biomarkers of myocardial fibrosis.
ESC Heart Fail 2017.
7. Ferreira, J. P.; Girerd, N.; Bozec, E.; Merckle, L.; Pizard, A.; Bouali, S.; Eby, E.; Leroy, C.; Machu, J. L.; Boivin, J. M.; Lamiral, Z.; Rossignol, P.; Zannad, F., Cohort Profile: Rationale and design
of the fourth visit of the STANISLAS cohort: a familial longitudinal population-based cohort from the Nancy region of France. Int J Epidemiol 2018, 47 (2), 395-395j.
8. Williams, B.; Mancia, G.; Spiering, W.; Agabiti Rosei, E.; Azizi, M.; Burnier, M.; Clement, D. L.; Coca, A.; de Simone, G.; Dominiczak, A.; Kahan, T.; Mahfoud, F.; Redon, J.; Ruilope, L.;
Zanchetti, A.; Kerins, M.; Kjeldsen, S. E.; Kreutz, R.; Laurent, S.; Lip, G. Y. H.; McManus, R.; Narkiewicz, K.; Ruschitzka, F.; Schmieder, R. E.; Shlyakhto, E.; Tsioufis, C.; Aboyans, V.; Desormais, I., 2018 ESC/ESH Guidelines for the management of arterial hypertension: The Task Force for the management of arterial hypertension of the European Society of Cardiology and the European Society of Hypertension: The Task Force for the management of arterial hypertension of the European Society of Cardiology and the European Society of Hypertension. J Hypertens 2018, 36 (10), 1953-2041.
9. de Onis, M.; Habicht, J. P., Anthropometric reference data for international use:
recommendations from a World Health Organization Expert Committee. Am J Clin Nutr 1996, 64 (4), 650-8.
10. Greenland, P.; Alpert, J. S.; Beller, G. A.; Benjamin, E. J.; Budoff, M. J.; Fayad, Z. A.; Foster, E.; Hlatky, M. A.; Hodgson, J. M.; Kushner, F. G.; Lauer, M. S.; Shaw, L. J.; Smith, S. C., Jr.; Taylor, A. J.; Weintraub, W. S.; Wenger, N. K.; Jacobs, A. K.; Anderson, J. L.; Albert, N.; Buller, C. E.; Creager, M. A.; Ettinger, S. M.; Guyton, R. A.; Halperin, J. L.; Hochman, J. S.; Nishimura, R.; Ohman, E. M.; Page, R. L.; Stevenson, W. G.; Tarkington, L. G.; Yancy, C. W., 2010 ACCF/AHA guideline for assessment of cardiovascular risk in asymptomatic adults: a report of the American College of Cardiology Foundation/American Heart Association Task Force on Practice Guidelines. J
Am Coll Cardiol 2010, 56 (25), e50-103.
11. Lundberg, M.; Eriksson, A.; Tran, B.; Assarsson, E.; Fredriksson, S., Homogeneous antibody-based proximity extension assays provide sensitive and specific detection of low-abundant proteins in human blood. Nucleic Acids Res 2011, 39 (15), e102.
12. UniProt: the universal protein knowledgebase. Nucleic Acids Res 2017, 45 (D1), D158-d169. 13. Kibbe, W. A.; Arze, C.; Felix, V.; Mitraka, E.; Bolton, E.; Fu, G.; Mungall, C. J.; Binder, J. X.; Malone, J.; Vasant, D.; Parkinson, H.; Schriml, L. M., Disease Ontology 2015 update: an expanded and updated database of human diseases for linking biomedical knowledge through disease data.
Nucleic Acids Res 2015, 43 (Database issue), D1071-8.
14. Pinero, J.; Bravo, A.; Queralt-Rosinach, N.; Gutierrez-Sacristan, A.; Deu-Pons, J.; Centeno, E.; Garcia-Garcia, J.; Sanz, F.; Furlong, L. I., DisGeNET: a comprehensive platform integrating
information on human disease-associated genes and variants. Nucleic Acids Res 2017, 45 (D1), D833-d839.
15. Fabregat, A.; Jupe, S.; Matthews, L.; Sidiropoulos, K.; Gillespie, M.; Garapati, P.; Haw, R.; Jassal, B.; Korninger, F.; May, B.; Milacic, M.; Roca, C. D.; Rothfels, K.; Sevilla, C.; Shamovsky, V.; Shorser, S.; Varusai, T.; Viteri, G.; Weiser, J.; Wu, G.; Stein, L.; Hermjakob, H.; D'Eustachio, P., The Reactome Pathway Knowledgebase. Nucleic Acids Res 2018, 46 (D1), D649-d655.
16. Szklarczyk, D.; Franceschini, A.; Wyder, S.; Forslund, K.; Heller, D.; Huerta-Cepas, J.; Simonovic, M.; Roth, A.; Santos, A.; Tsafou, K. P.; Kuhn, M.; Bork, P.; Jensen, L. J.; von Mering, C., STRING v10: protein-protein interaction networks, integrated over the tree of life. Nucleic Acids Res 2015, 43 (Database issue), D447-52.
17. Slenter, D. N.; Kutmon, M.; Hanspers, K.; Riutta, A.; Windsor, J.; Nunes, N.; Melius, J.; Cirillo, E.; Coort, S. L.; Digles, D.; Ehrhart, F.; Giesbertz, P.; Kalafati, M.; Martens, M.; Miller, R.; Nishida, K.; Rieswijk, L.; Waagmeester, A.; Eijssen, L. M. T.; Evelo, C. T.; Pico, A. R.; Willighagen, E. L., WikiPathways: a multifaceted pathway database bridging metabolomics to other omics research.
Nucleic Acids Res 2018, 46 (D1), D661-d667.
18. Calderone, A.; Castagnoli, L.; Cesareni, G., mentha: a resource for browsing integrated protein-interaction networks. In Nat Methods, United States, 2013; Vol. 10, pp 690-1.
19. Chatr-Aryamontri, A.; Oughtred, R.; Boucher, L.; Rust, J.; Chang, C.; Kolas, N. K.;
O'Donnell, L.; Oster, S.; Theesfeld, C.; Sellam, A.; Stark, C.; Breitkreutz, B. J.; Dolinski, K.; Tyers, M., The BioGRID interaction database: 2017 update. Nucleic Acids Res 2017, 45 (D1), D369-d379.
20. Eggebrecht, L.; Prochaska, J. H.; Trobs, S. O.; Schwuchow-Thonke, S.; Gobel, S.;
Diestelmeier, S.; Schulz, A.; Arnold, N.; Panova-Noeva, M.; Koeck, T.; Rapp, S.; Gori, T.; Lackner, K. J.; Ten Cate, H.; Munzel, T.; Wild, P. S., Direct oral anticoagulants and vitamin K antagonists are linked to differential profiles of cardiac function and lipid metabolism. Clin Res Cardiol 2019.
21. Lorenzi, M.; Ambegaonkar, B.; Baxter, C. A.; Jansen, J.; Zoratti, M. J.; Davies, G., Ezetimibe in high-risk, previously treated statin patients: a systematic review and network meta-analysis of lipid efficacy. Clin Res Cardiol 2018.
22. Adela, R.; Banerjee, S. K., GDF-15 as a Target and Biomarker for Diabetes and Cardiovascular Diseases: A Translational Prospective. J Diabetes Res 2015, 2015, 490842.
23. Wang, T. J.; Wollert, K. C.; Larson, M. G.; Coglianese, E.; McCabe, E. L.; Cheng, S.; Ho, J. E.; Fradley, M. G.; Ghorbani, A.; Xanthakis, V.; Kempf, T.; Benjamin, E. J.; Levy, D.; Vasan, R. S.; Januzzi, J. L., Prognostic utility of novel biomarkers of cardiovascular stress: the Framingham Heart Study. Circulation 2012, 126 (13), 1596-604.
24. Waits, G. S.; O'Neal, W. T.; Sandesara, P. B.; Li, Y.; Shah, A. J.; Soliman, E. Z., Association between low diastolic blood pressure and subclinical myocardial injury. Clin Res Cardiol 2018, 107 (4), 312-318.
25. Lopez-Jaramillo, P.; Gomez-Arbelaez, D.; Lopez-Lopez, J.; Lopez-Lopez, C.; Martinez-Ortega, J.; Gomez-Rodriguez, A.; Triana-Cubillos, S., The role of leptin/adiponectin ratio in metabolic syndrome and diabetes. Horm Mol Biol Clin Investig 2014, 18 (1), 37-45.
26. Van de Voorde, J.; Pauwels, B.; Boydens, C.; Decaluwe, K., Adipocytokines in relation to cardiovascular disease. Metabolism 2013, 62 (11), 1513-21.
27. Kjolby, M.; Nielsen, M. S.; Petersen, C. M., Sortilin, encoded by the cardiovascular risk gene SORT1, and its suggested functions in cardiovascular disease. Curr Atheroscler Rep 2015, 17 (4), 496. 28. Musunuru, K.; Strong, A.; Frank-Kamenetsky, M.; Lee, N. E.; Ahfeldt, T.; Sachs, K. V.; Li, X.; Li, H.; Kuperwasser, N.; Ruda, V. M.; Pirruccello, J. P.; Muchmore, B.; Prokunina-Olsson, L.; Hall, J. L.; Schadt, E. E.; Morales, C. R.; Lund-Katz, S.; Phillips, M. C.; Wong, J.; Cantley, W.; Racie, T.; Ejebe, K. G.; Orho-Melander, M.; Melander, O.; Koteliansky, V.; Fitzgerald, K.; Krauss, R. M.; Cowan, C. A.; Kathiresan, S.; Rader, D. J., From noncoding variant to phenotype via SORT1 at the 1p13 cholesterol locus. Nature 2010, 466 (7307), 714-9.
29. Liu, P.; Yu, D.; Jin, X.; Li, C.; Zhu, F.; Zheng, Z.; Lv, C.; He, X., The association between the FABP2 Ala54Thr variant and the risk of type 2 diabetes mellitus: a meta-analysis based on 11 case-control studies. Int J Clin Exp Med 2015, 8 (4), 5422-9.
30. Naba, A.; Clauser, K. R.; Hoersch, S.; Liu, H.; Carr, S. A.; Hynes, R. O., The matrisome: in silico definition and in vivo characterization by proteomics of normal and tumor extracellular matrices. Mol Cell Proteomics 2012, 11 (4), M111.014647.
31. Hultgardh-Nilsson, A.; Boren, J.; Chakravarti, S., The small leucine-rich repeat proteoglycans in tissue repair and atherosclerosis. J Intern Med 2015, 278 (5), 447-61.
32. Hasselbalch, H. C.; Skov, V.; Larsen, T. S.; Thomassen, M.; Riley, C. H.; Jensen, M. K.; Bjerrum, O. W.; Kruse, T. A., High expression of carcinoembryonic antigen-related cell adhesion molecule (CEACAM) 6 and 8 in primary myelofibrosis. Leuk Res 2011, 35 (10), 1330-4.
33. Konoshita, T.; Kato, N.; Fuchs, S.; Mizuno, S.; Aoyama, C.; Motomura, M.; Makino, Y.; Wakahara, S.; Inoki, I.; Miyamori, I.; Pinet, F., Genetic variant of the Renin-Angiotensin system and diabetes influences blood pressure response to Angiotensin receptor blockers. Diabetes Care 2009,
32 (8), 1485-90.
34. Fragoso, J. M.; Alvarez-Leon, E.; Delgadillo-Rodriguez, H.; Arellano-Gonzalez, M.; Lopez-Pacheco, F. C.; Cruz-Robles, D.; Pena-Duque, M. A.; Perez-Mendez, O.; Martinez-Rios, M. A.; Vargas-Alarcon, G., The C4280A (rs5705) gene polymorphism of the renin (REN) gene is associated
with risk of developing coronary artery disease, but not with restenosis after coronary stenting. Exp
Mol Pathol 2015, 99 (1), 128-32.
35. Wigren, M.; Rattik, S.; Hultman, K.; Bjorkbacka, H.; Nordin-Fredrikson, G.; Bengtsson, E.; Hedblad, B.; Siegbahn, A.; Goncalves, I.; Nilsson, J., Decreased levels of stem cell factor in subjects with incident coronary events. J Intern Med 2016, 279 (2), 180-91.
36. Bjorkbacka, H.; Yao Mattisson, I.; Wigren, M.; Melander, O.; Fredrikson, G. N.; Bengtsson, E.; Goncalves, I.; Almgren, P.; Lagerstedt, J. O.; Orho-Melander, M.; Engstrom, G.; Nilsson, J., Plasma stem cell factor levels are associated with risk of cardiovascular disease and death. J Intern
Med 2017, 282 (6), 508-521.
37. Omatsu, T.; Cepinskas, G.; Clarson, C.; Patterson, E. K.; Alharfi, I. M.; Summers, K.; Couraud, P. O.; Romero, I. A.; Weksler, B.; Fraser, D. D., CXCL1/CXCL8 (GROalpha/IL-8) in human diabetic ketoacidosis plasma facilitates leukocyte recruitment to cerebrovascular endothelium in vitro. Am J Physiol Endocrinol Metab 2014, 306 (9), E1077-84.
38. Takahashi, K.; Ohara, M.; Sasai, T.; Homma, H.; Nagasawa, K.; Takahashi, T.; Yamashina, M.; Ishii, M.; Fujiwara, F.; Kajiwara, T.; Taneichi, H.; Takebe, N.; Satoh, J., Serum CXCL1
concentrations are elevated in type 1 diabetes mellitus, possibly reflecting activity of anti-islet autoimmune activity. Diabetes Metab Res Rev 2011, 27 (8), 830-3.
Figure 2. Decision trees for each disease phenotype
A. Hypertension (AUC =0.61) (LEP and SORT-1 are expressed in NPX values, and GDF-15 in pg/mL)
C. Diabetes (AUC =0.70) (CXCL1, REN, and SCF are expressed in NPX values, and GDF-15 in pg/mL)
Legend: red, biomarkers positively (odds ratio >1) associated with the outcome; green, biomarkers negatively (odds ratio <1) associated with the outcome.
Figure 3. Graphs relating biomarkers to the fibrosis disease node. A. Hypertension
Query patterns: BM- Fibrosis (no result); BM-Protein-Fibrosis; BM-Pathway-Protein-Fibrosis. No pathway found for GDF-15, SORT-1, and FABP2
B. Obesity
C. Diabetes
Query patterns: BM- Fibrosis (no result); BM-Protein-Fibrosis; BM-Pathway-Protein-Fibrosis. No pathway found for GDF-15.
Legend: “circles” are proteins (red/green for biomarkers and grey for intermediate proteins), “orange diamond” are pathways, and “violet squares” are diseases.
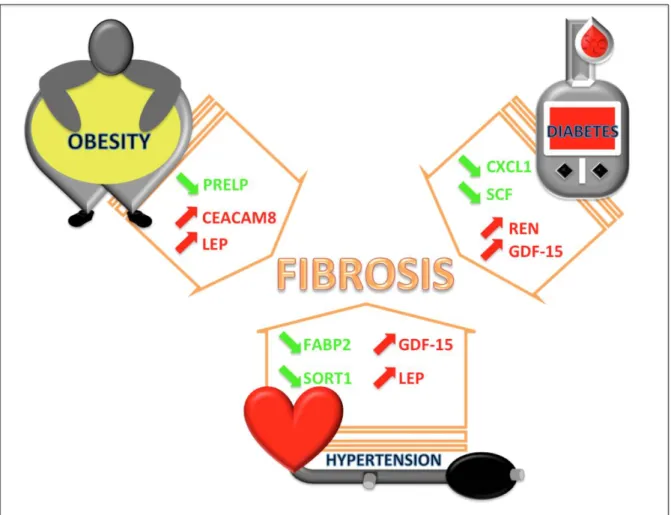
Figure 4. Biomarkers and their associated pathways leading to Fibrosis.
Legend: “circles” are proteins (red, increased expression /green, decreased expression for biomarkers), “orange diamond” are pathways, and “violet squares” are diseases.
Graphic Abstract
Plasma protein biomarkers and their association with mutually exclusive
cardiovascular phenotypes: the FIBRO-TARGETS case-control analyses
Patients with “mutually exclusive” phenotypes (blue: obesity, hypertension and diabetes) display distinct protein bioprofiles (green decreased expression; red increased expression) that might underpin different biological pathways (orange arrow), potentially leading to fibrosis.
Table 1. Description of clinical factors according to phenotypes
Hypertension Obesity Diabetes
Variables Controls
(N=100) Cases (N=50) p Controls (N=98) Cases (N=50) p Controls (N=72) Cases (N=36) p
Age, y-old 55.4 ± 9.1 55.9 ± 9.3 48.9 ± 12.1 48.5 ± 12.5 58.8 ± 12.5 59.0 ± 12.5 Women 54 (54.0%) 27 (54.0%) 65 (66.3%) 33 (66.0%) 32 (44.4%) 16 (44.4%) Systolic BP, mmHg 128 ± 18 146 ± 20 < 0.0001 125 ± 14 128 ± 17 0.27 127 ± 16 130 ± 15 0.23 Diastolic BP, mmHg 75 ± 11 86 ± 14 < 0.0001 74 ± 9 76 ± 12 0.26 75 ± 11 76 ± 9 0.48 Heart rate, bpm 68 ± 13 66 ± 13 0.42 68 ± 11 69 ± 10 0.47 66 ± 13 71 ± 12 0.015 Total cholesterol, mmol/L 5.8 ± 1.0 6.0 ± 1.3 0.32 5.8 ± 1.1 5.4 ± 1.0 0.052 5.7 ± 0.9 5.0 ± 0.9 0.0005 LDL cholesterol, mmol/L 3.7 ± 0.9 3.8 ± 1.0 0.65 3.7 ± 0.9 3.4 ± 0.9 0.074 3.6 ± 0.8 3.0 ± 0.7 0.001 HDL cholesterol, mmol/L 1.6 ± 0.5 1.4 ± 0.4 0.027 1.6 ± 0.4 1.4 ± 0.4 0.0009 1.5 ± 0.4 1.4 ± 0.7 0.24 Triglycerides, mmol/L 1.0 (0.8 - 1.4) 1.3 (1.1 - 2.3) 0.001 1.1 (0.8 - 1.4) 1.2 (0.9 - 2.0) 0.009 1.2 (0.8 - 1.5) 1.3 (0.8 - 1.9) 0.22 eGFR, mL/min/1.73m² 89 ± 12 86 ± 16 0.20 94 ± 15 94 ± 16 0.94 85 ± 16 87 ± 17 0.46 LVEF, % 64 ± 6 64 ± 7 0.75 64 ± 5 65 ± 7 0.58 63 ± 9 62 ± 9 0.38 E/A ratio 1.00 (0.88 - 1.26) 1.03 (0.80 - 1.32) 0.85 1.10 (0.90 - 1.42) 1.07 (0.83 - 1.37) 0.26 1.00 (0.83 - 1.21) 0.90 (0.76 - 1.11) 0.097 Antihypertensive treatment 12 (12.0%) 44 (88.0%) < 0.0001 9 (9.2%) 9 (18.0%) 0.13 13 (18.1%) 9 (25.0%) 0.33 ACE inhibitor 5 (5.0%) 13 (26.0%) 0.0005 2 (2.0%) 5 (10.0%) 0.033 3 (4.2%) 3 (8.3%) 0.39 Beta blocker 6 (6.0%) 25 (50.0%) < 0.0001 6 (6.1%) 6 (12.0%) 0.24 11 (15.3%) 7 (19.4%) 0.54 ARB 2 (2.0%) 12 (24.0%) - 0 (0.0%) 3 (6.0%) - 1 (1.4%) 3 (8.3%) 0.077
Legend : BP, blood pressure ; eGFR, estimated glomerular filtration rate; LVEF, left ventricular ejection fraction; ACE, angiotensin-converting enzyme; ARB, angiotensin receptor blocker.
Table 2. Biomarkers retained in >80% LASSO plus stepwise forward
Hypertension OR (95%CI) p-value GDF-15 > T2 (836.98) 5.82 (1.64 - 20.6) 0.006
LEP 4.60 (1.97 - 10.7) 0.0004
SORT-1 0.41 (0.23 - 0.73) 0.002
FABP-2 > T1 (7.34) 0.35 (0.13 - 0.92) 0.033
Obesity OR (95%CI) p-value
LEP 4508 (22.7 - 893772) 0.002
CEACAM-8 > median (2.42) 63.5 (2.94 - 1368) 0.008
PRELP 0.05 (0.01 - 0.39) 0.004
Diabetes OR (95%CI) p-value
GDF-15 3.53 (1.15 - 10.9) 0.028
REN > median (6.50) 15.4 (1.92 - 123) 0.010
CXCL-1 0.27 (0.09 - 0.77) 0.014
SCF > T2 (8.20) 0.23 (0.06 - 0.92) 0.038
Legend: GDF-15, growth differentiation factor 15; LEP, leptin; SORT-1, sortilin; FABP-2, fatty acid binding protein-2; CEACAM-8, cell adhesion molecule 8; PRELP, proline/arginine-rich end leucine-rich repeat protein; REN, renin; CXCL-1, chemokine (C-X-C motif) ligand 1; SCF, stem-cell factor; OR, odds ratio; CI, confidence interval.
The OR corresponds to a doubling in the protein concentration (NPX units).
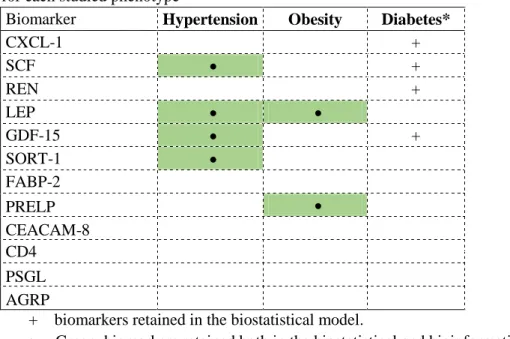
Table 3. Summary of the biomarkers retained both in the LASSO and in the bioinformatical approach for each studied phenotype
Biomarker Hypertension Obesity Diabetes*
CXCL-1 + SCF + REN + LEP GDF-15 + SORT-1 FABP-2 PRELP CEACAM-8 CD4 PSGL AGRP
+ biomarkers retained in the biostatistical model.
Green, biomarkers retained both in the biostatistical and bioinformatical models.