Comparison of fast neutron spectra in graphite and FLINA
salt inserted in well-defined core assembled in LR-0 reactor
The MIT Faculty has made this article openly available. Please share how this access benefits you. Your story matters.
Citation Košťál, Michal et al. “Comparison of Fast Neutron Spectra in Graphite and FLINA Salt Inserted in Well-Defined Core Assembled in LR-0 Reactor.” Annals of Nuclear Energy 83 (September 2015): 216–225 © 2015 Elsevier Ltd
As Published http://dx.doi.org/10.1016/j.anucene.2015.04.011
Publisher Elsevier
Version Original manuscript
Citable link http://hdl.handle.net/1721.1/111160
Terms of Use Creative Commons Attribution-NonCommercial-NoDerivs License
Comparison of neutron spectra in graphite and FLINA salt inserted in well-defined core assembled in LR-0 Reactor
Michal Košťál*1; Martin Veškrna2, František Cvachovec3, Bohumil Jánský1, Evžen Novák1,
Vojtěch Rypar1, Ján Milčák1, Evžen Losa1, Filip Mravec2, Zdeněk Matěj2, Jiří Rejchrt1,
Benoit Forget 4, Sterling Harper 4
1 Research Center Rez Ltd, 250 68 Husinec-Rez 130, Czech Republic 2 Masaryk University, Botanická 15, Brno 612 00, Czech Republic 3 University of Defence, Kounicova 65, Brno 612 00, Czech Republic
4 Massachusetts Institute of Technology, Department of Nuclear Science and Engineering, 77
Massachusetts Avenue, Building 24, Cambridge, MA 02139, United States Email: Michal.Kostal@cvrez.cz
Telephone: +420266172655
Abstract
The present paper aims to compare the calculated and measured spectra after insertion of candidate materials for the MSR/FHR reactor system concept into the LR-0 reactor. The calculation is realized with MCNP6 code using ENDF/B VII.0, JEFF 3.1, JENDL 3.3, JENDL 4, ROSFOND and CENDL 3.1 nuclear data libraries. Additionally, comparisons between the slowing down power of each media were performed. The slowing down properties are important parameters affecting the thickness of moderator media in a reactor.
1 Introduction
Graphite and fluorine salts like LiF-NaF or LiF-BeF2 salts (hereinafter FLINA and FLIBE
respectively) with highly enriched 7Li isotope are strong candidates for generation IV reactor designs such as the HTGR and FHR. Consequently, there is strong interest in experiments which study reactors composed of graphite and fluoride salts which are important for correct calculation of slowing down properties and also for description of neutron spectra on the structural components of FHR/MSR systems.
The intent of this paper is to present neutron spectra measurements in various configurations in the center of the driver core and compare these measurements to Monte Carlo simulations using various nuclear data libraries. The configurations tested include FLINA salt, graphite insertions and a void center channel. In this paper, FLINA salt with natural Li enrichment was used due to limited availability of high enriched Li-7 salt. The fluorine content in FLINA is comparable to that of FLIBE, the primary candidate for FHR systems, thus any discrepancies in 19F, as observed by Kato et al 2014, should be observed in either salt. The experiments were performed in the LR-0 reactor which is a light water reactor that achieves criticality by increasing moderator level. These experiments are performed in the frame of The Memorandum of Understanding on nuclear power between the Czech Ministry of Trade and Industry and the U.S. DOE (DOE 2013).
2 Reactor arrangement
The measurements were performed in a special core assembled in the experimental zero-power reactor LR-0 (Research Centre Řež ltd.). Reactor LR-0 located in Řež near Prague
(Czech Republic) is an experimental, light-water-moderated zero-power reactor originally designed for research of VVER-1000 and VVER-440 type reactor cores, spent-fuel storage lattices, and for benchmark experiments.
Power control in this core arrangement is achieved by changing the moderator level. Power control can also be realized by adjusting insertion of control rods in certain core configurations. The LR-0 fuel elements are radially identical, but axially shorter than a VVER-1000 fuel assembly. Continuous maximal operating power is 1 kW with thermal neutron flux density ≈109 n cm-2 s-1.
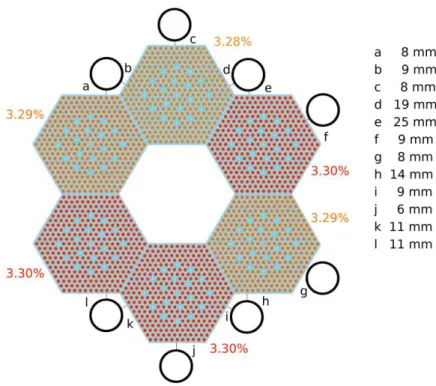
The main feature of the LR-0 is the flexibility of the supporting structures allowing arbitrary composition of core. In the experiment six fuel assemblies surrounds the experimental dry assembly where the studied media (graphite, void or FLINA) is inserted. Around the core there are aluminum dry channels with inner diameters of 7 cm and thickness of 5 mm that contain detectors. The detail layout of the core can be found in Figure 1, with the detailed center channel configurations in Figure 2. Slight enrichment variations of the as-fabricated assemblies are observed and were modeled using precise uranium inventory data. .
Figure 1.: Radial cross-section of the core with specified enrichment
3 Experimental and calculation methods 3.1 Measuring arrangement
Neutron spectra in the 0.8 to 10 MeV energy range were measured via the proton-recoil method using a Stilbene scintillator (10x10mm) with neutron and gamma pulse shape discrimination (hereinafter Stilbene).
The two-parameter spectrometric system (Veskrna et al 2014) is fully digitized and it is able to process up to 100 000 impulses per second in energy range from 0.8 MeV to 15 MeV. The input analog signal from photomultiplier is divided in the amplifier into two branches. Each branch is differently amplified and digitized by separate analog to digital converters. This
different amplification increases the dynamic range of particle energies so that the spectrometer is capable of processing and increase the signal to noise ratio. Two fast analog to digital converters working on sampling frequency 1 GHz are used and the digital signal processing is implemented in field-programmable gate array. Therefore it is able to process all data flow from both analog to digital converters without any dead time. Pulse shape discrimination is realized by integration method which principle lies in comparison of area limited by a trailing edge of the measured response with area limited by the whole response. Deconvolution of recoiled proton spectra was performed using Maximum Likelihood Estimation (Error! Reference source not found.).
Neutron spectra below 1.3 MeV were measured using a hydrogen chamber (hereinafter HPC), operated at 400 kPa in the 0.111 - 0.368 MeV energy range and at 1000 kPa in the higher range (Jansky et al 2014).
3.2 Experimental arrangement
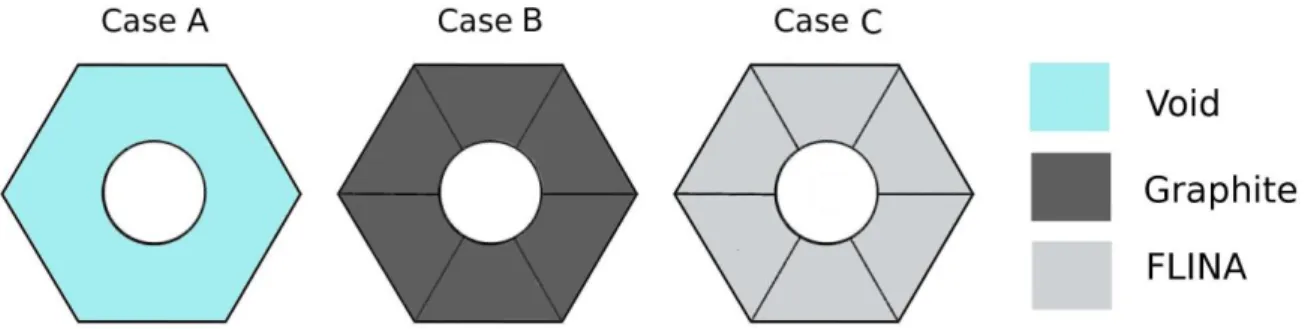
The tested material geometry (Figure 2) composes of 6 blocks. Both graphite (Case B) and salt blocks (Case C) have the same dimensions. Graphite blocks are full, as they are milled from bigger blocks, while the FLINA salt is contained in aluminum canisters with 5 mm wall thickness. The void hexagonal tube (Case A) is also studied.
Figure 2.: Various configurations of core insertion
The graphite used in this experiment has a density of 1.72 g/cm3 and impurities concentration
below 0.2 ppm of boron equivalent. The FLINA salt, one of the possible materials planned for the reactor system, has a composition of 60%LiF+40%NaF and density of, 1.72 g/cm3.
1E-2 1E-1 1E+0 1E+1 1E+2
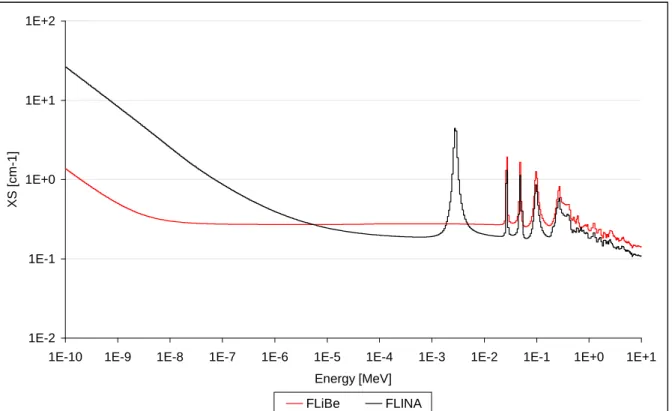
1E-10 1E-9 1E-8 1E-7 1E-6 1E-5 1E-4 1E-3 1E-2 1E-1 1E+0 1E+1 Energy [MeV] XS [ c m -1 ] FLiBe FLINA
Figure 3.: Comparison of FLIBE and FLINA macroscopic cross section
3.3 Calculation methods
The simulations were performed using the MCNP6 Monte Carlo code Pellowitz 2013 at the experimentally determined moderator height with selected nuclear data libraries: ENDF VII.0,
JEFF 3.1, JENDL 4, JENDL 3.3, ROSFOND 2009 and CENDL 3.1. Nuclear data libraries
were processed using the NJOY code (Error! Reference source not found.). Good agreement of calculated keff with critical value (1.000) was obtained indicating that the fission
source uncertainty has only a minor role in the spectra results (in ENDF VII keff are 1.002 for
void geometry, 1.001 for graphite and 0.998 for salt insertion). Additional results comparing the various libraries can be found in Kostal et al 2014. The MCNP6 results were also compared with those obtained with OpenMC (Romano and Forget 2013), which showed good agreement.
The calculated uncertainties of fluxes in wide groups are, in all cases, below 2%, in narrow groups (neutron spectra in linear division per 0.1MeV) and in high energy region below 10%..
4 Results
4.1 Neutron flux densities in wide groups
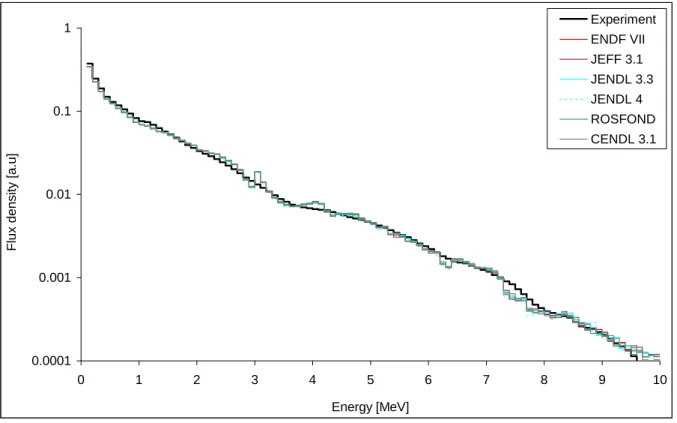
Figure 4 shows a comparison of the experimentally determined and calculated spectra for the void channel, Figure 5 for experimental and calculated spectra in graphite and Figure 6 for experimental and calculated spectra in FLINA salt. The fluxes are listed in Table 1 for the voided case, in Table 2 for graphite and in Table 3 for FLINA.
The presented spectra are combinations of proportional counter results and stilbene measurements. The stilbene results are over 1.2 MeV and the proportional counter are below 1.3 MeV. The interval of 1.2 to 1.3 MeV is used for normalization of results. The final spectra are normalized to 1 in integral 1 – 10 MeV.
For the experiment, the statistical uncertainties along with the uncertainties of calibration and uncertainty in detector resolution are in the range of 5% below 5 MeV, about 5 - 8% in 5-8 MeV and reach 10% in the energy region above 8 MeV.
For a comparison of the experiment and the calculation more sources of uncertainty have to be taken into consideration; in addition to the previously mentioned experimental
uncertainties and statistical MCNP uncertainty, there are also uncertainties in material
description of fuel and insertion. For narrow groups the combined uncertainty in lower energy regions is 5- 10 % and in higher ones 10-15 %
0.000 0.001 0.010 0.100 1.000 0 1 2 3 4 5 6 7 8 9 10 Energy [MeV] F lux d e n sity [ a .u ] Experiment ENDF VII JEFF 3.1 JENDL 3.3 JENDL 4 ROSFOND CENDL 3.1
Figure 4.: Neutron spectra in void channel
Table 1.: C/E-1 comparison of neutron flux density in void channel
ENDF VII JEFF 3.1 JENDL 3.3 JENDL 4 ROSFOND CENDL 3.1
0.1 -1 -7% -6% -7% -7% -7% -7% 1 - 2 -5% -5% -5% -5% -6% -7% 2 - 3 8% 8% 8% 9% 8% 9% 3 - 4 3% 3% 2% 2% 3% 4% 4 - 5 6% 5% 5% 3% 6% 7% 5 - 6 -2% -4% -1% -2% -2% -1% 6 - 7 -6% -6% -4% -6% -5% -4% 7 - 8 -6% -6% -8% -8% -7% -7% 8 - 9 -9% -7% -3% -5% -4% -7% 9 - 10 -4% -3% -4% -2% -5% -1%
As expected the calculations are in satisfactory agreement with experiment in case of void channel. Various library results are in quite good agreement between each other. Some discrepancies can be found in the upper energy region. Additionally, some systematic under prediction (see Table 1) in the low energy region, although comparable with uncertainties, can
be observed. This effect is most probably caused by poor separation between gamma and neutrons in the region near 1 MeV.
0.0001 0.001 0.01 0.1 1 0 1 2 3 4 5 6 7 8 9 10 Energy [MeV] F lux d e n sity [ a .u ] Experiment ENDF VII JEFF 3.1 JENDL 3.3 JENDL 4 ROSFOND CENDL 3.1
Figure 5.: Neutron spectra in graphite
Table 2.: C/E-1 comparison of neutron flux in graphite
ENDF
VII JEFF 3.1 JENDL 3.3 JENDL 4 ROSFOND
CENDL 3.1 0.1 -1 -8% -7% -8% -8% -8% -9% 1 - 2 -4% -4% -4% -3% -4% -5% 2 - 3 7% 7% 7% 6% 7% 9% 3 - 4 7% 7% 7% 5% 7% 8% 4 - 5 6% 6% 5% 3% 6% 7% 5 - 6 -6% -6% -3% -4% -5% -4% 6 - 7 -2% -4% -3% -4% -3% -2% 7 - 8 -11% -11% -11% -14% -10% -9% 8 - 9 2% 2% 3% 1% -2% -3% 9 - 10 16% 23% 20% 18% 17% 16%
The spectra measured in graphite insertion, especially at higher energies are in good
agreement with calculation. All three inflections (see Figure 5) at 3.5MeV, 6MeV and 8 MeV determined by means of experiment occurs in all library results. They are reflecting the wide peaks of the 12C cross section. Comparable character of measured spectra can be found in
Olah et al 1999 and also in Makarious et al 1996. Some variations between the nuclear data
libraries results can be found in higher energy regions. Slight underestimation of the experiment in the lower energy region, comparable with previous case, can be observed, which is once again attributed to poor separation between gamma and neutrons or apparatus noises near 1 MeV. Nevertheless the agreement is still satisfactory.
0.0001 0.001 0.01 0.1 1 0 1 2 3 4 5 6 7 8 9 10 Energy [MeV] F lux d e n sity [ a .u ] Experiment ENDF VII JEFF 3.1 JENDL 3.3 JENDL 4 ROSFOND CENDL 3.1
Figure 6.: Neutron spectra in FLINA salt
Table 3.: C/E-1 comparison of neutron flux in FLINA
ENDF
VII JEFF 3.1 JENDL 3.3 JENDL 4 ROSFOND
CENDL 3.1 0.1 -1 -2% -51% -10% -9% -10% -3% 1 - 2 -3% -4% -3% -3% -3% -5% 2 - 3 8% 8% 8% 8% 7% 10% 3 - 4 3% 5% 2% 2% 2% 6% 4 - 5 3% 3% 1% 0% 2% 4% 5 - 6 -5% -2% -2% -3% -4% -6% 6 - 7 -8% -10% -6% -6% -4% -12% 7 - 8 -14% -7% -9% -7% -6% -12% 8 - 9 -8% -7% -4% -5% -2% -10% 9 - 10 4% 3% 5% 0% 11% -2%
The FLINA is the case where the most notable differences between experiment and calculation can be found. An interesting observation is the notable variations between the different nuclear data libraries in the low energy region seen in Figure 6. Looking at Table 3 in the 0.1-1MeV range, the calculation underestimates experiment by 2% using ENDF VII and as much as 10% using JENDL 4. Although optimistic, the ENDF VII results overestimate the flux in the 0.1 to 0.2 MeV range by 13% and underestimate the 0.2 to 1.0 MeV range by 8%.
0.000 0.001 0.010 0.100 1.000 0 1 2 3 4 5 6 7 8 9 10 Energy [MeV] Flux d e n s it y [ a .u ] Void case FLINA Graphite Fission spectra
Figure 7.: Neutron fluxes in various insertions
Table 4.: Measured neutron spectra in various insertions
Void FLINA GRAPHITE 0.1 -1 1.103E+0 1.440E+0 1.483E+0 1 - 2 4.813E-1 5.440E-1 5.557E-1 2 - 3 2.524E-1 2.341E-1 2.338E-1 3 - 4 1.263E-1 1.078E-1 9.118E-2 4 - 5 6.737E-2 5.530E-2 5.716E-2 5 - 6 3.730E-2 3.014E-2 3.391E-2 6 - 7 1.963E-2 1.594E-2 1.615E-2 7 - 8 9.274E-3 7.579E-3 7.745E-3 8 - 9 4.383E-3 3.532E-3 3.062E-3 9 - 10 2.046E-3 1.567E-3 1.235E-3
Comparison between all measured spectra plotted in Figure 7 shows that both graphite and FLINA slow down neutrons effectively with graphite being slightly better. In the case of FLINA, in the lowest 0.1-1MeV group, flux increases by 31% over the void case, while in graphite it increases by 35%. The shape of spectra reflects the slowing down properties, while the absorbing properties of various insertions are reflected in various critical levels. In void case the moderator critical height is 55.6cm. The graphite has very low cross section, thus when graphite insertion is used, the critical moderator level is lower than in void case, namely 43.221cm. FLINA is strong absorber. When used, the moderator critical level increases to 80.255cm. It means that in FLINA case the water level is higher than the FLINA capsule.
Table 5.: Calculated keff for various arrangements in various libraries
ENDF
VII JEFF 3.1 JENDL 3.3 JENDL 4 ROSFOND
CENDL 3.1
Void 1.00183 1.00050 0.99908 1.00138 1.00077 1.00053 Graphite 1.00134 0.9999 0.99859 1.00056 1.00022 0.99998 FLINA 0.99877 0.99743 0.99587 0.99818 0.99769 0.99724
5 Neutron flux densities in smooth structure
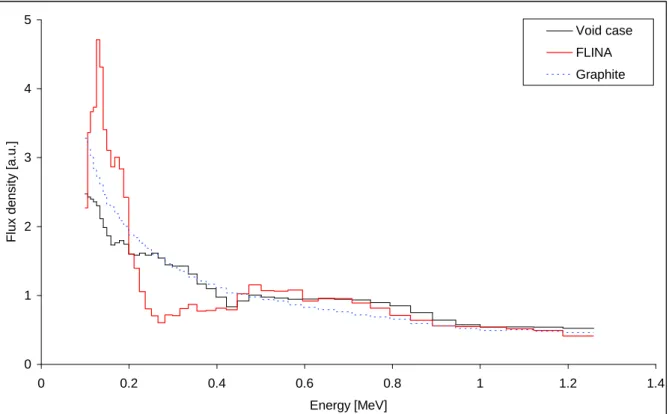
As mentioned above, the previous comparisons where performed by normalizing the proportional counter and stilbene results using overlapping 1.2 to 1.3 MeV energy range. This could result in systematic overestimation. Thus, the analysis was also performed by comparing the proportional counter results normalized to calculation in the interval 0.1-1MeV. The comparison between calculation and measurement is realized by means of C/E-1 ratio using a smooth structure of 40 groups per decade. The experimental results are plotted in Figure 8. The spectrum in graphite is quite smooth structure, while FLINA and Void cases have peaks. These peaks are caused by the fine structure of materials forming FLINA and also structural materials, like aluminum used to clad the void channel
0 1 2 3 4 5 0 0.2 0.4 0.6 0.8 1 1.2 1.4 Energy [MeV] F lux d e n sity [ a .u .] Void case FLINA Graphite
Figure 8.: Measured spectra normalized to 1 in interval 0.1-1MeV
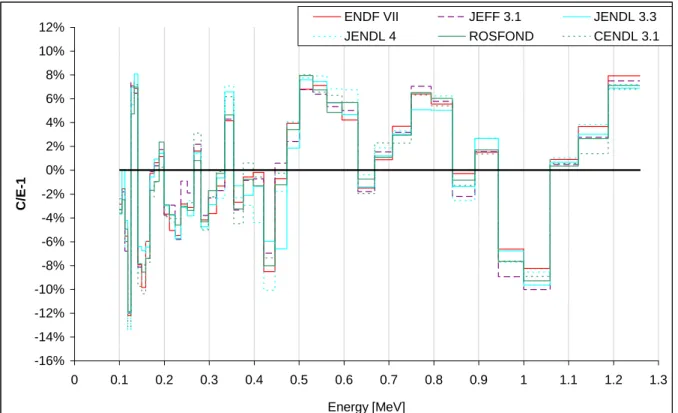
In the case of the void channel (see Figure 9), the calculation to experiment ratio (C/E-1 hereafter) oscillates between -10% and 10%. The discrepancies are most probably caused by insufficient resolution of the detector which manifests itself in the peaks of the spectrum. In the case of graphite the agreement is better as (see Figure 10), the reason being the smoother nature of the cross-section over this energy range.
Notable variations can be found in the case of the FLINA insertion as illustrated inFigure 11. Part of the effect might be on account of the poor resolution, but the rate of underestimation in 0.3-0.5MeV is in many cases higher than the uncertainties (3-4%). Additionally, strong variations are observed when comparing the JENDL 3.3 and ENDF VII libraries. JENDL
results in the 0.2-0.3MeV region have a discrepancy of about 5% while ENDF VII is nearly 21%. Similar trends are also observed in the 0.9-1.3MeV region.
Generally the results agree with those presented by Kato et al 2014.
-16% -14% -12% -10% -8% -6% -4% -2% 0% 2% 4% 6% 8% 10% 12% 0 0.1 0.2 0.3 0.4 0.5 0.6 0.7 0.8 0.9 1 1.1 1.2 1.3 Energy [MeV] C/E -1
ENDF VII JEFF 3.1 JENDL 3.3
JENDL 4 ROSFOND CENDL 3.1
Figure 9.: C/E-1 in low energy region in void channel
Table 6.: C/E-1 of neutron flux densities in void channel and low energy region
Measurement ENDF VII JEFF 3.1 JENDL 3.3 JENDL 4 ROSFOND CENDL 3.1 0.1 0.202 -2.2% -2.2% -1.5% -2.5% -2.6% -3.0% 0.2 0.156 -3.0% -2.2% -3.1% -3.1% -2.8% -2.6% 0.3 0.127 -0.7% -0.7% 0.0% -0.5% -0.3% 0.1% 0.4 0.0942 -2.0% -1.9% -3.8% -3.5% -2.3% -1.6% 0.5 0.0965 5.9% 5.5% 6.3% 6.8% 6.0% 6.4% 0.6 0.0940 2.0% 2.6% 2.3% 3.8% 2.8% 2.7% 0.7 0.0914 4.6% 4.7% 3.8% 4.5% 4.3% 4.2% 0.8 0.0781 2.9% 2.1% 2.1% 2.4% 3.0% 2.3% 0.9 0.0606 -3.7% -4.9% -3.1% -3.8% -4.2% -4.3% 1 0.0548 -5.9% -7.1% -6.4% -5.9% -6.7% -6.1% 1.1 0.0583 -3.8% -4.1% -4.4% -3.5% -4.5% -5.4% 1.2 0.0533 2.1% 1.0% 1.3% 1.4% 1.5% 0.4%
-10% -8% -6% -4% -2% 0% 2% 4% 6% 8% 10% 0 0.1 0.2 0.3 0.4 0.5 0.6 0.7 0.8 0.9 1 1.1 1.2 1.3 Energy [MeV] C/E -1
ENDF VII JEFF 3.1 JENDL 3.3
JENDL 4 ROSFOND CENDL 3.1
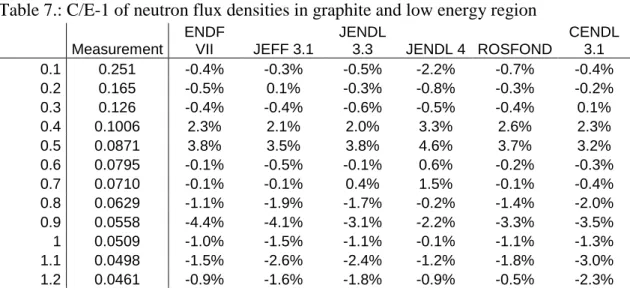
Figure 10.: C/E-1 in low energy region in graphite
Table 7.: C/E-1 of neutron flux densities in graphite and low energy region
Measurement ENDF VII JEFF 3.1 JENDL 3.3 JENDL 4 ROSFOND CENDL 3.1 0.1 0.251 -0.4% -0.3% -0.5% -2.2% -0.7% -0.4% 0.2 0.165 -0.5% 0.1% -0.3% -0.8% -0.3% -0.2% 0.3 0.126 -0.4% -0.4% -0.6% -0.5% -0.4% 0.1% 0.4 0.1006 2.3% 2.1% 2.0% 3.3% 2.6% 2.3% 0.5 0.0871 3.8% 3.5% 3.8% 4.6% 3.7% 3.2% 0.6 0.0795 -0.1% -0.5% -0.1% 0.6% -0.2% -0.3% 0.7 0.0710 -0.1% -0.1% 0.4% 1.5% -0.1% -0.4% 0.8 0.0629 -1.1% -1.9% -1.7% -0.2% -1.4% -2.0% 0.9 0.0558 -4.4% -4.1% -3.1% -2.2% -3.3% -3.5% 1 0.0509 -1.0% -1.5% -1.1% -0.1% -1.1% -1.3% 1.1 0.0498 -1.5% -2.6% -2.4% -1.2% -1.8% -3.0% 1.2 0.0461 -0.9% -1.6% -1.8% -0.9% -0.5% -2.3%
-50% -40% -30% -20% -10% 0% 10% 20% 30% 40% 0 0.1 0.2 0.3 0.4 0.5 0.6 0.7 0.8 0.9 1 1.1 1.2 1.3 Energy [MeV] C/E -1
ENDF VII JEFF 3.1 JENDL 3.3
JENDL 4 ROSFOND CENDL 3.1
Figure 11.: C/E-1 in low energy region in salt
Table 8.: C/E-1 of neutron flux densities in FLINA and low energy region
Measurement ENDF VII JEFF 3.1 JENDL 3.3 JENDL 4 ROSFOND CENDL 3.1 0.1 0.282 15.1% -100.0% 18.0% 17.7% 18.5% 13.7% 0.2 0.118 -22.0% -100.0% -4.8% -4.6% -7.1% -20.0% 0.3 0.098 -18.2% -100.0% -7.5% -7.6% -8.7% -17.5% 0.4 0.0998 -5.0% 90.6% -14.9% -14.0% -15.1% -3.2% 0.5 0.1075 -1.3% 102.7% -13.4% -13.2% -14.1% 0.5% 0.6 0.0936 2.5% 105.1% -4.4% -5.0% -5.0% 3.4% 0.7 0.0777 7.9% 104.8% -3.6% -3.8% -1.2% 3.2% 0.8 0.0655 2.8% 103.5% -0.9% -0.7% 1.0% 2.4% 0.9 0.0581 -4.7% 85.1% -1.8% -1.6% -0.4% -4.2% 1 0.0573 -5.1% 84.6% 3.3% 3.0% 2.5% -7.0% 1.1 0.0508 -6.1% 82.5% 3.5% 3.7% 3.7% -6.5% 1.2 0.0468 -13.2% 73.0% -5.3% -5.3% -4.7% -14.7%
The variations between JENDL 3.3 and ENDF VII can be explained by different description of 19F, namely different inelastic to elastic scatter ratio. For detailed cross section plots see Figure 12. The notable increase in inelastic scatter in region 0.4-0.6MeV in JENDL 3.3 reflects in neutron flux decrease in the same region. The loosed neutrons are scattered into the 0.2-0.4MeV region because of the relatively low adopted levels (namely109.89 keV for first and 197.14keV for second level). Thus in this interval notably higher flux than in ENDF VII case can be observed.
0 0.2 0.4 0.6 0.8 1 1.2 1.4 1.6 1.8 0 1 2 3 4 5 6 7 8 9 10 Energy [MeV] In e last ic to e last ic sca tt e r r a tio ENDF VII JENDL 3.3
Figure 12.: Inelastic to elastic scatter ratio
6 Conclusions
The neutron spectra in arrangements with void, graphite and FLINA salt insertions were measured. The best agreement between experiments and Monte Carlo simulations was obtained for graphite where all nuclear data libraries agree quite well with experiment. This result is not too surprising since graphite is well described due a long history as a nuclear material. The smooth character of its cross section also reduces calculation to experiment discrepancies in the low energy region.
Good agreement was also in the void case. Some discrepancies were found in the low energy region, but they are small and can be attributed to insufficient resolution of the detector. The results of wider group structure fully support this conclusion.
Notable discrepancies are observed with the FLINA capsule where differences as high as 40% are observed, nearly 10 times more than related uncertainties. Additionally, the various nuclear data libraries differ from each other. The reason is attributed mainly to variations in
19F evaluations, namely in the inelastic to elastic scatter ratio. The observed trend is
comparable to those presented by Kato et al 2014.
7 Acknowledgements
These experiments and calculations have been funded by Research Centre Rez Ltd. within Ministry of Education, Youth and Sport Czech Republic project MSM 2672244501, and by SUSEN Project CZ.1.05/2.1.00/03.0108 realized within the framework of the European Regional Development Fund (ERDF). The last two authors would also like to acknowledge support from the MIT UROP program and the DOE NEUP program for partial support of this work.
8 References
CENDL 3.1 http://www.oecd-nea.org/dbforms/data/eva/evatapes/cendl_31/
DOE 2013
http://www.energy.gov/ne/articles/united-states-and-czech-republic-join-together-announce-bilateral;
http://www.energy.gov/articles/energy-department-completes-salt-coolant-material-transfer-czech-republic-advanced-reactor
ENDF VII.0 M.B. Chadwick, P. Obložinský, M. Herman et al ENDF/B-VII.0: Next
Generation Evaluated Nuclear Data Library for Nuclear Science and Technology, Nuclear Data Sheets, Volume 107, Issue 12, December 2006, Pages 2931-3060, ISSN 0090-3752, doi:10.1016/j.nds.2006.11.001
Kato et al 2014 Yoshinari Kato, Kosuke Takakura, Masayuki Ohta, Kentaro Ochiai, Satoshi
Sato, Chikara Konno, Benchmark test of JENDL-4.0 with TOF experiments at Osaka Univ./OKTAVIAN, Progress in Nuclear Science and Technology, 4, pp. 317-321 (2014)
Jansky et al 2014 Bohumil Jansky, Evzen Novak, Neutron spectrometry with spherical
hydrogen proportional detectors, Nuclear Instruments and Methods in Physics Research Section A: Accelerators, Spectrometers, Detectors and Associated Equipment, Volume 735, 21 January 2014, Pages 390-398, ISSN 0168-9002, doi:10.1016/j.nima.2013.08.034
JEFF 3.1
www.oecd-nea.org/dbforms/data/eva/evatapes/jeff_31/JEFF31/index-JEFF-N_1.html
JENDL 3.3 http://wwwndc.jaea.go.jp/jendl/j33/j33.html
JENDL 4 http://wwwndc.jaea.go.jp/jendl/j40/j40.html
Kostal et al 2014 Michal Košťál, Ján Milčák, Vlastimil Juříček, Evžen Losa, Benoit Forget,
Sterling Harper, Neutronic, Study of graphite reactivity worth on well-defined core assembled LR-0 Reactor, will be published
Kyncl et al 2008J. Kyncl, V. Rypar, E. Novák: LEU-COMP-THERM-087 „VVER Physics
Experiments: Hexagonal Lattices (1.22 cm Pitch) of Low Enriched U(3.6, 4.4 wt.% U235)O2
Fuel Assemblies in Light Water with Variable Fuel Assemblies Pitch”, 2008, NEA/NSC/DOC/(95)03/IV Volume IV
LANL 2003 MCNP—A General Monte Carlo N-Particle Transport Code. Version 5,
LA-CP-03-0245, X-5 Monte Carlo Team, Los Alamos National Laboratory, Los Alamos, NM, USA
Mac Farlane 1994 Mac Farlane, R. E. and Muir, D. W., The NJOY Nuclear Data Processing
System, Version 91, LA-12740-M, 1994
Makarious et al 1996 A.S. Makarious, I.I. Bashter, A. El-Asyed Abdo, W.A. Kansouh
Measurement of fast neutrons and secondary gamma rays in graphite, Annals of Nuclear Energy, Vol. 23, 1996, pp. 617-623
Olah et al 1999 L. Oláh, A. Fenyvesi, J. Jordanova, A.M. El-Megrab, A.D. Majdeddin,
Darsono, N. Perez, M.Y.A. Yousif, J. Csikai, Measurements and calculations of neutron leakage spectra from slabs irradiated with 9Be(d, n)10B 2H(d, n)3He and Pu–Be neutrons, Applied Radiation and Isotopes, Vol. 50, 1999, pp 479-486
Pellowitz 2013 D.B. Pelowitz (Ed.), MCNP6™ User's Manual, Los Alamos National
Laboratory Report, LA-CP-13–00634 (2013)
Romano and Forget 2013 Paul Romano and Benoit Forget, The OpenMC Monte Carlo
Particle Transport Code, Annals of Nuclear Energy, Vol. 51, 2013, pp 274-281
ROSFOND 2009 http://www.ippe.ru/podr/abbn/english/libr/rosfond.php
Veskrna et al 2014 Digitalized two parametric system for gamma/neutron spectrometry,
Martin Veškrna, Zdeněk Matěj, Filip Mravec, Václav Přenosil, František Cvachovec, Michal Košťál, 18th Topical Meeting of the Radiation Protection & Shielding Division of ANS, Knoxville, TN USA, 2014,