HAL Id: hal-02891780
https://hal.univ-lorraine.fr/hal-02891780
Submitted on 7 Jul 2020
HAL is a multi-disciplinary open access
archive for the deposit and dissemination of
sci-entific research documents, whether they are
pub-lished or not. The documents may come from
teaching and research institutions in France or
abroad, or from public or private research centers.
L’archive ouverte pluridisciplinaire HAL, est
destinée au dépôt et à la diffusion de documents
scientifiques de niveau recherche, publiés ou non,
émanant des établissements d’enseignement et de
recherche français ou étrangers, des laboratoires
publics ou privés.
Distributed under a Creative Commons Attribution| 4.0 International License
Direct simulation of non-additive properties on
unstructured grids
Pauline Mourlanette, Pierre Biver, Philippe Renard, Benoit Noetinger,
Guillaume Caumon, Yassine Alexandre Perrier
To cite this version:
Pauline Mourlanette, Pierre Biver, Philippe Renard, Benoit Noetinger, Guillaume Caumon, et al..
Direct simulation of non-additive properties on unstructured grids. Advances in Water Resources,
Elsevier, 2020, 143, pp.103665. �10.1016/j.advwatres.2020.103665�. �hal-02891780�
ContentslistsavailableatScienceDirect
Advances
in
Water
Resources
journalhomepage:www.elsevier.com/locate/advwatres
Direct
simulation
of
non-additive
properties
on
unstructured
grids
Pauline
Mourlanette
a,b,c,∗,
Pierre
Biver
a,
Philippe
Renard
b,
Benoît
N
œ
tinger
d,
Guillaume
Caumon
e,
Yassine
Alexandre
Perrier
fa Total, Avenue Larribau, 64000 Pau, France
b University of Neuchâtel, Center for Hydrogeology and Geothermics, 11 Rue Emile Argand, CP-2000 Neuchâtel, Switzerland c Sorbonne University, 21 Rue de l’Ecole de médecine, 75006 Paris, France
d IFPEN, 1–4 Avenue du Bois Préau, 92852 Rueil-Malmaison, France
e Université de Lorraine, RING GeoRessources Laboratory, 2 rue du Doyen Marcel Roubault, Vandoeuvre-lès-Nancy, 54500, France f Université de Lorraine, ENSG, 2 rue du Doyen Marcel Roubault, Vandoeuvre-lès-Nancy, 54500, France
a
r
t
i
c
l
e
i
n
f
o
Keywords: Upscaling Permeability Geostatistics Power-averaginga
b
s
t
r
a
c
t
Uncertaintiesrelatedtopermeabilityheterogeneitycanbeestimatedusinggeostatisticalsimulationmethods. Usually,thesemethodsareappliedonregulargridswithcellsofconstantsize,whereasunstructuredgridsare moreflexibletohonorgeologicalstructuresandofferlocalrefinementsforfluid-flowsimulations.However,cells ofdifferentsizesrequiretoaccountforthesupportdependencyofpermeabilitystatistics(supporteffect). Thispaperpresentsanovelworkflowbasedonthepoweraveragingtechnique.Theaveragingexponent 𝜔 is es-timatedusingaresponsesurfacecalibratedfromnumericalupscalingexperiments.Usingspectralturningbands, permeabilityissimulatedonpointsineachunstructuredcell,andlateraveragedwithalocalvalueof 𝜔 that dependsonthecellsizeandshape.
Themethodisillustratedonasyntheticcase.Thesimulationofatracerexperimentisusedtocomparethis novelgeostatisticalsimulationmethodwithaconventionalapproachbasedonafinescaleCartesiangrid.The resultsshowtheconsistencyofboththesimulatedpermeabilityfieldsandthetracerbreakthroughcurves.The computationalcostismuchlowerthantheconventionalapproachbasedonapressure-solverupscaling.
1. Introduction
Subsurfacephenomenacannotbeobserveddirectlyduetoscale is-suesandinaccessibility.Inhydrogeology,thehighspatialvariabilityof rocktypesandtheassociatedpermeabilityfieldaswellasthehigh spa-tialandtemporalvariabilityoffluidtypesanddisplacementsisamain sourceofuncertainties.Estimatingtheseuncertaintiesisparticularly im-portantinacontextofengineeringdesignanddecisionmaking. Exam-plesofapplicationsincludethemanagementofover-exploitedaquifers orthepropagationofdangerouscontaminants(DeMarsilyetal.,1998). Similaruncertaintyissuescoupledwithdecision-makingare encoun-teredinotherappliedgeoscienceengineering,suchasoilandgas indus-try(Preux,2016),CO2storageinaquifers(Michaeletal.,2010;Akhurst etal.,2015),orgeothermalenergyproduction(Vogtetal.,2010; Quin-livanetal.,2015;Witteretal.,2019).
Thispaperfocusesonthespatialmodelingofpermeabilityfields. Duetorockheterogeneity,ameasurementatpoint-supportisnot suffi-cienttodetermineaccuratelythevalueatanotherpoint.Toassessthe
∗Correspondingauthor.
E-mail addresses: [email protected] (P. Mourlanette), [email protected] (P. Biver), [email protected] (P. Renard),
[email protected](B.Nœtinger),[email protected](G.Caumon).
uncertaintyrelatedtothisproblem,onecanemploygeostatistical sim-ulationmethods(DeutschandJournel,1992;Goovaerts,1997;Chilès andDelfiner,2012).
Torepresentthespatialvariabilityandtosolvenumericallytheflow and transport equations, a meshis used and its cells arepopulated withpetrophysicalproperties.Classicalmeshes,widelyknownas reg-ularstructured(orCartesian)grids,arecomposedofhexahedralcells inthreedimensions.Theinterestingaspectofregularstructuredgrids isthattheircellsallsharethesamesize.Dependingonthetypeof nu-mericalmethodsemployedtosolvetheflowproblem,othertypesof gridsexist.Sometoolsuseirregularstructuredgrids,alsocalled corner-point(orstratigraphic)grids,obtainedbydistortinghexahedratofollow morefaithfullygeologicallayers.Regularandirregularstructuredgrids arepracticalfortherapidityofcalculationbuttheypresentsome draw-backs:somecellscanbedegeneratedforhighthicknessvariations,the geometryoftheintersectionsbetweenfaultsorwellsandthegeological structureareapproximated,andcorner-pointregulargridslackspatial adaptivitytohonorlocalcomplexfeaturesoftheparameterfield.To addresstheseissues,unstructuredgridscanbe used:eachvertexcan
https://doi.org/10.1016/j.advwatres.2020.103665
Received3March2020;Receivedinrevisedform29May2020;Accepted21June2020 Availableonline22June2020
haveadifferentnumberofneighbors,andthecell’ssizescanvary. In-deed,theareasofthegridthatpresentmoreinterestorstronger vari-ationsforflow estimationscan berefined andotherpartscoarsened (Prévostetal.,1996).Usually,tominimizenumericalerrors,thegrid isrefinedaroundwellsorfaultsbutitcanalsobeoptimizedbasedon flowpatterns(Mlacniketal.,2003).Inaddition,thecellscanhave var-iousshapessuchastetrahedronorVoronoï polyhedron,offeringmore flexibilitytoadapttogeologicalheterogeneity(Blessentetal., 2011; Merlandetal.,2014).
However,unstructuredgridsbringsanadditionaldifficultyfor geo-statisticalsimulations.Indeed,thestatisticsofthepermeability(andof theothervariables)aresupportdependent(i.e.,instationarysettings, smallercellstendtohaveasmallerinternalvariabilityandlarger inter-cellvariability).Thissupporteffectiswelldocumentedboth theoreti-callyandexperimentally(Matheron,1967;Dagan,1993;Tidwelland Wilson,1997):theprobabilitydistributionfunctionofthepermeability isdifferentforcellsofdifferentvolumes,aswellasthespatial corre-lation.Intuitively,small cellswillfollow thegeostatisticalproperties definedatthepoint-supportscale,keepingtheirlocalaverageand co-variance.Inopposition,forverylargeblockshavingasizegreaterthan theunderlyingintegralscale,theassociatedpermeabilityvaluemaybe showntostabilizetotheso-calledeffectivepermeability,thatisthe self-averagingproperty(BoschanandNoetinger,2012;Nœtingerand Gau-tier,1998; NoetingerandZargar,2004).Ithighlightstheroleofthe interactionbetweenthegeometryandsizeoftheblockandtheintegral scalethatmaycharacterizetheinternalstructureoftheaquifer.Ifthese supporteffectsarenotaccountedfor,thesimulationofthe petrophysi-calvariablescanresultindistortedandpossiblywrongfluidpaths.Itis thereforecrucialtouseappropriategeostatisticalmethodsfor unstruc-turedgrids(and,incidently,forstructuredcornerpointgridsinwhich cellvolumesvarysignificantly,see(Bertoncelloetal.,2008)).
Thesimplestapproachtoaccountforthesupporteffectistosimulate thepropertiesonafine-scalegridusingageostatisticalmodeldefined atmeasurement-support.Inasecondstep,thisgridisoverlaidbythe unstructuredgridofinterest.Thevaluesonthelargecellsarecomputed byaveragingthevaluescontainedinthiscellonthefinescalegrid(e.g., Caumonetal.,2005;Durlofsky,2005).However,modelingthedomain ofinterestatmeasurement-support(typicallyafewcubiccentimeterfor petrophysicalcoremeasurements)isparticularlychallenging.Tobypass thisproblem,asolutionistosimulatedirectlythepropertyonthe un-structuredgridaccountingforsupport effect.Butasecondchallenge arisesbecausepermeabilityisnotadditive.Apropertyissaidtobe ad-ditive(porosityforexample)whentheaveragingcanbecarriedout us-inga(weighted)arithmeticmean.Thisispossiblebecausequantitiesof theunderlyingphysicalpropertycanbeaddedtogetherinameaningful manner.Forexample,volumesofporesintwopartsofasamplecanbe addedtogethertoproducethetotalvolumeofporesinthesample.
Foradditiveproperties,somedirectgeostatisticalsimulation meth-ods accountingfor support effect exist. Theyare based on the ana-lyticalornumericalestimationofthecovariancebetweendatapoints and cells of different support and geometries. Among the existing methods,theDiscreteGaussianModelorDGM(Matheron,1976)has been investigatedandimplemented by Emeryand Ortiz(2011)and Zaytsevetal.(2015).AnotherpossiblemethodistheDirectSequential SimulationorDSS(Deutschetal.,2002).Inallcases,thecovariance valuesvarydependingonthecell’svolumes.However,permeabilityis notadditive:onecannotsimplyaverageitusingsimplesummations. In-stead,apressuresolverorsomeapproximationsmustbeused(Renard andDeMarsily,1997;Manchuketal.,2012;KhanandDawson,2004) andthegeostatisticalmethodscitedabovecannotbedirectlyapplied.
Theaimof thispaper is,therefore,tointroducea newapproach allowingtosimulatepermeabilitydirectlyonanyunstructuredgrid, ac-countingforthesupporteffectandavoidingtheuseofanunderlying finegrid.Themethodtransformsthepermeabilityintoanadditive prop-ertyusingpoweraveragingwithlocalexponentswhichdependonthe geometryandsizeofthecells.Theexponentsareestimatedusinga
lim-itedsetofnumericalexperimentsandanexperimentaldesignapproach. ThesimulationprocessthenreliesonaSpectralTurningBandsapproach (MantoglouandWilson,1982;Emeryetal.,2016).Thisoverallstrategy permitstogenerate efficientlyasetofrealizations.InSection3, the applicabilityofthemethodisillustratedonasyntheticcaseincluding tracertestsimulations.
2. Methodology
The general workflow of the proposed approach is illustrated in Fig.1.Thedetailsareprovidedin thefollowingsections.Letusfirst introducetheoverallapproach.Thefirststepisthecomputationofthe sizeandaspectratioofeachcelloftheunstructuredgrid(Fig.1a.).The secondstep consistsof aseriesofnumericalexperimentsallowingto estimate,foranycellgeometry,theexponent𝜔thatwouldminimize theerrorbetweentheequivalentconductivityestimatedusingapower averagewiththe𝜔exponentandtheequivalentconductivityestimated numerically.Sinceitisnotpossibletorunnumericalexperimentsfor allthecellsizesandgeometries,weselectsomerepresentativecell di-mensionsandconstructaresponsesurface(Fig.1b.).Thisisdoneonce atthebeginningoftheprocedure.Then,severalpointsarerandomly placed insideeachcelland,foreveryrealization,thepermeabilityis simulatedonthesepointsusingtheSpectralTurningBands(STB) ap-proach(Fig.1c.).Thepoweraveragingtechniqueisthenappliedusing thevalueof𝜔derivedfromtheresponsesurfacetoobtaintheequivalent permeabilityofthecell(Fig.1d.).
Themainstrengthofthisworkflowisthattheaveragingexponents
𝜔areestimatedonceforagivenproblemconstrainedbyapermeability distribution,avariogramandanunstructuredgrid.Afterthat,several realizationsofpermeabilityfieldscanbeobtainedefficientlyusing spec-tralturningbands.
2.1. Poweraveraging
Theproposedmethodisbasedonpoweraveraging(Deutschetal., 2002;Journeletal.,1986;Ababou,1996;Desbarats,1992)toestimate theequivalentpermeabilityKeqofacell:
𝐾𝑒𝑞= ( 1 𝑛 𝑛 ∑ 𝑖=1 𝑘𝜔 𝑖 )1 𝜔 , (1)
withnrepresentingthenumberofpointsinablock,ki the
permeabil-ityvalueatpointiand𝜔theaveragingexponent.Theexponent𝜔 be-longstotheinterval[−1,1],with𝜔=1representinganarithmeticmean,
𝜔 =-1aharmonic meanand lim
𝜔→0⋯isthegeometricmeangivenby
𝑒𝑥𝑝(1
𝑛
∑𝑛 𝑖=1𝑙𝑜𝑔(𝑘𝑖)
)
.Theinterestofthisapproachisthatthe permeabil-ityraisedattheexponent𝜔becomesanadditivevariable.However,the mainquestionisthentoestimatethevalueof𝜔foracertain configu-rationofthefinescalepermeability.Indeed,itisexpectedthatitmay dependonthetypeofspatialdistributionsandonthesizeandgeometry ofthecells.
Therefore,letusfirstsummarizesometheoreticaland experimen-talresultsfromtheliterature.Severalstudieshavegivenestimatesof thevalueof𝜔forsomespecificdistributionsofpermeability.Intwo di-mensions,whenthepermeabilitykanditsinverse(ℎ=1∕𝑘)havethe same probability distributions,Matheron (1966, 1967,1968) proves that theequivalentpermeability isthe geometricmeanifthe statis-ticsofthespatialdistributionsofkandhareinvariantbyrotation,i.e.
𝜔=0.Acasethatsatisfiesthepreviouslymentionedconditionsisa2D isotropicmediumwithalognormalpermeabilitydistribution.Inthree dimensions,Noetinger(1994)proposesanapproximationforthis spe-cificcase:𝜔=1∕3.Thevalidityofthisformulauptothefourthorder (smallperturbation)hasbeendemonstratedbyDagan(1993).However, DeWit(1995)andAbramovichandIndelman(1995)latershowed us-ingasixthorderdevelopmentthatinthreedimensionsitisnotstrictly validandwouldnecessitateacorrection.
Fig.1. Generalworkflowfordirectsimulationofpermeabilityonunstructuredgrids.Foreachunstructuredcell,a)wefindequivalentdimensions.b)Weusethese dimensionstoconstrainaresponsesurfaceof 𝜔 calibratedthroughupscalingexperiments.Then,c)wefillthecellswithseveralintegrationpointsandsimulated permeabilityonthem.Finally,d)weapplypoweraveragingusingthe𝜔 estimatedinstepb).
For anisotropic media, Ababou (1996); Desbarats (1992); Duquerroix et al. (1993); Kruel Romeu (1994); Noetinger and Haas (1996) suggest a simple analytical form. Let 𝜆 =𝐿𝑉∕𝐿𝐻 be
thegeometrical anisotropy dependingon the ratioof thevariogram rangesand𝜅 =𝑘𝑉∕𝑘𝐻 bethepermeabilityanisotropyratio.Changing variables in the Laplace Darcy equation allows to define a global anisotropyratiothrough𝛼 =√𝜅∕𝜆.Theproposedvalueof𝜔is:
𝜔(𝛼)= 𝑎𝑟𝑐𝑡𝑎𝑛(𝛼)
𝜋 −𝑎𝑟𝑐𝑡𝑎𝑛(𝛼) (2)
Massonnat(2009)introduces𝜔Hforthehorizontalpermeabilityand
𝜔Vfortheverticalpermeability:
𝜔𝐻(𝛼)= 𝜋 −𝑎𝑟𝑐𝑡𝑎𝑛𝑎𝑟𝑐𝑡𝑎𝑛(𝛼)(𝛼) (3)
and
𝜔𝑉 =−2𝜔𝐻+1 (4)
For isotropic random media, horizontal permeability is approxi-matelyequaltoverticalpermeabilitywith𝜔=1/3asdiscussedabove. Furthermore,toaccountforthefinitesizeofthecellsandnon-ergodic effects(theintegralscaleisnotnecessarilymuchsmallerthanthecell size),Massonnat(2009)introducedtwoadditionalcoefficients𝜖Hand
𝜖Vtoestimatetheglobalanisotropyratio:
𝛼 = 𝐿𝐿𝐻
𝑉
√
𝑘𝑉
𝑘𝐻𝜖𝐻𝜖𝑉 (5)
The parameter 𝜅 =𝑘𝑉∕𝑘𝐻 can be estimated from field measure-ments,butthisisrarelydone.Atableofvalueshasbeenproposedfor turbiditicfacies(WigniolleandMassonnat,2013).However,themain difficultyrevolvesaroundthedependencyof𝜔tothecoefficients𝜖H
and𝜖V,thatarehardlypossibletoestimatewithoutempiricalcurves.
Godoy et al.(2018) showednumerically howthe exponentis influ-encedbytheblocksize.Thepoweraveragewasrecentlyrevisitedby Liaoetal.(2020)andreferencestherein.Theconclusionfromthisbrief literaturereviewisthatnumericalexperimentsmustbeconductedto estimate𝜔,asthereisnosimpleanalyticalsolution.Inthefollowing section,wewillpresenthowthevaluesof𝜔aredefinedforall unstruc-turedgridcells,butbeforeexplainingthataspectweintroducehowwe computeanequivalentgeometryforthecellsoftheunstructuredgrids.
2.2. Characterizingtheunstructuredcells
Apreliminarystepistoestimatethegeometriesoftheunstructured cells.Indeed,𝜔dependsonthecell’ssizes.Twoseparatesets ofaxes
Fig.2.Nomenclatureofthetwosetsofaxesusedinthemethod. XYZ axes aredefinedbythegridboundingboxorientation.The Mmt axesfollowthe anisotropyaxesofthevariogram.Theunstructuredgridwillbeconsideredin
Mmt spacethroughprojectionsofthecellsontheaxes.
Fig.3. DefinitionofthehorizontalaspectratioH .ThedistanceΔM uisobtained
byprojectingthecell’sverticesontheM axisandtakingthelengthbetweenthe twoextremalpoints.Thesameprocessisappliedforthem axis.
aredefined(Fig.2).TheXYZspaceischaracterizedbytheorientation oftheunstructuredgrid,i.e.theorientationoftheboundingboxofthe grid.TheMmtspaceisdefinedfollowingtheaxisMcorrespondingto themaximumrangeofthevariogrammodelinthestratigraphicplane, theaxismcorrespondingtotheminimumrangeofthevariogrammodel inthestratigraphicplane(perpendiculartoM)andtheverticalaxist. Inthiswork,gridsare2.5D,whichbringsZ≡ t.Itisinthisdepositional space,Mmt,thatunstructuredcellsizesaredefined.
Todefinethecellsizes,ahorizontalaspectratioHalongtheMm
axesisdefined.Itiscomputedforeverycell:allverticesareprojected alongMandm(Fig.3).Cell’slengthsalongaxes,ΔMuandΔmu, are
definedbythedistancebetweenthefurthestprojectedverticesonthe consideredaxis.TheaspectratioHisobtainedbydividingtheprojected lengthalongMbytheonealongm:𝐻=Δ𝑀𝑢∕Δ𝑚𝑢.
Foreachunstructuredcell,anequivalentregularhexahedralcellis definedthroughasimplesystemofequations,sothatthevolumeofthe
regularcellVrisequaltothevolumeoftheunstructuredcellVuand
thatbothcellshavethesameaspectratioHandthicknessesΔtr and Δtu,respectively: ⎧ ⎪ ⎨ ⎪ ⎩ 𝑉𝑟=Δ𝑀𝑟× Δ𝑚𝑟× Δ𝑡𝑟=𝑉𝑢 𝐻=Δ𝑀𝑢∕Δ𝑚𝑢=Δ𝑀𝑟∕Δ𝑚𝑟 Δ𝑡𝑢=Δ𝑡𝑟 (6)
ΔMu,Δmu,ΔtuandVubeingknown,thedimensionsoftheequivalent
rectangularcellareobtainedforeverycelloftheunstructuredgrid: ⎧ ⎪ ⎪ ⎨ ⎪ ⎪ ⎩ Δ𝑀𝑟= √ 𝐻×𝑉𝑢 Δ𝑡𝑢 Δ𝑚𝑟= √ 𝑉𝑢 𝐻×Δ𝑡𝑢 Δ𝑡𝑟=Δ𝑡𝑢 (7)
Foranon-extrudedunstructuredgrid,thethirdequationofthesystem shouldbereplacedbyaverticalaspectratio𝑉 =⟨Δ𝑀,Δ𝑚⟩∕Δ𝑡. Describ-ingtheunstructuredcellsinMmtspacemeansthatthepermeability ten-sorwillbeconsideredinthisspace.Fortheflowsimulators,however, permeabilityhastobegiveninXYZspace.Anadditionalstepattheend oftheworkflowhastobeimplementedtorotatethepermeability ma-trixfromMmtspacetoXYZ.Forsimplicity,however,theremainderof thispaperconsidersthatMmtaxesarealignedtoXYZaxes,coherently withthechosenhorizontallyisotropicgridsandvariogramsusedforthe simulations.
2.3. Generatingtheresponsesurfaceofomega
Inthemethodpresentedhereafter,𝜔isestimatedforeachcellusing aresponsesurfacemethodology.Theexplanatoryvariablesofthe re-sponsesurfacearethedifferentparametershavinganinfluenceonthe valueof𝜔.Theycharacterizeeachcelloftheunstructuredgrid.
FollowingNoetingerandHaas(1996)andMassonnat(2009), exper-imentsshowthatthreemainparametersinfluence𝜔:variogramranges, proportionsoffacies,andcellgeometry.Inthispaper,thefocusisput oncellsizesandgeometryandweneglectforthemomentthepresence ofmultiplefaciestokeeptheresponsesurfacessimpleandtractable.
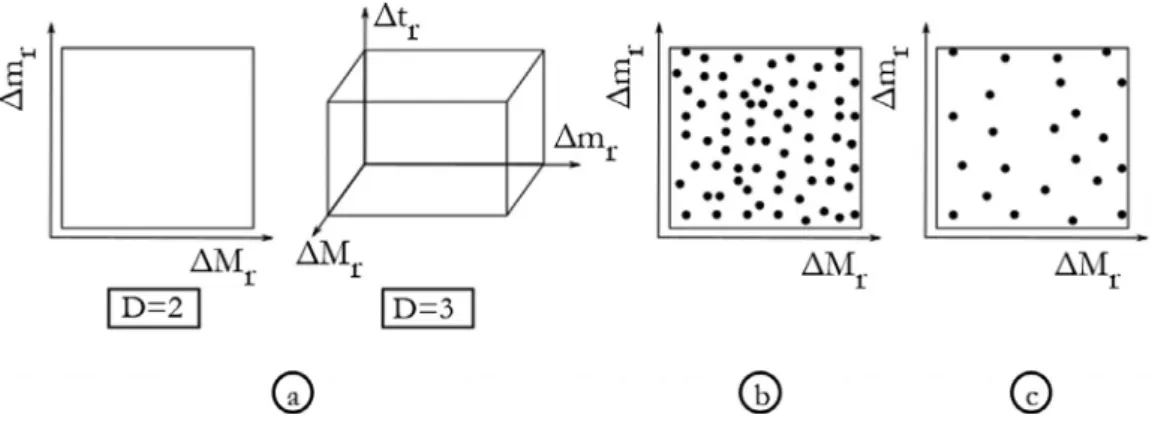
Toobtaintheresponsesurface,thefirststepconsistsinchoosingN
pointsintheparameterspacewheretheresponsehastobeevaluated. ThedimensionDoftheparameterspacedependsonthetypeof unstruc-turedgrid(Fig.4a.):
• 𝐷=2fora 2Dunstructuredgrid:takinginto accountcell’s sizes alongMandmaxes.
• 𝐷=2fora3Dunstructuredgridwithconstantcell’ssizeontaxis: takingintoaccountcell’ssizesalongMandm.
• 𝐷=2fora3Dhorizontallyisotropicgrid:takingintoaccountthe cell’ssizesalongtaxisandtheaverageofthecell’ssizesalongM
andmaxes.
• 𝐷=3fora 3Dunstructuredgrid:takinginto accountcell’s sizes alongM,mandtaxes.
ForeachoftheDdimensions,theminimumandmaximumofthe sizesoftheequivalentrectangularcells(ΔMr,ΔmrandΔtr)iscomputed
tolimittherangesofpossiblecellsizes.AsetofPpointsisthenrandomly anduniformlyplacedintheparameterspace.Eachpointcorresponds toaD-dimensionalvectoroftheform(Δ𝑀𝑟𝑖,Δ𝑚𝑗𝑟,Δ𝑡𝑘𝑟).Thenumberof points Pshouldbelarge enoughtocovertheentirespace(Fig.4b.). AmongthosePpoints,NarechosenusingtheWootton,Sergent, Phan-Tan-Luu (WSP)(Sergent,1989; Sergentet al.,1997a; 1997b) space-fillingdesigntechnique:fromasetofcandidatepoints,well-distributed experimentsareselectedfollowinganiterativeprocessdependingonan exclusionsphere(Santiagoetal.,2012)(Fig.4c.).
Avalueof𝜔isthenestimatedforeachoftheNpointsofthe param-eterspace:foreachpointhavingDcoordinatesrepresentingcellsizes, e.g.,Δ𝑀𝑟exp,Δ𝑚exp𝑟 andΔ𝑡exp𝑟 if𝐷=3,weuseafineregulargridaligned
Fig.4. a)Exampleofparameterspacefor 𝐷 =2and 𝐷 =3.b)Placing P randompointstocovertheentirespace.c)Choosing N experimentsuniformlyplacedin thespace.
Fig.5. Definitionofthestructuredgridonwhich we perform the experiments. We take into ac-countΔ𝑀 𝑟𝑠𝑚𝑎𝑙𝑙𝑒𝑠𝑡, Δ𝑚 𝑟𝑠𝑚𝑎𝑙𝑙𝑒𝑠𝑡, Δ𝑡 𝑠𝑚𝑎𝑙𝑙𝑒𝑠𝑡𝑟 and Δ𝑀 𝑏𝑖𝑔𝑔𝑒𝑠𝑡
𝑟 ,
Δ𝑚 𝑏𝑖𝑔𝑟 𝑔𝑒𝑠𝑡, Δ𝑡 𝑟𝑏𝑖𝑔𝑔𝑒𝑠𝑡, whicharethedimensionsofthe
smallestandbiggestunstructuredcells.
ontheMmtaxestosimulateseveralrealizations offine-scale perme-ability.Thesefinevaluesarethenupscaledwithapressuresolverusing upscalingratiocorrespondingtothecoordinatesofthepointtreated,i.e. wecreateupscaledblocksofthesizeoftheequivalenthexahedronof interest.Itgivesadistributionofreferenceupscaledpermeabilityvalues andwefindthe𝜔forwhichthepoweraveragingdistributionbestfits thereference.Thedetailsofthiscalibrationaregivenbellow.
Thefinegridfor thefine-scalesimulationsis definedonce, using Δ𝑀𝑟𝑠𝑚𝑎𝑙𝑙𝑒𝑠𝑡,Δ𝑚𝑟𝑠𝑚𝑎𝑙𝑙𝑒𝑠𝑡andΔ𝑡𝑟𝑠𝑚𝑎𝑙𝑙𝑒𝑠𝑡(respectivelyΔ𝑀𝑟𝑏𝑖𝑔𝑔𝑒𝑠𝑡,Δ𝑚𝑏𝑖𝑔𝑟 𝑔𝑒𝑠𝑡and Δ𝑡𝑏𝑖𝑔𝑟 𝑔𝑒𝑠𝑡) whicharethedimensionsof theequivalentrectangularcell corresponding tothe smallest(respectivelythebiggest)unstructured cellinthegrid(Fig.5top).Theideaistocreateafinegridcoveringat leasteightequivalentrectangularcells(2alongeachaxis):thebounding boxofthisstructuredgridmusthavedimensions𝐺𝑠
𝑀,𝐺𝑠𝑚and𝐺𝑠𝑡 such
that𝐺𝑠𝑀≥2Δ𝑀𝑟𝑏𝑖𝑔𝑔𝑒𝑠𝑡,𝐺𝑠𝑚≥2Δ𝑚𝑟𝑏𝑖𝑔𝑔𝑒𝑠𝑡and𝐺𝑡𝑠≥2Δ𝑡𝑏𝑖𝑔𝑟 𝑔𝑒𝑠𝑡.Thevoxels ofthisgridhavedimensions𝑐𝑠
𝑀,𝑐𝑠𝑚and𝑐𝑡𝑠suchthat𝑐𝑀𝑠 ≤Δ𝑀𝑟𝑠𝑚𝑎𝑙𝑙𝑒𝑠𝑡,
𝑐𝑠
𝑚≤Δ𝑚𝑠𝑚𝑎𝑙𝑟 𝑙𝑒𝑠𝑡and𝑐𝑡𝑠≤Δ𝑡𝑠𝑚𝑎𝑙𝑟 𝑙𝑒𝑠𝑡(Fig.5bottom).
Then,eachexperimentisperformedasfollows:
• Afine-scalepermeabilitykissimulatedonthelocalgridusing Spec-tral Turning Bands (Mantoglou andWilson, 1982; Emery et al.,
2016),withadistributionandvariogramcorrespondingtothefine scale(Fig.6a.).ThisstepisrepeatedRtimeswithadifferentseedfor randomnumbergeneration.Thepermeabilitydistributioncanbeof anytypeincludinglognormalandbeta.Thisdistributionmay char-acterizethevaluesofpermeabilityorthevaluesoflog-permeability. Inthelattercase,thefine-scalepermeabilityvaluesarenormalized usingapowerof10.Therestoftheexperimentisthenperformed onthisnormalizedproperty.
• Upscaling ratios in each direction are set using cell’s sizes cor-responding to the current experiment: 𝑈𝑀=Δ𝑀𝑟exp∕𝑐𝑀𝑠 , 𝑈𝑚= Δ𝑚exp𝑟 ∕𝑐𝑚𝑠 and𝑈𝑡=Δ𝑡exp𝑟 ∕𝑐𝑠𝑡.
• Rupscaledpermeabilities,calledreferencepermeabilities𝐾𝑀𝑟𝑒𝑓,𝐾𝑚𝑟𝑒𝑓
and𝐾𝑡𝑟𝑒𝑓,arecomputedusingapressuresolverupscalerwithUM, UmandUtasupscalingratios(Fig.6b.).ItgivesadistributionofKref
valuesineachdirection.Theupscaler(Jaquetetal.,0000)usesa localschemeandsolvesthesteadystateflowequationusingafinite volumetechnique.Itusesa TwoPointFluxgivenby Approxima-tion(TPFA)scheme.Twooptionsareavailable:thetypeof bound-aryconditionsaroundthedomain(itcaneitherbeof permeameter-typeorlinearly varyingheadstype, seedefinitionanddiscussion inRenardandDeMarsily(1997));andtheformulausedtocompute
Fig.6.a)Simulationofpermeabilityonthefinegrid.Thisstep isperformed R times.b)Numericalupscalingusingthe experi-mentcellsizestocalculatetheupscalingratio.Thisstepisalso performedR times.c)Optimizingtheglobalerrortothereference distributiontoobtainan𝜔 value.
Fig.7. Examplesof𝜔 calculation:optimizationofthe errorthroughaparabolafittingorgoldennumber al-gorithm.
thetransmissibilitybetweentwocells(itcaneitherbeanarithmetic, geometricorharmonicmean).Theresultinglinearsystemissolved usingaconjugategradientsolver.
• Thevaluesof 𝜔M, 𝜔m and𝜔tfor thisexperimentaredetermined
byminimizingtheglobalerrorbetweenKrefandthepoweraverage
Keq,i.e.minimizingthesumoftheerrorforthenupscaledblocks
(Fig.6c.):
𝑛
∑
𝑏𝑙𝑜𝑐𝑘=1
∥ log(𝐾𝑏𝑙𝑜𝑐𝑘𝑟𝑒𝑓 )−log(𝐾𝑏𝑙𝑜𝑐𝑘𝑒𝑞 )∥ (8)
Inpractice,determining𝜔isdoneusinganoptimizationmethodthat firsttriestofitaparabolaequationtotheerrorfunctionandfindits minimum,and,ifnotsuccessful,usesagoldensearchmethod.The errorfunctioncanhavevariousshapes,goingfromaparabolatoa simplemonotonouscurve(Fig.7).
Typically,thenumberRoffine-scalepermeabilityrealizationsmust be largeenough sothatthereference distributionKref hasa
statisti-callysufficientnumberofvaluestoidentifyarobustvaluefor𝜔.Inthe caseofthebiggest possibleequivalenthexahedron(ofsizeΔ𝑀𝑟𝑏𝑖𝑔𝑔𝑒𝑠𝑡, Δ𝑚𝑏𝑖𝑔𝑟 𝑔𝑒𝑠𝑡andΔ𝑡𝑟𝑏𝑖𝑔𝑔𝑒𝑠𝑡),weobtaineightupscaledvaluesforone realiza-tion:thefinegridhasbeendefinedsuchthateightbiggesthexahedra can beoverlaid onit. Itmeansthatin thiscase,𝜔will befitted on
𝑛=8𝑅values,whichisthelimittotakeintoaccountwhenchoosing thenumberR.Inparallel,inthecaseofasmallequivalenthexahedron, wewillobtainalargenumberofreferencevaluesforeachrealization, becausethefine gridisnot adaptedtothelocal problem.This large
numberwillalsobemultipliedbyR,whichgivestoomanyunnecessary valuestoestimate𝜔andbringsunnecessarycomputationalcost.Tofix thisproblem,ifthecellsizeforthetreatedexperimentissmallerthan Δ𝑀𝑟𝑏𝑖𝑔𝑔𝑒𝑠𝑡× Δ𝑚𝑏𝑖𝑔𝑟 𝑔𝑒𝑠𝑡× Δ𝑡𝑟𝑏𝑖𝑔𝑔𝑒𝑠𝑡,onlytheregionofthefinegridofsize 2Δ𝑀𝑟exp,2Δ𝑚exp𝑟 and2Δ𝑡exp𝑟 issimulatedandconsequentlyupscaled.By doingso,Krefdistributionalwayshas𝑛=8𝑅valuestofitthe𝜔valuefor
eachpointinparameterspace.
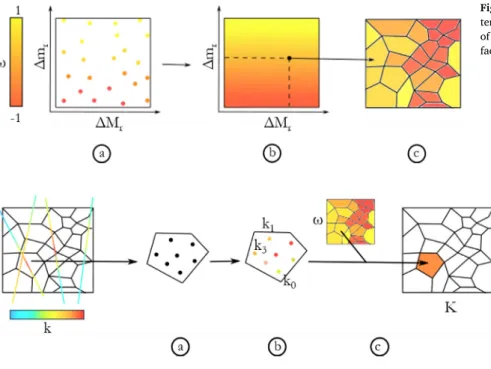
Onceallnumericalexperimentshavebeenperformed,an interpo-lationbetweenthepointsoftheparameterspaceisdoneusingkriging (Fig.8a.andb.).Thecorrelationfunctionforkrigingisassumed station-aryandwrittenasfollows:
𝑅(𝑥,𝑦)=𝑒𝑥𝑝 ( − 𝐷 ∑ 𝑗=1 (∣𝑥 𝑗−𝑦𝑗∣ 𝜃𝑗 )𝑝) (9)
with1<p≤2andDthenumberofdimensionsoftheresponse sur-face. Thehyper-parameters𝜃j,characterizing kriginganisotropy, are
estimated usingthemaximumlikelihoodmethod.However,toavoid artifactsonsurfacesofresponseinourwork,all𝜃jhavebeensettoone
in thenormalizedspace.Theresulting responsesurfaceallows deter-miningtheexponent𝜔foreachcelloftheunstructuredgrid(Fig.8c.). Asexplainedpreviously,ineachexperimenttheupscalingisdone intwoorthreedirectionsresultingindifferentKref (M,mort).Then,
twoor threevaluesfor𝜔 areobtained perexperiment,oneforeach directionD.Intheend,notonebuttwoorthreeresponsesurfacesof𝜔
areinterpolatedandthesameamountofomegapropertiesarepainted ontheunstructuredgrid.
Fig.8. a)Allexperimentresults,i.e.𝜔 ,areputinthe parame-terspace.b)Asimplekrigingallowsthegenerationofasurface ofresponseof𝜔 .c)Byprojectingcellsizesontheresponse sur-face,one 𝜔 isfoundforeverycelloftheunstructuredgrid.
Fig.9. a)Onebyone,eachunstructuredcellisfilled withpoints,thenumberofpointsdependingofthe vol-umeofthecell;b)UsingtheSpectralTurningBands, permeabilityisinterpolatedonthesepoints;c)Using the 𝜔 ofthetargetcell,thepermeabilityofthecell isobtainedusingpoweraveragingonthepoints (fol-lowedbyabacktransformfromK 𝜔toK ).
2.4. Directsimulationofpermeabilityontheunstructuredgrid
Thenext step is tosimulaterapidly values onintegration points usingSpectralTurningBands(STB)andaveragethemusingthe esti-mated𝜔. Theintegration points areobtainedwith afastgeneration of quasi-randomSobol’sequences usingthemethod of Antonovand Saleev(1979).
Turning bands were introduced in Matheron (1973) and further developedbymanyauthorsincludingMantoglouandWilson(1982), Tompson et al. (1989), Lantuéjoul (2002) and Emery and Lan-tuéjoul(2006).Thegeneralprincipleofthistechniqueistoreducea
Ddimensionssimulationproblemtoaone-dimensionalsimulation.The firststepistogenerateLlines𝜃isuchthattheirorientationisuniformly
distributedovertheunitsphere.A1Dsimulationismadealongeach lineusingtheone-dimensionalfieldcovariance𝐶𝜃𝑖 resultingfromthe D-dimensionalcovarianceC.Numerousmethodsforsimulatinga one-dimensionalrandomfieldknowingitscovariance𝐶𝜃𝑖 arefoundinthe literature,includingspectralapproachesusedin thiswork.Theycan beclassifiedintocontinuousspectralsimulationusingcosinefunctions (MantoglouandWilson,1982;ShinozukaandJan,1972);discrete spec-tralsimulationusingFastFourierTransform(Tompsonetal.,1989);and circulantembedding(Dietrich,1995).Fromthesesimulatedlines,the simulatedvalueatanypointcanbeobtainedbyprojectionand sum-mation.Anextensionof theSpectralTurning Bandsmethodto non-stationarymodelsisavailableinEmeryandArroyo(2017).
Oncethelineshavebeensimulatedandstored,thesimulationof eachunstructuredcellcanbemadeindependentlyfromtheothers.For eachcell,anumberofrandomlocationstoselectiscalculateddepending onthecell’svolume(Fig.9a.). Thefinepermeabilityvaluesat these locationsaresimulatedasexplainedabove(Fig.9b.).Theglobalcell valueis obtainedbyaveragingthepointvaluesusingthepowerlaw andthe𝜔estimatedforthatcell(Fig.9c.).Onceagain,notonebuttwo orthreepermeabilityvaluesareobtained,oneforeachdirectionM,m
andt.
3. Applications
Themethodologyhasbeentestedandshowedtoprovidecorrect re-sultsonsimplecaseswithknownanalyticalsolutions(perfectlylayered case,isotropiclog-normaldistribution,etc.).Wedonot discussthese resultshereforthesakeofbrevity.
Instead,wewillillustratethemethodwithasyntheticbutrealistic example(Fig.10).Weconsideraconfinedaquiferof2kmby2kmwith negligibleambientflow.Theexternalboundariesareassumedtobe im-permeable.Thethicknessoftheaquiferisvaryinglinearlyfrom40m intheeasternsideto4minthewesternside.Tenwellsarepositioned acrosstheaquifer.Twoofthemareinjectingwaterandsevenare pump-ing(Fig.15).Atracerisinjectedinthelastwellandrecoveredinthe pumpingwells.Thissetupwasdesignedtotesttheproposed geostatisti-calsimulationtechniqueonarealisticunstructuredgridandtocompare theresultsofthetracersimulationwithafinescalesimulation(standard approach).
Inthefollowingsections,wedescribefirstthesimulationofthe per-meabilityandthenthetracersimulations.
3.1. Permeabilitysimulation
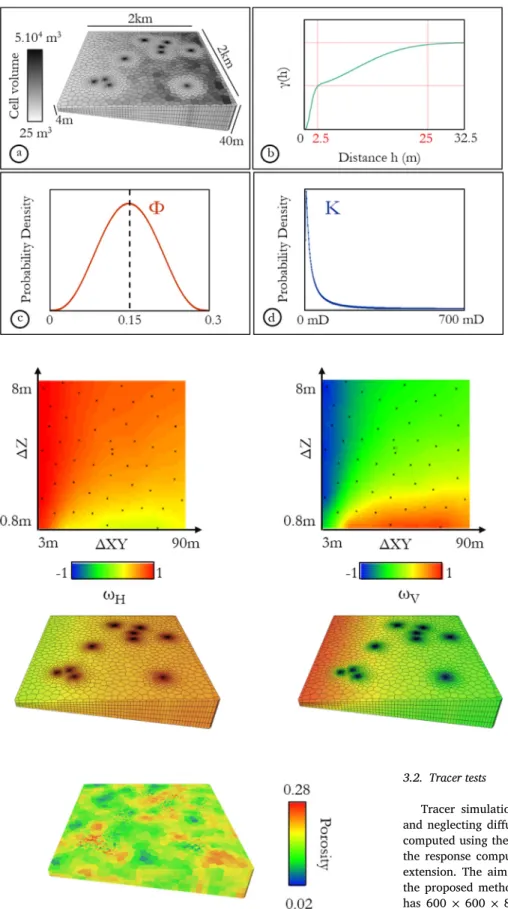
The3Dunstructuredgridforthiscaseiscomposedof18,250Voronoï cellswithavolumebetween25m3and50.103m3(Fig.10a.).Thegrid isrefinedaroundalltenwells.Thevariogramforbothporosityand per-meabilityhastwoGaussianstructuresofequalcontributionwithranges of25x25x2.5mand250x250x25mforcellsizesvaryingbetween3and 90mhorizontallyand0.8to8mvertically(Fig.10b.).Theporosityhas abetadistributionofmean0.15andstandarddeviation0.05(Fig.10c.) andthepermeabilitydistributionislognormalwithameanof100mD andastandarddeviationof300mD(Fig.10d.).Theboundary condi-tionsfortheupscalerintheexperimentsareofpermeameter-type,i.e. no-flowconditionsonthesides.
Duetothehorizontalisotropyoftheaspectratiooftheunstructured cells,theMmtaxespresentedinSection2.2aretakenalignedtoXYZ
axes.Forthesamereason,XaxisandYaxisbeingequivalent,onlytwo responsesurfacesarepresentedhereafter:oneforthehorizontal expo-nent𝜔𝐻=𝜔𝑋=𝜔𝑌 andonefortheverticalexponent𝜔V(Fig.11).The
twoaxesoftheresponsesurfacesrepresentthehorizontalcellsizesΔXY
(takenasthemeanofthecellsizesinXandY),andtheverticalcellsizes ΔZ.Asmoothvariationof𝜔isobserved,from0to1for𝜔Handfrom-1
to1for𝜔V.
Thelogofpermeabilityisassumedtobecorrelatedtopoint-support porositywithacorrelationcoefficientof0.8,which ispossibleusing SpectralTurningBands.Porosityontheunstructuredgridisobtained usingthearithmeticmean(Fig.12)andtwopermeability(HandV)are simulatedusingthepoweraveragingformulaand𝜔properties
gener-Fig.10. a)gridforthesyntheticcasewithcell vol-umesvaryingwithafactor2.103.b)doublestructure
variogramusedforthesimulationofboth petrophys-icalvariables.c) beta distributionof porosity,with m=0.15and 𝜎= 0.05.d)lognormaldistributionof per-meability,withm=100mDand𝜎= 300mD.
Fig.11. Surfacesofresponseofhorizontaland ver-ticalomegaandthecorrespondingpropertiesonthe unstructuredgrid.
Fig.12. Porosityfieldonthetoyexample.Log-permeabilitywillbecorrelated tothisfieldwithalinearcoefficientequalto0.8.
atedpreviously(Fig.13a.).AlthoughbothKHandKVpropertieslook similar,thecross-plotonFig.13b.showsthatKVisgloballyinferiorto
KH.Thesimilaritybetweentheseresultswillbediscussedinthe
conclu-sion.
3.2. Tracertests
Tracer simulations are performed accounting only for advection andneglectingdiffusionandphysical dispersion.Thetracerresponse computedusingtheunstructuredgridpresentedaboveiscomparedto theresponse computedusing afinestructured gridhavingthe same extension. Theaimis totest ifthepermeability fieldobtained with theproposed methodgivesacoherenttracer response.Thefinegrid has 600× 600×80 cells of horizontal size3.3 ×3.3m and verti-cal sizefrom 0.05mto0.5m. Using spectralturning bands(STB), it is possible toobtain thesamerandom fieldon thepoints placed in the structuredand unstructuredcells.Forthe structured one, a sin-gle pointis taken per cell, while the numberof points in each un-structured cells dependson its volume.Then,for unstructuredcells, thecellaveragevalueisobtainedusingarithmeticaveragefor poros-ityandpoweraveragingforpermeability(usingthe𝜔valuegivenby theresponsesurface). Twentyrealizationsof porosityandcorrelated
Fig.13. a)Verticalandhorizontalpermeabilityfieldsonthetoy example.b)Cross-plotK Hvs.K V, K VbeinggloballyinferiortoK H.
Fig.14. a)Simulationofporosityandpermeabilityon thefinestructuredgrid.b)Simulationofporosityand permeabilityonthecoarserunstructuredgrid.Details aremaintainedinthemostrefinedzones.
permeabilityaregeneratedonbothgrids,oneexampleisdisplayedon Fig.14.
Foreachrealization,apassivetracerisinjectedinawatersaturated reservoirhavingonewellinjectingthetracer,twowellsinjectingwater andsevenproductionwells(Fig.15).
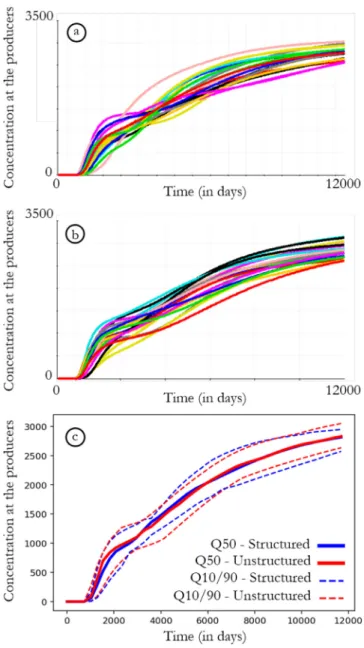
Thewaterproductionrateper wellis120m3/dayandthewater (and tracer) injection rateper well is 280 m3/day. We observethe concentration of tracer at the producers for the twenty realizations (Fig.16).
Forindividualrealizations,somelocaldeviationsareobserved be-tweenthetracercurvesofthefinestructuredreservoir(Fig.16a.)and theonesoftheunstructuredgrid(Fig.16b.).However,intermsof un-certaintyassessment,thesetoftracercurvesshowsaveryconsistent behaviorforbothgrids.Thecurvesforstructuredreservoirareslightly morescattered,whichiscoherentwiththebetterprecisionofferedby thisgrid.TheQ10,Q50andQ90quantilecurves(Fig.16c.)arealmost identical,withsomeminordifferencesonQ10.A3Dvisualizationofthe tracer’sconcentrationevolutionshowssimilarresultsonstructuredand
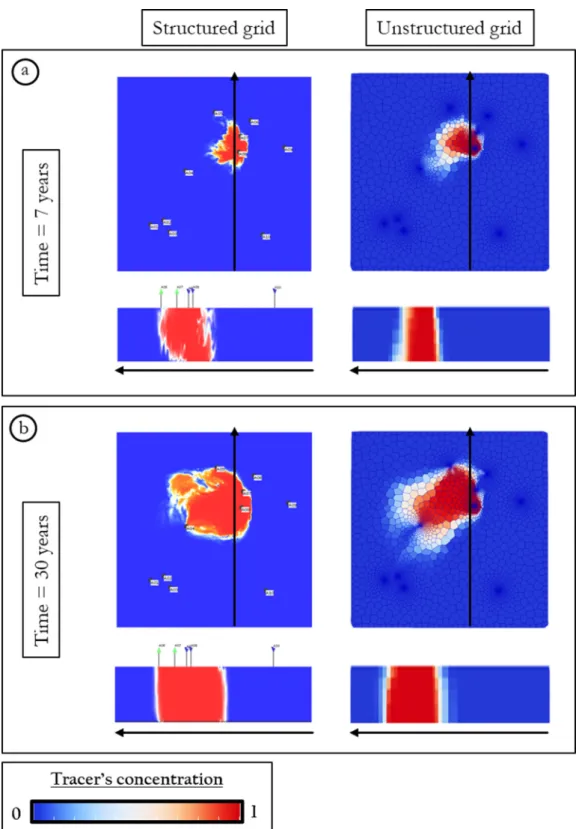
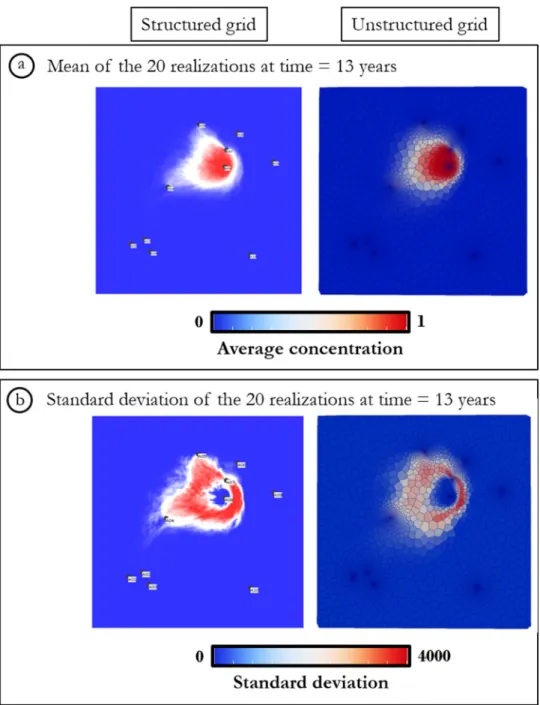
unstructuredgrids(Fig.17).Thissimilarityisfurtherdemonstratedby thevisualizationofthemeanofthetwentyrealizationsofthetracer’s concentrationevolutionattimethirteenyears,whereconcentration ten-denciesarewellrespected(Fig.18).Asexpectedforacoarsergrid,these resultsshowthattheunstructuredgriddoesnotpreservethedetailsof thepropagationvisibleonthestructuredgrid,horizontallyand verti-cally.Thishighlightstheimportanceofthechoiceofunstructuredgrid: theerrorsarelocalizedinareasbetweenwellswheretheunstructured gridistoocoarse.Overall,thiscomparisondemonstratestheconsistency oftheproposedmethodascomparedtotheresultsobtainedwitha struc-turedgrid.However,thecomputationaltimesareverydifferent.The tracertestsimulationsonthestructuredgridtakes112minutesin av-erage,whiletheyonlytake4minutesontheunstructuredgrid.
3.3. Computationtimes
Theuseofanunstructuredgrid,whileaccountingforthesupport effect,usuallyrequirestogeneratethegeostatisticalsimulationsona
Fig.15. Placementofthewellsintheunstructuredreservoir(paintedwitha realizationofporosityupscaledarithmeticallyfrompointssimulatedwithSTB). Therearesevenproducingwells,oneinjectingtracerandtwoinjectingwater. Theplacementofwellsisidenticalonthefinestructuredreservoirmodel.
Table1
Computationtimesfortwounstructuredgridsofdifferentsizes. T 0isthe
timetogeneratetheresponsesurfacesand𝜔 propertiesonthegrids, T 3is
thetimetosimulatepermeabilityonpointsusingSTBandperformpower averaging.
Small grid Large grid
nb cells 18,250 2,031,995
T0 22.4 min 35.4 min
T3 11.3 s 7.5 min
Total (N = 1) 22.4 min 43.0 min
Total (N = 10) 24.3 min 111.1 min
finestructuredgrid,andtoupscalenumericallythepermeability(e.g. Aavatsmarketal.,1998;Prévostetal.,1996).Foreveryrealization,one needstoredotheupscaling.Themethodologypresentedinthispaperis differentsinceitallowsdirectsimulationofthepermeabilityonthe un-structuredgrid,butitshowsimprovedefficiencyformulti-realizations. Inparticular,thecomputationtimefortheproposedmethodisnot proportionaltothenumberofcellsintheunstructuredgrid.Indeed,the responsesurfacecomputationisgenerallythemostcomputationally de-mandingstep,sothemainfactorinfluencingthetimeistherangeofcell sizescovered.Agridpresentingalargerrangeofcellsizeswillrequirea broaderresponsesurfaceandthereforemoreexperiments.Inaddition, thefinestructuredgridusedtoperformtheexperimentsisdefinedfrom theminimumandmaximumcellsizes.Ahigherdifferencebetweenthe twowillrequirealargerfinegrid,andhencelongerupscalingtimes.
Toevaluatethecomputationtime,differenttestshavebeenmade. Theprocedurehasbeenappliedontwogridswithdifferent characteris-tics:asmallexamplewith18,250cellsvaryingfrom3to90m horizon-tallyandfrom0.8to8mvertically,andalargerexamplewith2,031,995 cellsvaryingfrom6to2,653mhorizontallyandfrom3to60m verti-cally.
Inthefollowing,T0representsthetimerequiredtogeneratethe re-sponsesurfaces,𝑇3=𝑇1+𝑇2 representsthetimerequiredtosimulate thepermeabilityvalues onpointsusingSTB(T1)andperformpower averaging(T2).ThetotalsimulationtimeTis:
𝑇=𝑇0+𝑁𝑇3 (10)
withNthenumberofrealizations.
Fora responsesurfacewithfifty experiments,using twenty Intel coresonaLinuxmachine,thecomputationtimesforourJava implemen-tationareprovidedinTable1.Thistableshowsthatthetimerequired
Fig.16. Concentrationoftraceratproducerscurvesfortwentyrealizationson a)thefinestructuredreservoirandb)theunstructuredreservoir.Thecolours ofthecurvesfora)andb)representthesamerealizations.c)Quantilesofthe twentycurvesforstructured(inblue)andunstructured(inred)reservoirs.(For interpretationofthereferencestocolourinthisfigurelegend,thereaderis referredtothewebversionofthisarticle.)
toperformonerealizationonthelargegridisonlydoubledcompared tothetimerequiredforthesmallgrid,whilethenumberofcellshas beenmultipliedbyafactor100,showingtheefficiencyofthemethod forlargegrids.
Thecomputationtimeisalsocomparedwiththeclassicalmethod (finegridsimulationfollowedbyapressuresolverupscalingona reg-ulargrid).Theexperimentisconductedasfollows.Thefinegridisthe onepresentedinSection3.2,with600x600x80cells,thecoarsegridhas 60x60x5cells(theupscalingratiosare10x10x16).Thiscoarsegridhas 18,000regularcells,whichisclosetothe18,250cellsofthe unstruc-turedgrid.
Foronerealization,theproposedmethodtakesthreeminutesmore thantheclassicalone(Table2).However,assoonasoneneedsto per-formatleasttworealizations,theproposedmethodologyisfaster. More-over,theresponsesurfacesbeingsaved,itisalmostimmediateto sim-ulatepermeabilityfieldswhenparametershavenotchanged,i.e.when thedistribution,variogramandgridarethesame.
Fig.18. Visualizationofa)themeanandb) thestandarddeviationofthetwenty realiza-tionsoftracer’sconcentrationevolutionattime thirteenyearsin thestructuredand unstruc-turedreservoirs.
Table2
Computationtimesfortheclassicalmethod(finegridsimulationand pres-suresolverupscaling)andtheproposedmethod. T 0=timetogeneratethe
responsesurfaces,T 1isthetimeforSTBsimulationonpointsand T 2isthe
timeforeitherpoweraveragingontheunstructuredgridorpressuresolver upscalingforthestructuredgrid.
Proposed method Classical method
T0 22.4 min 0
T1 x 4.6 min
T2 x 15.1 min
𝑇 3 = 𝑇 1 + 𝑇 2 11.3s 19.8 min
Total (N = 1) 22.4 min 19.8 min
Total (N = 2) 22.8 min 39.5 min
Total (N = 10) 24.3 min 394.7 min
4. Discussionandconclusion
Thispaperproposesanewworkflowallowingtosimulatedirectly permeabilityfieldsonunstructuredgridsaccountingforsupporteffects. Themainoriginalityofthemethodisthatitallowsbypassingthe useofapotentiallymemoryandtimeconsumingfinegridandthe re-peateduseoflocalupscalingoneveryfine-scalerealization.On hori-zontallyisotropicsimplecases,theapplicationsareencouraging,with coarseflowsimulationsresultsclosetoafinegridtakenasreference. Theproposedmethodcanbeusedasanextensiontopreviousmethods thatallowedtogenerategeostatisticalsimulationofadditivevariables directlyonanunstructuredgrid(e.g.Zaytsevetal.,2015;Deutschetal., 2002;EmeryandArroyo,2017).
Themethodologyraisessomequestionsthataredetailedbelow.The obtainedresultsprovidesomecluestoanswerthesequestionsandopen interestingdiscussionitems.
The firstone relates to thenumerical upscaling method used in theexperimentsasa reference.Numericalupscaling ismore general thananalytical solutions,but itis strongly dependent on a few pa-rameters such asthe type of boundary conditions, or the choiceof theaveragingtechniqueusedfortransmissibilitycomputation.Three main boundary conditions are used in general: permeameter-type, linearly-varying head, andperiodic. In this paper, we presented re-sultsthatwereobtainedwithpermeameter-typeconditions.However, the same cases could be studied with linearly-varying head condi-tions.Toselectwhichmethodisthemostadequate,additionalresearch shouldbeconducted.Thegeneralmethodologywould,however,notbe affected.
Thesecondoneiswhetherthepoweraveragingformulaissufficient tocapturethedetailsofthespatialcomplexityofthepermeabilityfields. Previousnumericalexperiments(e.g.Renardetal.,2000)haveshown forexampleabroaddispersionoftheequivalentpermeabilitiesaround poweraverages.However,andrathersurprisingly,thenumerical exper-imentsconductedinthispapershowthatthemethodisrobustforthe studiedclassofrandomfields.Inaddition,onecannotethatduringthe optimizationstepwhenthevalueof𝜔isestimatedfromasetof refer-enceupscaledpermeabilities,westoretheremainingerror.Thismeans that,evenifwedidnotencounterthisproblemyet,themethodology includesasteptoidentifysituationsinwhichthemethodcouldhave difficulties.Inthesesituations,onecouldapplyaquantile-to-quantile correctionofpermeability,replacingthepermeabilityincellsflagged as“bad” bythecorrespondingreference,numericallyupscaled, perme-ability.
Theglobalconsistencyof theapproach can be checkedby using thesamesimulator at thefinest andcoarse scales.Itis well known fromRomeuandNoetinger(1995)thatanydiscretizedmodelcanyield stronglybiasedresultsassoonasthegridblocksizeisonthesame or-derastheunderlyingcorrelationscale.Thisbiasisduetotheunderlying numericalschemethatweightstheconductivitybetweengrid-blocksby meansofsomeaveragingformulathatmayleadtounderestimated val-uesfortheoveralleffectiveconductivity.Thatisobservedinthepopular caseoftheharmonicaveragingformulaemployedbymostpopular com-mercialsimulators.Inthecommonpractice,themeshoftheworking modelisbuiltbyengineersinordertogetthebestcompromise: ensur-ingaglobalaccuracyatthelowestnumericalcost.Closetothewells, veryfinegridblocksareemployed,whilecoarseblocksareusedfarfrom thewells.Thebiasissuemaythusoccurinthetransitionzonewithgrid blocksizesthat maybe compared tothesizeof theheterogeneities. Suchazonemaybeexpectedtobeofarathersmallsizecomparedto theoverallcharacteristicsizesofthemodel(distancesbetweenwells, sizeofthereservoir).SimilarissueswereaddressedbyPreux(2016)in ordertocheckthelocationatwhichupscalingshouldbecarriedout.A posterioriestimatorsmaybeusedtopostprocessthesolutionsinorder toindicatezonestoberefined,seeGratien,Jean-Marcetal.(2016)and referencestherein.Regardingtheboundaryconditionissue,itcanbe observedthattheeffectiveconductivityoflargeblocksbecomesrather independentontheboundaryconditions,seeColecchioetal.(2020)and referencestherein.
Finally,wewanttonotethatthecomparisonofthecomputingtime forthestandardupscalingapproachandtheproposedoneisprobably infavorofthestandardone.Indeed,thestandardapproachusedinthis paperassumesthattheupscalingisdoneonaregulargrid.Computations areeasierthaniftheyweredoneforanypossiblegeometry.However weshowedthattheproposedmethodbecomesfasterwhenthenumber ofrealizationsincreases,soweconsiderthattheallcostofdesigning theexperiment,runningthemandinterpolatingthe𝜔valuesisrapidly compensated.
DeclarationofCompetingInterest
Theauthorsdeclarethattheyhavenoknowncompetingfinancial interestsorpersonalrelationshipsthatcouldhaveappearedtoinfluence theworkreportedinthispaper.
Acknowledgments
The authorswould like tothank Total forfunding this research, andespeciallytheresearch projectReservoirEarthModelingforthe financialandtechnicalsupportthroughthehelpofJean-PaulRolando, Gérard Massonnat and David Ledez. We also want to thank the Association Nationale dela Rechercheet delaTechnologie (ANRT) whichfundedthisPhDundertheconventionCIFRE2017/0222.
References
Aavatsmark, I. , Barkve, T. , Bøe, O. , Mannseth, T. , 1998. Discretization on unstructured grids for inhomogeneous, anisotropic media. Part I: derivation of the methods. SIAM J. Sci. Comput. 19 (5), 1700–1716 .
Ababou, R. , 1996. Random porous media flow on large 3-d grids: numerics, performance, and application to homogenization. In: Environmental Studies. Springer, pp. 1–25 . Abramovich, B. , Indelman, P. , 1995. Effective permittivity of log-normal isotropic random
media. J. Phys. A 28, 693–700 .
Akhurst, M. , Hannis, S.D. , Quinn, M.F. , Shi, J.-Q. , Koenen, M. , Delprat-Jannaud, F. , Lecomte, J.-C. , Bossie-Codreanu, D. , Nagy, S. , Klimkowski, Ł . , et al. , 2015. Risk assess- ment-led characterisation of the Sitechar UK North Sea site for the geological storage of CO 2 . Oil Gas Sci. Technol. 70 (4), 567–586 .
Antonov, I. , Saleev, V. , 1979. An economic method of computing lp 𝜏-sequences. USSR
Comput. Math. Math.Phys. 19 (1), 252–256 .
Bertoncello, A. , Caers, J. , Biver, P. , Caumon, G. , 2008. Geostatistics on stratigraphic grids. In: Ortiz, J., Emery, X. (Eds.), Eighth Geostatistical Geostatistics Congress. Gecamin, Ltd, Santiago, Chile, Chile, pp. 677–686 .
Blessent, D., Therrien, R., Gable, C.W., 2011. Large-scale numerical simulation of ground- water flow and solute transport in discretely-fractured crystalline bedrock. Adv. Water Resour. 34 (12), 1539–1552. https://doi.org/10.1016/j.advwatres.2011.09.008 . Boschan, A. , Noetinger, B. , 2012. Scale dependence of effective hydraulic conductivity
distributions in 3d heterogeneous media: a numerical study. Transp. Porous Media 94 (1), 101–121 .
Caumon, G. , Grosse, O. , Mallet, J.-L. , 2005. High Resolution Geostatistics on Coarse Un- structured Flow Grids. In: Leuangthong, O., Deutsch, C.V. (Eds.), Geostatistics Banff 2004. Springer Netherlands, Dordrecht, pp. 703–712 .
Chilès, J.-P. , Delfiner, P. , 2012. Geostatistics: Modeling Spatial Uncertainty, 2nd edition. Wiley .
Colecchio, I. , Boschan, A. , Otero, A.D. , Noetinger, B. , 2020. On the multiscale characteri- zation of effective hydraulic conductivity in random heterogeneous media: a historical survey and some new perspectives.. Adv. Water Resour. 103594 .
Dagan, G. , 1993. Higher-order correction of effective permeability of heterogeneous isotropic formations of lognormal conductivity distribution. Transp. Porous Media 12, 279–290 .
De Marsily, G. , Delay, F. , Teles, M. , Schafmeister, T. , 1998. Some current methods to represent the heterogeneity of natural media in hydrogeology. Hydrogeol. J. 6 (1), 115–130 .
De Wit, A. , 1995. Correlation structure dependence of the effective permeability of het- erogeneous porous media. Phys. Fluids 7 (11), 2553–2562 .
Desbarats, A.J. , 1992. Spatial averaging of hydraulic conductivity in three-dimensional heterogeneous porous media. Math. Geol. 24 (3), 249–267 .
Deutsch, C. , Journel, A.G. , 1992. GSLIB - Geostatistical Software Library and User’s Guide. Oxford University Press .
Deutsch, C. , Tran, T.T. , Pyrcz, M.J. , 2002. Geostatistical assignment of reservoir properties on unstructured grids. In: Proceedings of the SPE Annual Technical conference and exhibition, San Antonio, Texas .
Dietrich, C.R. , 1995. A simple and efficient space domain implementation of the turning bands method. Water Resour. Res. 31 (1), 147–156 .
Duquerroix, J. , Lemouzy, P. , Noetinger, B. , Romeu, R. , et al. , 1993. Influence of the per- meability anisotropy ratio on large-scale properties of heterogeneous reservoirs. In: SPE Annual Technical Conference and Exhibition .
Durlofsky, L. , 2005. Upscaling and gridding of fine scale geological models for flow sim- ulation. In: Proceedings of the 8th Internationnal Forum on Reservoir Simulation, Stresa, Italy .
Emery, X. , Arroyo, D. , 2017. On a continuous spectral algorithm for simulating non-sta- tionary gaussian random fields. Stoch. Environ. Res. Risk. Assess .
Emery, X. , Arroyo, D. , Porcu, E. , 2016. An improved spectral turning-bands algorithm for simulating stationary vector gaussian random fields. Stoch. Environ. Res. Risk Assess. 30 (7), 1863–1873 .
Emery, X. , Lantuéjoul, C. , 2006. Tbsim: a computer program for conditional simulation of three-dimensional gaussian random fields via the turning bands method. Comput. Geosci. 32 (10), 1615–1628 .
Emery, X. , Ortiz, J. , 2011. Two approaches to direct block-support conditional co-simula- tion. Comput. Geosci. 37 (8), 1015–1025 .
Godoy, V.A. , Zuquette, L.V. , Gómez-Hernández, J.J. , 2018. Stochastic analysis of three-di- mensional hydraulic conductivity upscaling in a heterogeneous tropical soil. Comput. Geotech. 100, 174–187 .
Goovaerts, P. , 1997. Geostatistics for Natural Resources Evaluation. Oxford University Press .
GratienJean-Marc, Ricois, Olivier, Yousef, Soleiman, 2016. Reservoir simulator runtime enhancement based on a posteriori error estimation techniques. Oil Gas Sci. Technol. 71 (5), 59. https://doi.org/10.2516/ogst/2016009 .
Jaquet, O., Namar, R., Siegel, P., Unpublished reference. UPSCALER : Guide Technique & D’utilisation, Memorandum Upscaler 009/004. Report. In2Earth.
Journel, A.G. , Deutsch, C. , Desbarats, A.J. , 1986. Power averaging for block effective per- meability. In: Proceedings of the SPE California Regional Meeting, Oakland, Califor- nia .
Khan, S.A. , Dawson, A.G. , 2004. Method of Upscaling Permeability for Unstructured Grids . US Patent 6,826,520 B1
Kruel Romeu, R. , 1994. Ecoulement en Milieux Heterogenes: Prise de Moyenne de Perme- abilite en Regimes Permanent et Transitoire. Paris 6 Ph.D. thesis .
Lantuéjoul, C. , 2002. Geostatistical Simulation: Models and Algorithms. Springer-Verlag Berlin Heidelberg .
Liao, Q. , Lei, G. , Wei, Z. , Zhang, D. , Patil, S. , 2020. Efficient analytical upscaling method for elliptic equations in three-dimensional heterogeneous anisotropic media. J. Hy- drol. 124560 .
Manchuk, J.G. , Mlacnik, M.J. , Deutsch, C. , 2012. Upscaling permeability to unstructured grids using the multipoint flux approximation. Pet. Geosci. 18 (2), 239–248 . Mantoglou, A. , Wilson, J.L. , 1982. The turning bands method for simulation of ran-
dom fields using line generation by a spectral method. Water Ressour. Res. 18 (5), 1379–1394 .
Massonnat, G. , 2009. Method, Program and Computer System for Scaling the Modelling Data for a Hydrocarbon Deposit . Patent WO 034253A1
Matheron, G. , 1966. Structure et composition des perméabilités. Revue de l’Institut Français du Pétrole XXI, 564–580 .
Matheron, G. , 1967. Composition des perméabilités en milieu poreux hétérogène, méthode de schwydler et règles de pondération. Revue de l’Institut Français du Pétrole XXII (3), 443–466 .
Matheron, G. , 1968. Composition des perméabilités en milieu poreux hétérogène: critique de la règle de pondération géométrique. Revue de l’Institut Français du Pétrole XXIII, 201–218 .
Matheron, G. , 1973. The intrisic random functions and their applications. Adv. Appl. Probab. 5, 439–468 .
Matheron, G. , 1976. Forecasting block grade distributions: the transfer functions. In: Guarascio, M., David, M., Huijbregts, C. (Eds.), Advanced Geostatistics in the Min- ing Industry. Springer Netherlands, pp. 237–251 .
Merland, R. , Caumon, G. , Lévy, B. , Collon-Drouaillet, P. , 2014. Voronoi grids conforming to 3d structural features. Comput. Geosci. 18, 373–383 .
Michael, K. , Golab, A. , Shulakova, V. , Ennis-King, J. , Allison, G. , Sharma, S. , Aiken, T. , 2010. Geological storage of CO 2 in saline aquifers a review of the experience from
existing storage operations. Int. J. Greenh. Gas Control 4, 659–667 .
Mlacnik, M.J. , Harrer, A.W. , Heinemann, Z.E. , 2003. Locally streamline-pressure-poten- tial-based pebi grids. In: Proceedings of the SPE Reservoir Symposium, Houston, Texas .
Noetinger, B. , 1994. The effective permeability of a heterogeneous porous medium. Transp. Porous Media 15, 99–127 .
N œ tinger, B. , Gautier, Y. , 1998. Use of the fourier-laplace transform and of diagrammatical methods to interpret pumping tests in heterogeneous reservoirs. Adv. Water Resour. 21 (7), 581–590 .
Noetinger, B. , Haas, A. , 1996. Permeability averaging for well tests in 3d stochastic reser- voir models. In: Proceedings of the SPE Annual Technical Conference and Exhibition, Denver, Colorado .
Noetinger, B. , Zargar, G. , 2004. Multiscale description and upscaling of fluid flow in sub- surface reservoirs. Oil Gas Sci. Technol. 59 (2), 119–139 .
Preux, C. , 2016. About the use of quality indicators to reduce information loss when per- forming upscaling. Oil Gas Sci. Technol. 71 (1), 7 .
Prévost, M. , Lepage, F. , Durlofsky, L. , Mallet, J.-L. , 1996. Unstructured 3d gridding and upscaling for coarse modelling of geometrically complex reservoirs. Pet. Geosci. 11, 339–345 .
Quinlivan, P. , Batten, A. , Wibowo, M. , Hinchliffe, S. , Rahayu, D. , Doria, I. , Yahmadi, A. , Tondang, H.Y.T. , 2015. Assessing geothermal tariffs in the face of uncertainty, a prob- abilistic approach. In: Proceedings World Geothermal Congress .
Renard, P. , De Marsily, G. , 1997. Calculating equivalent permeability: a review. Adv. Wa- ter Resour. 20 (5–6), 253–278 .
Renard, P. , Le Loc’h, G. , Ledoux, E. , de Marsily, G. , Mackay, R. , 2000. A fast algorithm for the estimation of the equivalent hydraulic conductivity of heterogeneous media. Water Resour. Res. 36 (12), 3567–3580 .
Romeu, R. , Noetinger, B. , 1995. Calculation of internodal transmissivities in finite dif- ference models of flow in heterogeneous porous media. Water Resour. Res. 31 (4), 943–959 .
Santiago, J. , Claeys-Bruno, M. , Sergent, M. , 2012. Construction of space-filling designs using wsp algorithm for high dimensional spaces. Chemometr. Intell. Lab. Syst. 113, 26–31 .
Sergent, M. , 1989. Contribution de la Méthodologie de la Recherche Expérimentale à L’élaboration de Matrices Uniformes: Application Aux Effets de Solvants et de Sub- stituants. Aix-Marseille 3 Ph.D. thesis .
Sergent, M. , Phan Tan Luu, R. , Elguero, J. , 1997. Statistical analysis of solvent scales. Part 1.. An. Quim. 93 (2), 71–75 .
Sergent, M. , Phan Tan Luu, R. , Elguero, J. , 1997. Statistical analysis of solvent scales. Part 2.. An. Quim. 93 (5), 295–300 .
Shinozuka, M. , Jan, C.M. , 1972. Digital simulation of random processes and its applica- tions. J. Sound Vib. 25 (1), 111–128 .
Tidwell, V.C. , Wilson, J.L. , 1997. Laboratory method for investigating permeability up- scaling. Water Resour. Res. 33 (7), 1607–1616 .
Tompson, A.F.B. , Ababou, R. , Gehlar, L.W. , 1989. Implementation of the three-dimen- sional turning bands random field generator. Water Resour. Res. 25 (10), 2227–2243 . Vogt, C. , Mottaghy, D. , Wolf, A. , Rath, V. , Pechnig, R. , Clauser, C. , 2010. Reducing tem- perature uncertainties by stochastic geothermal reservoir modelling. Geophys. J. Int. 181 (1), 321–333 .
Wigniolle, E. , Massonnat, G. , 2013. Use of well test interpretations to constrain the small scale petrophysical anisotropy ( k v / k h ). In: Proceedings of the SPE Reservoir Charac-
terisation and Simulation Conference and Exhibition, Abu Dhabi, UAE .
Witter, J.B., Trainor-Guitton, W.J., Siler, D.L., 2019. Uncertainty and risk evaluation dur- ing the exploration stage of geothermal development: a review. Geothermics 78, 233– 242. https://doi.org/10.1016/j.geothermics.2018.12.011 .
Zaytsev, V. , Biver, P. , Wackernagel, H. , Allard, D. , 2015. Change-of-support models on irregular grids for geostatistical simulation. Math. Geosci. .