C
ONGESTIONP
RICING INC
ITIES OF THED
EVELOPINGW
ORLD:
E
XPLORINGP
ROSPECTS INM
EXICOC
ITYby
Anjali Mahendra
Bachelor of Architecture School of Planning and Architecture, 2000
New Delhi, India
Submitted to the Department of Urban Studies and Planning in partial fulfillment of the requirements for the degrees of
Master in City Planning
and
Master of Science in Transportation
at the
MASSACHUSETTS INSTITUTE OF TECHNOLOGY
September 2004
© 2004 Anjali Mahendra. All rights reserved.
The author hereby grants MIT permission to reproduce and distribute publicly paper and electronic copies of this thesis in whole or in parts
Signature of Author______________________________________________________ Department of Urban Studies and Planning
August 9, 2004
Certified by ___________________________________________________________________
Professor Ralph Gakenheimer Departments of Urban Studies and Planning
and Civil and Environmental Engineering Thesis Supervisor
Certified by ___________________________________________________________________
Professor Joseph M. Sussman Departments of Civil and Environmental
Engineering and Engineering Systems Thesis Supervisor
Accepted by ___________________________________________________________________
Professor Dennis Frenchman Chair, MCP Committee Department of Urban Studies and Planning
Accepted by ___________________________________________________________________
Professor Nigel Wilson Chair, Master of Science in Transportation Committee Department of Civil and Environmental Engineering
C
ONGESTIONP
RICING INC
ITIES OF THED
EVELOPINGW
ORLD:
E
XPLORINGP
ROSPECTS INM
EXICOC
ITYby
Anjali Mahendra
Submitted to the Department of Urban Studies and Planning on August 9, 2004 in partial fulfillment of the requirements for the degrees of
Master in City Planning and Master of Science in Transportation Abstract
Car ownership in many large cities of the developing world is rapidly increasing with rising incomes, and is accompanied by traffic gridlock, travel delays, and deteriorating air quality. The policy of congestion pricing to manage growing travel demand has been implemented with varying degrees of success in some developed countries. This thesis explores the applicability of congestion pricing in the Mexico City Metropolitan Area (MCMA).
Current transportation policies in the MCMA were studied, with an analysis of the factors causing increased demand for private transport. Of the many forms in which congestion pricing may be implemented, we focused on the possibility of a central city congestion zone similar to that recently implemented in the city of London, providing arguments for its viability, and preliminary analyses regarding potential impacts. We studied how household level car ownership had
changed for different income groups in Mexico City between 1994 and 2000, in order to make empirical estimates of the distributional impacts that a congestion pricing scheme might have. Our results show that the location of low income car owning households far from the central areas, and their limited access to efficient public transport creates negative consequences for them. Yet, significant overall reductions in traffic and travel time savings are possible with a congestion charge. Lower income people can benefit if the revenues from congestion pricing are used to improve their accessibility to public transport.
Congestion pricing is difficult to implement, especially given the decentralization and overlapping levels of political authority in the MCMA. As part of this research, we surveyed various Mexican government officials, academics, researchers, and practitioners interested in improving transportation and air quality in the region. The survey shows that there is hesitation in considering any such policy in the MCMA without prior improvements in public transport.
In light of these findings, we have outlined the complicated issues surrounding implementation, with recommendations for a course of action given the current policy agenda. The findings presented in this thesis can be used by decision makers in Mexico City to design a set of policies for improving mobility, with a better understanding of the issues surrounding congestion pricing.
Thesis Advisor: Ralph Gakenheimer
Title: Professor of Urban Studies and Planning and CEE
Thesis Advisor: Joseph M. Sussman
Title: Professor of Engineering Systems and CEE
Thesis Reader: Anna Hardman
Acknowledgements
I am grateful to Professor Ralph Gakenheimer, my research advisor, for his guidance as this thesis evolved, and his encouragement at every step in my treatment of this
controversial subject. I have learned a lot from him, and my work as a transportation planner will continue to draw from these lessons. I also thank Professor Joe Sussman, my advisor in the Center for Transportation and Logistics, for his invaluable advice and critiques on this work. They both helped sharpen my understanding of transportation issues in the Mexican context through their experience. Thanks also to Anna Hardman, who has been much more than an academic guide in my time at MIT, always willing to discuss my work and career goals. I am deeply indebted to these members of my thesis committee. In addition, I thank Fred Salvucci for his inspiration, and helpful insights on this topic.
I sincerely thank Professor Mario Molina and Dr. Luisa Molina for their interest and support, without which this work would not have been possible. This research was completed as part of the Integrated Program on Urban, Regional and Global Air
Pollution, and was supported by funding from the Mexican Metropolitan Environmental Commission (CAM) and the Mario Molina Center for Energy and the Environment. Many thanks to Alvaro for the numerous Spanish-English translations he did for me, for his company, and for our engaging discussions. I also specially thank Julia, for her time and patience in helping me analyze my data. I thank all my colleagues and friends on the Mexico City project - Samudra, Rebecca, Ali, Janine, Bernardo, Travis, and Cristian. It has been a great experience working with you.
I am grateful to all the people I met while I was in Mexico City for their time,
information and ideas, and have listed them in Appendix 4 of this thesis. I specially thank Rebecca Dodder and Sergio Sanchez, for being wonderful hosts.
At MIT, I appreciate the contribution of all my teachers, friends, and classmates, for making the last three years an enriching experience. Most of all, thank you Bala, for being patient with my numerous questions, and for always being there.
Table of Contents
A
BSTRACT………2
A
CKNOWLEDGEMENTS……….……3
T
ABLE OFC
ONTENTS……….……...4
L
IST OFF
IGURES………...6
L
IST OFT
ABLES………8
CHAPTER 1. INTRODUCTION... 8 1.1. CONTEXT... 8 1.2. MOTIVATION... 101.3. ASSUMPTIONS AND HYPOTHESIS... 13
1.4. THESIS OBJECTIVES... 15
1.5. RESEARCH QUESTIONS... 15
1.6. CONTRIBUTION TO EXISTING LITERATURE... 16
CHAPTER 2. BACKGROUND INFORMATION ON MEXICO CITY... 18
2.1. POPULATION GROWTH TREND... 19
2.2. URBAN STRUCTURE AND EXPANSION... 21
2.3. ECONOMIC CHARACTERISTICS AND INCOME DISTRIBUTION... 22
2.4. TRANSPORTATION INFRASTRUCTURE AND TRAVEL DEMAND IN THE MCMA ... 25
2.5. TRANSPORT EMISSIONS IN MEXICO CITY... 28
2.6. INSTITUTIONAL STRUCTURE... 30
2.7. CURRENT PROJECTS AND POLICIES ON THE URBAN TRANSPORT AGENDA... 30
2.7.1. Public transport ... 31
2.7.2. Private transport... 34
CHAPTER 3. CONGESTION PRICING – ECONOMIC, POLITICAL, AND EQUITY ISSUES ... 39
3.1. GROWING MOTORIZATION IN THE DEVELOPING WORLD... 39
3.2. CONGESTION PRICING: ECONOMIC ARGUMENTS... 40
3.3. POLITICS ASSOCIATED WITH CONGESTION PRICING... 43
3.4. DIFFERENT METHODS OF PRICING CONGESTION... 48
3.5. BRIEF OVERVIEW OF CONGESTION PRICING SCHEMES AROUND THE WORLD... 51
3.5.1. London Congestion Charging Scheme... 51
3.5.2. The Area Licensing Scheme and Electronic Road Pricing in Singapore . 52 3.5.3. Congestion Pricing Initiatives in Asia, Europe, and North America ... 54
3.6. EQUITY ISSUES WITH CONGESTION PRICING... 57
CHAPTER 4. APPLYING THE IDEA TO MEXICO CITY... 60
4.1. PRIVATE TRAVEL IN THE MCMA ... 60
4.2. HISTORY OF TRANSPORT POLICIES CAUSING GROWTH IN AUTOMOBILE TRIPS... 61
4.3. DESCRIPTION OF PRIOR REGULATORY ATTEMPTS... 66
4.4. ARGUMENTS FOR CONSIDERING CONGESTION PRICING IN THE MCMA ... 68
4.6. POSSIBILITIES FOR TYPE OF SCHEME AND AREA OF OPERATION... 79
4.7. RECOMMENDATIONS FOR A PHASED STRATEGY... 85
4.8. COMMUNICATING WITH STAKEHOLDERS: SURVEY RESULTS... 87
4.8.1. Purpose of the Survey ... 87
4.8.2. Detailed Results: Questions and Responses ... 89
4.8.3. Summary of Survey Results... 99
CHAPTER 5. ANALYSIS OF POTENTIAL IMPACTS... 103
5.1. OBJECTIVE OF ANALYSIS... 103
5.2. ASSUMPTIONS... 106
5.3. RESULTS OF REGRESSION ANALYSES... 108
5.4. RESULTS OF SENSITIVITY ANALYSES... 113
CHAPTER 6. CONCLUSIONS ... 124
6.1. ESTIMATED IMPACTS... 126
6.2. RECOMMENDATIONS FOR FURTHER RESEARCH... 127
6.3. CONCERNS REGARDING IMPLEMENTATION... 129
6.4. FINAL WORD... 132
APPENDIX 1: SURVEY QUESTIONNAIRE ... 133
APPENDIX 2: COMBINED REGRESSION RESULTS... 134
APPENDIX 3: LIST OF CORE, INNER, OUTER DELEGACIONES ... 135
APPENDIX 4: PEOPLE INTERVIEWED ... 136
List of Figures
Chapter 2
FIGURE 2-1 MAP OF THE MCMA AS PART OF A MEGALOPOLIS... 19
FIGURE 2-2 GROWTH OF THE MEXICO CITY METROPOLITAN AREA... 20
FIGURE 2-3 PERCENTAGE SHARE OF POPULATION IN EM AND DF ... 21
FIGURE 2-4 LAND USE IN THE MCMA (1997)... 23
FIGURE 2-5 SPATIAL SEGREGATION BY INCOME IN THE MCMA (1990)... 24
FIGURE 2-6 MOTORIZATION INDEX IN THE MCMA ... 26
FIGURE 2-7 MOTORIZED MODE SHARE OF PASSENGER TRIPS IN THE MCMA (1995) .. 27
FIGURE 2-8 EVOLUTION OF MODE SHARES IN THE DF (%)... 28
Chapter 3 FIGURE 3-1 GROWTH IN MOTORIZATION WITH INCOME... 39
FIGURE 3-2 CONGESTED TRAFFIC CONDITIONS: ‘HITTING THE WALL’ ... 40
FIGURE 3-3 THE ECONOMICS OF CONGESTION PRICING... 41
FIGURE 3-4 CONVERGENCE OF PUBLIC AND PROFESSIONAL VIEWS... 46
Chapter 4 FIGURE 4-1 AVERAGE DAILY PASSENGERS IN MEXICO CITY, PER MODE... 68
FIGURE 4-2 INCOME AND CAR OWNERSHIP IN THE MCMA IN 1994... 73
FIGURE 4-3 INCOME AND CAR OWNERSHIP IN THE MCMA IN 2000... 73
FIGURE 4-4 PERCENTAGE OF CAR OWNING HOUSEHOLDS BY INCOME GROUP... 76
FIGURE 4-5 CHANGE IN NO. OF HOUSEHOLDS AND CAR OWNERSHIP, 1994-2000 ... 76
FIGURE 4-6 SAMPLE OF TRIP DESTINATIONS DURING MORNING PEAK HOUR, 1994 .... 79
FIGURE 4-7 ROAD NETWORK IN THE FEDERAL DISTRICT... 80
FIGURE 4-8 PROPOSED CONGESTION CHARGING OPTIONS... 82
FIGURE 4-9 FAMILIARITY WITH THE ISSUE OF CONGESTION PRICING... 90
FIGURE 4-10 PERCEPTION OF TRAFFIC CONGESTION IN MEXICO CITY... 90
FIGURE 4-11 RANKING OF IMPACTS OF TRAFFIC CONGESTION IN THE MCMA ... 91
FIGURE 4-12 WORST IMPACTS OF TRAFFIC CONGESTION IN MEXICO CITY... 91
FIGURE 4-13 RANKING OF POLICIES TO MANAGE CONGESTION IN THE MCMA... 92
FIGURE 4-14 RANKING OF POLICIES CONSIDERED BEST FOR RAISING REVENUES... 93
FIGURE 4-15 RANKING OF POLICIES MOST ACCEPTABLE TO PEOPLE... 94
FIGURE 4-16 POLICIES MOST ACCEPTABLE FOR MANAGING CONGESTION... 94
FIGURE 4-17 RANKING OF STAKEHOLDERS MOST RESISTANT TO PRICING... 95
FIGURE 4-18 HIGHEST PREFERENCE FOR USE OF CONGESTION PRICING REVENUES... 96
FIGURE 4-19 HIGHEST PREFERENCE FOR IMPLEMENTING AGENCY………....96
FIGURE 4-20 RANKING OF MAIN CHALLENGES TO IMPLEMENTING PRICING……….….97
FIGURE 4-21 MOST IMPORTANT AND LEAST IMPORTANT CHALLENGES... 98
Chapter 5 FIGURE 5-1 MAP OF FEDERAL DISTRICT SHOWING CENTRAL AREAS... 104
List of Tables
Chapter 2
TABLE 2-1 SUMMARY OF TRANSPORT INFRASTRUCTURE IN THE MCMA ... 26
TABLE 2-2 MOBILE SOURCES EMISSIONS INVENTORY 1997 (TONS/YEAR) ... 31
TABLE 2-3 TRANSPORTATION INVESTMENT BUDGET FOR 2002………...38
TABLE 2-4 SUMMARY OF CURRENT TRANSPORTATION POLICIES……….39
Chapter 3 TABLE 3-1 CONGESTION PRICING: WINNERS AND LOSERS………..………61
Chapter 4 TABLE 4-1 NUMBER OF HOUSEHOLDS AND CAR OWNERSHIP - 1994, 2000……...…..77
Chapter 5 TABLE 5-1 DISTRITOS WITH HIGHEST TRIP ATTRACTIONS IN THE DF………...………107
TABLE 5-2 REGRESSION RESULTS FOR TRIPS TO CENTRAL DISTRITOS... 109
TABLE 5-3 REGRESSION RESULTS FOR TRIPS TO CENTRAL DISTRITOS FROM ORIGINS IN THE EM AND THE DF... 110
TABLE 5-4 REGRESSION RESULTS FOR TRIPS TO CENTRAL DISTRITOS FROM ORIGINS WITH HIGH PUBLIC TRANSPORT DEMAND... 111
TABLE 5-5 PERCENTAGE REDUCTION IN CAR AND TAXI TRAFFIC TO CENTRAL DISTRITOS, BASED ON DIFFERENT DEMAND ELASTICITY AND CONGESTION CHARGE VALUES... 116
TABLE 5-6 DISTRIBUTION OF HOUSEHOLDS AND CAR OWNERSHIP IN THE MCMA BY INCOME (2001) ... 117
TABLE 5-7 DAILY REVENUES AND PERCENTAGE REDUCTION IN PRIVATE TRIPS, BY INCOME GROUP AND CONGESTION CHARGE VALUE... 118
TABLE 5-8 SENSITIVITY ANALYSIS: DEMAND WITH RESPECT TO TIME SAVINGS... 119
TABLE 5-9 EMISSIONS PER VEHICLE IN GRAMS/YEAR/VEHICLE... 120
TABLE 5-10 EMISSIONS INVENTORY FROM MOBILE SOURCES IN THE MCMA, 1998 (METRIC TONS PER YEAR) ... 120
TABLE 5-11 SAVINGS IN EMISSIONS BASED ON DEMAND ELASTICITY FOR A 60 PESOS CONGESTION CHARGE... 121
CHAPTER 1.
INTRODUCTION
1.1. Context
Traffic congestion is a growing problem affecting people’s quality of life in large cities, in both developed and developing countries. With growing car ownership, increasing distances traveled, and rapidly saturating road capacity, cities are faced with the dilemma of either imposing controls on automobiles, or suffering congestion.
The economic costs of congestion, in terms of time and money, are undoubtedly high. In its latest report on urban mobility in the United States, researchers at the Texas
Transportation Institute used indicators from the 75 largest cities in the country to reveal alarming statistics. They estimated that congestion costs were $69.5 billion in the US in 2001, in terms of 5.7 billion gallons of wasted fuel and 3.5 billion hours of lost
productivity resulting from traffic jams1. This cost had risen about 7% from the previous
year. This is in spite of the fact that the United States has the second highest number of kilometers of major roads per 1000 persons in the world, next only to Canada.
In most large cities of the developing world, transportation demand and consequent road congestion have already reached a critical stage. Yet, governments are stalling in
implementing policy and planning measures to deal with this situation for a number of reasons. One is the lack of sufficient resources to make large infrastructure investments. Another reason is the lack of institutional coordination between agencies responsible for financing, managing and operating urban transport. A third reason is the lack of political will to control private vehicle demand, given that it is usually the most influential socio-economic groups that have the largest share of private travel demand, and the highest trip rate. Thus, automobile ownership is growing with increasing population size and rising income in developing cities, leading to unsustainable motorization rates.
Other problems in cities of the developing world, such as increasing green house gas concentrations, air pollution, high accident rates, and urban sprawl, are all fallouts of rapid motorization, with more serious long-term consequences. These cities are highly populated, financially constrained, dense and heavily built-up. Therefore, the answer lies not only in building more infrastructure but rather, in managing existing road space with more discretion. Along with making investments to manage the existing transport infrastructure and services, improved methods of financing these investments must also be deployed. Congestion pricing is a policy of charging private vehicle users for the costs of transportation facilities provided to them at public expense, and it therefore helps raise revenues for a city.
The concept of congestion charging or value pricing involves rationing road space through pricing in order to distribute travel demand more evenly across available road capacity and times of day. It involves charging a fee for the use of existing infrastructure such that those who value it more end up paying more. The revenues raised can be spent to improve public transport in the city to accommodate those car drivers who change their travel behavior and move to public transport as their mode of choice, or drive at a
different time of day. Singapore was the first country in the world to attempt this policy through its Area Licensing Scheme (ALS). Established in 1975, the scheme allowed private vehicles to enter congested downtown areas in the morning peak hours only if they had purchased an Area License. Changes have constantly been made to the system and since 1998 it has been upgraded to an Electronic Road Pricing (ERP) system to allow differential charging according to time of day, traffic speed, location, and evolving traffic conditions. For this, all private vehicles are fitted with transponders that allow automatic deduction of charges when the vehicle is driven under gantries installed on certain
corridors.
Congestion pricing is a part of policies under the broader category of road pricing. There are other examples where urban road pricing has been implemented, such as in the cities of Norway and the United Kingdom. The Norwegian cities did not charge people for congestion to start with. The fee began as a toll to finance the roads, but is now being
modified to become a congestion charge. After close to three decades, the only other large city to successfully implement this policy is London. Congestion charging was implemented in London in February 2003, as an area-based scheme.
As part of the scheme, vehicles entering Central London during the major part of the day on weekdays are charged a flat daily fee. When they enter the congestion charging zone, their license plate numbers are read by cameras installed along the zone periphery and within it. Vehicle owners have to register their vehicles in advance and have to pay the charge when they enter the zone.
Many large cities of the world that suffer the same congestion problems as London have been keenly observing the London experience. The scheme is currently regarded as a success in reducing road congestion and travel delays. Moreover, the mayor who implemented it, Ken Livingstone, has recently been re-elected for another term (June 2004), confirming the political viability of the scheme. The first year of implementation of the London Congestion Charging Scheme has provided a valuable opportunity to observe the short-term impacts of the policy. However, since England is a high-income country, the lessons from London are not directly applicable to a developing country case. It is worth investigating congestion pricing for cities in the developing world because the policy presents an opportunity for those developing countries with adequate financial and staff resources to "leapfrog" forward in solving their urban transport problems.
1.2. Motivation
Mobility is a key determinant of personal and economic productivity in congested urban areas. Worldwide travel demand has grown to the extent that the global transportation sector is likely to become the leading user of non-renewable energy resources over the next 20 years. Statistics show that between now and 2020, the energy demand for transport is expected to grow by approximately 1.5 per cent per year in industrialized
countries and by 3.6 per cent per year in developing countries, with fossil fuels dominating 90% of the increase in demand2.
Correlations between per capita GDP and the amount of passenger car travel per capita, drawn by the International Energy Agency for many countries show that growth in transport demand is closely linked with income growth. Especially, in the developing world, demand for private motorized transport expressed by say, per capita kilometers traveled, is steadily on the rise, with few, if any, signs of saturation.
This current pattern of travel behavior is inducing rapid suburbanization in less developed regions of the world, following the paradigm of industrialized countries. It has resulted in the emergence of huge but less dense cities, or cities that have developed multiple business districts that have grown parallel to, and in some cases, much faster than the central business districts. Increasing investments are made to service this growth with more road links. The lower density and more polycentric character of cities is leading to higher trip rates for passengers and freight over longer trip distances. Many cities in the developing world are struggling with the rapid growth in their fleets of motorized vehicles, and exactly how they address the rising demand for urban transport will have important implications for their environment and economic productivity. In this regard, congestion pricing can be a promising method to achieve many goals that the largest developing cities, such as Mexico City, are trying to fulfill with respect to sustainable urban transport. Chief among these are:
1) Stabilizing motorization rate – Different travel demand management measures such as creating exclusive public transport and pedestrian zones, increasing car ownership costs, and pricing, usually help restrict use of private automobiles. These measures can in the longer term also facilitate reduction in the rate of growth of motorization. Pricing has equity impacts that can be balanced by investing he revenues generated from higher income drivers to improve public transport for lower income users.
2) Reducing pollution from emissions - Increasing motorization is directly responsible for rising pollution in these cities. Deterring people from using private vehicles through imposing charges can reduce emissions and greenhouse gas concentrations too. This is especially important for Mexico City, which is amongst the most polluted cities in the world. Of course, as will be explained later in this thesis, the difficulty lies in convincing people of the benefits of not driving a car they have already bought. 3) Encouraging use of public transport – It is widely recognized that a high quality
public transport system is essential to improve mobility, and to limit the growth rate of private vehicles by providing an efficient travel alternative. Large cities in the developing world are increasingly investing in state-of-the-art public transport systems such as Mass Rapid Transit (MRT) or Bus Rapid Transit (BRT) that will require maintenance and capacity enhancements in the future. Congestion pricing can provide funds for implementing and expanding public transport projects. A new BRT project has recently been approved in Mexico City too.
4) Increasing financial capability to invest in public infrastructure – Many
developing cities are aided by international donors or multilateral agencies in building public infrastructure. But in cities where economic growth is high, privatization is changing the trend. Public-private partnerships are commonly established for financing infrastructure projects. Congestion pricing operations can easily fall into this type of partnership, while increasing the city’s revenues to invest in public infrastructure.
The problem remains that there are no precedents of the policy in the developing world. The long-standing case of Singapore and the recent experience of London demonstrate that these area-based pricing schemes have had successful results. However, we can only draw some guidance from these cases. Most of the problems that will be encountered in implementing a congestion charge in the Mexico City Metropolitan Area (MCMA) have not risen prominently in the cases of London or Singapore.
First of all, the lack of efficient public transport, especially buses, would create negative distributive impacts of a pricing policy for lower and middle-income households in the
MCMA. Another prominent issue is that of an equity imbalance, whereby a poor person would spend a higher proportion of income on a congestion charge than a rich person, to access the same area of a city. The equity consideration also arises because it is lower income people who usually live farther away from centers of employment and they are forced to own and drive cars in the absence of other alternatives. Other conditions likely to impact implementation are conflicting institutional bodies, jurisdictions and decision-making powers. In developing countries, the resources to execute a pricing scheme would usually compete with other causes deemed to be more important, especially with regards to political will. In addition, enforcement of traffic laws and registration procedures is limited.
A unique factor in Mexico City is the significance of privately operated fixed route public minibuses or colectivos that enjoy high passenger mode share. There is a feeling of insecurity associated with using these minibuses, the Metro and even taxis. In addition, the current policy agenda favors construction of additional road space to accommodate the ever-increasing private vehicles and colectivos in the city. All these factors spin off many issues regarding public acceptability of congestion pricing.
The aim of this research, therefore, is to explore congestion pricing as part of a set of policy actions to manage the growth and use of private automobiles in Mexico City. Congestion and travel delays affect quality of life in a significant way; similarly air quality has important impacts on public health and mortality. Recognizing that 70% of the air pollution in Mexico City is attributed to the transportation sector, this research may offer an approach to deal with the two externalities of congestion and pollution with one idea.
1.3. Assumptions and Hypothesis
We begin with the assumption that theoretically, congestion pricing is a viable idea to reduce the negative impacts of high motorization, travel delays and congested traffic. This is based on the notion that road space is yet another infrastructure resource provided to people at public cost that tends to be over-exploited. Given that people pay for their
water supply, electricity supply, and telecommunications services according to the level of use, it is possible that user fees can similarly be charged for better traffic conditions and road use. If such a policy is in place, people will pay only for the number of times they drive into the most congested parts of a city. If they choose to do this everyday, they will pay more. If they choose to car pool or use public transport for the days that they don’t necessarily need the flexibility, then they will pay less.
In case of congestion pricing, people pay for intangible entities such as a smoother flow of traffic and reduced travel delays, as against utilities such as water, electricity, gas, and so on, where they pay for something tangible. However, because people are accustomed to using road space for free, road pricing is bound to generate opposition. If a charge for driving into downtown areas had been in force from the start, first of all, traffic
conditions would not be as critical as they are today, and second, less utility would be attached to car ownership than at present. Since a free resource is always over-exploited, traffic congestion has been intensifying in recent years, and drastic measures to manage it have now become imperative. This is especially true in fast-growing cities of the
developing world where motorization rates are growing rapidly due to the perception that owning a car is a status symbol, and due to the poor condition of public transport.
In this study, we address issues of how applicable congestion pricing is in the developing world, keeping the distributive impacts in mind. The hypothesis is that despite the problems described above, the policy is bound to result in many benefits and can be implemented in an equitable way. This would be as part of a package of complementary measures that is politically feasible. What is equitable is subjective of course. But if it can be proved from a particular policy design that the net economic benefit to the city, especially from the point of view of the disadvantaged sections of the population, is higher than the monetary, time, and inconvenience costs incurred, then we would be closer to a social optimum. A carefully considered value for the congestion charge, redistribution methods, user-friendly charge payment technology and public transport improvements must be adopted as part of the package of measures, for a more acceptable implementation of congestion pricing in developing world cities.
The MIT Integrated Program on Urban, Global and Regional Air Pollution has supported research on road-based public transport (Darido) and transit-oriented development (Gilat) in Mexico City. This thesis deals with a package of measures centered on congestion pricing that complements these research themes.
1.4. Thesis Objectives
1) To explore the applicability of congestion pricing in Mexico City by understanding potential benefits and constraints to implementation
2) To determine how congestion pricing might fit within the current transport policy and planning agenda, with an emphasis on building public and political acceptability. 3) To recommend complementary measures, institutional responsibilities, and use of
revenue.
4) To assess possible distributive impacts by anticipating the responses of stakeholders.
1.5. Research Questions
Since there is no successful example of congestion pricing in developing economies, the questions addressed in this thesis provide a model of inquiry for other cities. These include:
What are the factors causing high motorization and traffic congestion in Mexico City? Would congestion pricing be effective in improving urban transport? If so, what are the potential impacts?
What are the different ways in which congestion pricing has been implemented around the world, and what would be the best option for Mexico City?
How can congestion pricing be packaged with other policy measures to address equity issues, implementation challenges, and to produce long term benefits? How can the various stakeholder interests be addressed to make the policy publicly
and politically acceptable in Mexico City?
We begin by studying the city’s urban context and key transportation indicators, described in the next section.
1.6. Contribution to Existing Literature
There is a large body of existing literature on the theoretical principles of congestion pricing, its various distributive impacts, and the challenges to implementing it. However, practical applications are very few, with the key examples being in Singapore, London, the Norwegian cities of Oslo, Trondheim and Bergen, and the examples of High
Occupancy Toll (HOT) lanes in San Diego and other North American cities. These schemes differ considerably in their features and implementation. The characteristics of the urban areas they are applied in are also very varied. All these cases are based in cities of the developed world and most have been well documented, permitting analysis. This is especially true of the London scheme that is under observation by many other cities, such as Paris, in order to draw lessons for designing a similar policy.
However, there is no literature that draws lessons from these schemes, seeks to alter and adapt them, and ascertain the feasibility of implementation in the more challenging context of a mega-city in the developing world. The Mexico City Metropolitan Area (MCMA), for example, has a population size that is about triple that of London, far fewer local government resources, and more critical levels of traffic congestion due to mixed modes on the streets. It has high traffic-related air pollution and a vehicle fleet that is growing at a very fast rate. The institutional responsibilities are conflicting, and the current policy agenda favors the construction of more road space to fulfill growing demand, rather than policies to manage excessive travel demand. It has been proved time and again and in varied contexts that adding more road space only leads to temporary and short-term congestion relief. In the medium and longer term, it induces more demand and fuels the need for more infrastructure. This is clearly not a sustainable path to
follow; yet the high visibility of large infrastructure projects usually makes them lucrative for building a political agenda or campaign.
Given these challenges, this thesis shows how congestion pricing might be applicable in the context of Mexico City, with recommendations for how it might be implemented. Urban areas in the developing world may be most in need of policies such as congestion pricing, yet the policy has not been explored in these contexts due to the implementation
challenges anticipated, and the lack of data. This thesis will contribute to the current body of literature in that it will provide the first such study for the MCMA, and will be among the few studies done for a developing city. Many large developing cities have the same social, economic, institutional and political environment as Mexico City, thus this research can provide some direction for similar work in other contexts.
CHAPTER 2.
BACKGROUND INFORMATION ON
MEXICO CITY
With a population of 18 million today, the Mexico City Metropolitan Area (MCMA) is considered one of the four largest urbanized areas in the world, along with New York City, Tokyo and Mumbai. Unofficial estimates of the MCMA’s total population size are even higher, going up to 20 million.
The city exemplifies the “leviathan”3 nature of many metropolises in the developing
world that are growing rapidly in size, scale and population. The term ”mega-city” has also been used to describe the Mexico City Metropolitan Area that includes within it the 16 delegaciones (or boroughs) of the Federal District (Distrito Federal - DF), 37
urbanized municipalities from the surrounding State of Mexico (Estado de Mexico - EM) and one municipality from the state of Hidalgo. The DF and the EM both have their own self-governing administrations. The Federal District (DF) is considered the central business district of the region and contains the historic city center, the Zocalo.
The MCMA is situated in a valley, at an average altitude of 2,286 meters, covering an area of 4,945 square kilometers. The high altitude causes incomplete fuel combustion, while the surrounding mountains impede air circulation to make the MCMA an air
pollution sink of sorts. The complete sphere of influence of the MCMA, referred to as the “megalopolis” by Molina and Molina (2002), extends to about 75 to 150 kilometers from the city center, and includes six cities that surround the MCMA in a ring known as the corona or crown. These include Puebla, Tlaxcala, Cuernavaca, Cuautla, Pachuca, and Toluca, all of which are metropolises themselves. The megalopolis has a total population of 25 million, representing over a quarter of the nation’s population4.
3 Davis (1994). “Urban Leviathan” is the term used by Davis to describe Mexico City in the Twentieth
Century.
FIGURE 2-1 Map of the MCMA as part of a Megalopolis
Mexico City Metropolitan Area Boundary State Boundaries
Source: General Census of Population and Housing, INEGI, 1990
2.1. Population Growth Trend
Population in the MCMA is growing at an average rate of 2% per annum and is estimated to reach 26 million by the year 2020. The DF has a 30% share of the entire urbanized area of the MCMA5 but had only 0.3% average annual growth in population between
1995 and 2000. In contrast, the suburban municipalities in the State of Mexico (EM) had about 3% population growth in the same period with most of the growth occurring in the municipalities north and east of the DF6. This high suburban growth is expected to
5 Molina and Molina (2002) 6 COMETRAVI (1999)
increase further in the years to come. While the absolute population of the MCMA has almost tripled between 1970 and 2000, increasing by 195%, the urban land area increased even more, by 226%7. Thus, more people are spread over a larger urban area today.
Figure 2-2 shows the growth of the metropolitan area as it has expanded into the surrounding State of Mexico.
FIGURE 2-2 Growth of the Mexico City Metropolitan Area
Source: Presentation by Mario Molina, Seventh Workshop on Air Quality in Mexico City, 2004
The DF and EM had roughly an equal share of the population in 1995, but by the year 2020, the EM’s share is expected to be double that of the DF. The city center lost
population at the rate of about 2% between 1970 and 19958. The rapid decentralization in
the MCMA since 1960 is evident from the loss of population from the central city to the suburban areas in the State of Mexico as shown in Figure 2-3.
7 Villegas-Lopez (2001) 8 Molina and Molina (2002)
FIGURE 2-3 Percentage Share of Population in EM and DF e s h age ce n P e 0% 10% 20% 30% 40% 50% 60% 70% 80% 90% 100% 1960 1970 1980 1990 2000 Years r t ar DF: Outer DF: Inner DF: Core EM (Suburbs) DF: Total
Source: www.demographia.com - last accessed on April 13, 2004
For a list of delegaciones constituting the Core, Inner and Outer DF areas, please see Appendix 3.
In spite of this trend, overall average urban density in the MCMA is high at about 12,000 persons per square kilometer. The figure for urban density actually ranges between 5,000 and 15,000 persons per square kilometer, usually reducing with increasing distance from the Zocalo (central city). However, some high-density areas are located much further away9 because roughly 62% of the MCMA’s population is concentrated in irregular
low-income settlements typically occurring on the city’s outskirts.
2.2. Urban Structure and Expansion
Decentralization of Mexico City has been exacerbated in recent years due to many causes10. One reason is the environmental degradation, particularly atmospheric pollution
and traffic congestion in the central areas that has increasingly caused more affluent people to leave the city since the 1980s. Increasing commercial activity accompanied by high land-values is another cause of decline in the central city’s population. Land values
9 Gakenheimer and Zegras (2003)
10Connolly (1999). Apparently, decentralizing Mexico City, Guadalajara and Monterrey figured as a goal
in national urban development programs since the first one, in 1976, with the reasoning that the as more people moved out of the core of the city, it would result in more sustainable urban development with improved environmental conditions.
have become very high in these parts and are on average about three times higher than those in the periphery of the DF. Lower income households, especially, cannot remain in the central city and are forced to build or rent homes in peripheral areas. After an
earthquake devastated Mexico City in 1985, the DF government undertook major reconstruction of the central areas, providing subsidized low-income housing, still these areas are losing population.
The government’s General Program of Urban Development for the DF11 describes four
distinct zones of current and future development. These include the city center at the core, which will remain the center of business and services. The first ring around it represents a high quality and well-serviced zone, the second ring represents a transitional zone, and the third ring is essentially a rural zone fast becoming part of the metropolitan area. At present, population of the MCMA is concentrated within the first ring, but the outer rings are experiencing the fastest growth.
2.3. Economic Characteristics and Income Distribution
The per capita Gross Domestic Product (GDP) of the MCMA has been estimated at about US $7,500 in the year 2000, contributing a third of the GDP of the country12. The
MCMA’s economy shifted significantly from manufacturing activities to services. In 1998, 76% of the MCMA’s GDP was generated in the services sector, followed by 19% generated through industrial activities. 70% of the labor force of the MCMA works in the services sector, 29% in manufacturing and 1% in the agricultural sector13. Income
disparities in the metropolitan area are high, and the wealthiest 10% of the population possesses 20 times more income than the poorest 10%25. The DF has GDP per capita
about three times higher than the EM26. In comparison with Mexico’s average GDP per
capita, the DF’s GDP per capita was 135% higher, while the EM’s was 19% lower15.
11 SEDUVI (1996) 12 Villegas-Lopez (2000) 13 Ibid.
25 Gakenheimer and Zegras (2003)
26 INEGI (2000) - GDP per capita in the DF in the year 2000 was US$$13,089, nearly three times higher
than that in the EM (US$$4,542)
In addition, there is a clear pattern of socio-economic spatial segregation, with lower income households occupying mostly the north and east parts of the city and wealthier households occupying the south and southwest parts. Major shopping centers are located in the west and southwest parts, while the relatively poorer north and east parts in the State of Mexico have a higher concentration of industries, less access to services and more traditional commercial areas16. Figure 2-4 shows this pattern.
FIGURE 2-4 Land Use in the MCMA (1997)
COMMERCE AND SERVICES INFRASTRUCTURE RESIDENTIAL INDUSTRY MIXED PRESERVATION
RECREATION AND OPEN SPACES
Approximate DF-EM Boundary Low-income neighborhoods Middle-class and high-income suburbs
Central Business District
“Protected ecological areas” of the southern DF
Source: Adapted from Gilat (2002)
On comparing Figure 2-5 below with the land use map in the previous figure, it is evident that most lower income households are located to the northwest and northeast of the CBD, in parts of the State of Mexico where the industries are concentrated.
FIGURE 2-5 Spatial Segregation by Income in the MCMA (1990)17
Central Business District Income Level High Medium to High Medium Low to medium Low Very Low No Information 17 Schteingart (2000)
2.4. Transportation Infrastructure and Travel Demand in the MCMA
In Mexico City, there is a stark disparity in the availability of transportation infrastructure between the Federal District (DF) and the State of Mexico (EM). This is true for public and private transport. For example, available data show that the annual investment in transportation infrastructure in the DF was US $1000 million in 1992, while it was only US $80 million in the EM18. Table 2-1 below clearly illustrates this disparity.TABLE 2-1 Summary of Transport Infrastructure in the MCMA
Type DF EM
Primary Roads 198.4 kms (67% controlled access) 352 kms highways
“Ejes” Viales 310 kms 47 kms (Vías Rápidas Urbanas)
Principal Roads 552.5 kms 616 kms
Secondary Roads 8,000 kms (8150) 250
Metro 178 kms -
Trolleybus 377 kms -
Light Rail 26 kms (13 in each direction) - Parking spaces 126,257 spaces (10,000 lots) N/A
Parking Meters 1,535
Bus shelters 2,347 290
Contra-flow lanes 13 lanes/186 km
Source: COMETRAVI (1999)19
Since the DF area contains the historic city center with old, narrow streets, it suffers from chronic traffic congestion. In addition, infrastructure investments have not kept pace with the growth in population and the more rapid growth in motorized vehicles. The DF and the EM have their own vehicle registration databases, both of which are poorly
maintained, so estimates of the total vehicle fleet vary, even among the different government agencies. The total number of vehicles in the city range from 3 to 3.2
million, with cars making up 72% of the fleet, vans and pickups comprising 20% and the rest made up of buses and trucks. The percentage of cars in the fleet has been rapidly increasing with rising personal wealth, growing at a rate much faster than population growth.
18 Connolly (1999)
The yearly vehicle fleet has grown at the rate of 10% in the period from 1976-1996, and according to census data from the year 2000, 40% of households in the DF and 30% of those in the EM owned at least one car or small van. The motorization rate in this period grew from 78 cars per thousand inhabitants to 166 cars per thousand inhabitants,
increasing by over 5% per year20.
FIGURE 2-6 Motorization index in the MCMA
study done by the International Association of Public Transport (UITP) of mobility st
21
ccording to the metropolitan transport authority COMETRAVI, annual traffic
tributed
Source: Comprehensive Program for Traffic and Transport, 2001-0 20 40 60 80 100 120 140 160 180 1930 1940 1950 1960 1970 1980 1990 2000
Number of Motor Vehicles per thousand inhabitants
2010, SETRAVI
A
indicators in a hundred cities around the world revealed that Mexico City has the highe car density rate in the continent, with 353 passenger cars per kilometer of roadway. This is much higher than Los Angeles, which has one of the highest density rates in the United States, with 141 cars/km. It is thus, not surprising that Mexico City is also considered one of the most polluted cities in the world, with an annual carbon monoxide exposure level of 152 kg/person, compared with 106.7 kg/person for Los Angeles .
A
externality costs are currently estimated to be $7 billion, with 85% of the costs at
20 SETRAVI – Comprehensive Program for Traffic and Transport, 2001-2010 21 UITP (2003)
to traffic congestion and accidents. COMETRAVI’s study22 has revealed other indicators
of high congestion levels. 74% of road intersections in the city are very congested (LOS F – the highest grade possible, showing traffic flows in excess of road capacity), with speeds below 20 kilometers per hour during peak hours. Average vehicle speeds in some parts are reported to be as low as 9 kilometers per hour23.
Public transportation, in the form of buses and the Metro, is most accessible in the central areas of the Federal District, with the municipalities of the State of Mexico facing limited access. The chief transportation options available to people in the EM are either private automobiles, or the low capacity privately operated minibuses called colectivos. It is the rapid increase in private automobiles and growth in colectivo traffic that has contributed most to traffic congestion in Mexico City, especially on the routes leading from the EM to the DF and on multiple nodes within the DF. The number of colectivos has increased due to the failure of the bus system and lack of growth in the Metro network in recent years. Figure 2-7 shows that the colectivos currently have the largest passenger trip mode share in the city.
FIGURE 2-7 Motorized Mode Share of Passenger Trips in the MCMA (1995)
Source: Gakenheimer and Zegras(2003) Taxi 9% Colectivo 47% Bus 8% Metro and Light Rail 14% Automobile 22% 22 COMETRAVI (1999) 23 Cervero (1998)
The following figure shows the evolution of mode shares in Mexico City in the last two decades, showing a significant shift from medium and high-capacity modes to low-capacity modes.
FIGURE 2-8 Evolution of Mode Shares in the DF (%)
Private Automobiles Taxis
Colectivos / Minibuses Metro
Light Rail, Trolley Bus Bus High Capacity Modes Medium Capacity Modes Low Capacity Modes
Source: Comprehensive Program for Traffic and Transport, 2001-2010, SETRAVI
2.5. Transport Emissions in Mexico City
Air pollution is a serious problem further aggravated by congestion, and low average speeds of traffic. About three-quarters of the road network in the DF has an average traffic speed lower than 20 km/hr, with traffic demand exceeding road capacity. In such congested conditions, all vehicles produce significantly higher emissions due to
frequently starting, stopping and idling in traffic. In addition, the age of the vehicle fleet is an important factor leading to high emissions. Inspection and maintenance records of vehicles in the DF show that 15% of the taxis and colectivos were nine years old or older in 1999. Of the 1.15 million private cars inspected, a sizeable 43% were models older than 1991, when no catalytic converters were required in vehicles24.
Private cars and taxis produce the most pollutants per passenger trip in the MCMA. They are responsible for most of the carbon monoxide emissions, and the highest proportions of nitrogen oxides and hydrocarbons. Private cars produce over half the total pollutants in the metropolitan area as shown in the table below.
TABLE 2-2 Mobile Sources Emissions Inventory 1997 (tons/year)
Source Particulates SO2 CO NOx HC Total %
Private Cars 87 2,474 1,327,858 40,151 97,510 1,468,080 53.4% Private Transit Operators 29 396 177,252 3,683 19,018 200,378 7.3%
Taxi Cabs 17 481 258,156 7,806 18,957 285,417 10.4%
State-owned buses 59 13 1,458 1,232 472 3,234 0.1%
Intercity and suburban buses 95 21 2,340 1,978 757 5,191 0.2% Privately operated buses 283 62 6,978 5,896 2,258 15,477 0.6% Light weight trucks 107 1,459 653,318 13,575 70,096 738,555 26.9% Heavy weight trucks 535 246 13,774 11,639 4,457 30,651 1.1% TOTAL 1,212 5,152 2,441,134 85,960 213,525 2,746,983 100.0% % Private Cars 7.2% 48.0% 54.4% 46.7% 45.7%
Source: Villegas-Lopez (2000)
The environmental and transportation agencies in the MCMA have made considerable efforts towards improving air quality in the city. The Hoy No Circula (No Driving Day) program was an important step in this direction. It was instituted to ban cars older than 1993 from circulation on at least two days of the week and cars with catalytic converters but older than 1999 on one day of the week. This program has had mixed results, but the metropolitan environmental authority is planning to modify it to make it more stringent with stricter enforcement.
The latest strategy for improving air quality (PROAIRE – 2002-2010) in the MCMA includes many measures related to transportation that are required to be implemented before 2010. These include introducing low-emission buses, substituting old taxis and colectivos, expanding the metro, light rail and trolley network, and constructing more roads to ease congestion. However, the implementation of these measures depends upon the respective institutions in the EM and the DF.
2.6. Institutional Structure
The institutional structure in Mexico City is complex due to the presence of different overlapping levels of government. These consist of the Federal government, the governments of the Federal District (DF) and the State of Mexico (EM), and the
Metropolitan government, for each area of intervention – transportation, land use, and the environment. Local governments such as those of the municipalities in the EM and delegaciones in the DF, international funding organizations, the private sector, especially infrastructure firms, private banks, real estate companies, universities, NGOs, labor unions, and private transit operators, are other actors playing active roles in the land use and transportation system that Mexico City represents.
Of the metropolitan organizations, while the metropolitan environmental commission (CAM) has considerable powers, the metropolitan transportation commission
(COMETRAVI) usually has limited decision-making power as it suffers from conflicts between the EM and the DF. It is therefore, not effective in implementing policies, even though it conducts detailed studies on the MCMA’s transportation system that inform policy-making. The transportation agencies of the DF (SETRAVI) and the EM (SCT) invest in their own jurisdictions with little coordination. For example, while the SETRAVI acknowledges that the metro network needs to expand into the EM on the north and northeast, it is not able to proceed due to the limited funding contribution of the EM. The federal transportation agency, the Secretariat of Communications and Transport, is actively involved in infrastructure construction, and is responsible for traffic
management and toll collections in the MCMA. In considering the application of
congestion pricing in the city, it is necessary to study the roles of the various institutions and their responsibilities in more depth. Since the institutions are tied to political
jurisdictions, there is bound to be a conflict of interests that must be dealt with.
2.7. Current Projects and Policies on the Urban Transport Agenda
In recent years, efforts to improve transportation in the MCMA have culminated in the approval of several projects at the urban and metropolitan level. It is these projects which, when completed, will dictate the future of travel demand in the region, and of land usedevelopments. Thus, it is important to track the development of these projects not only to assess travel demand but also to see where a demand restraint measure like congestion pricing might fit into the current agenda.
Both the DF and EM governments, as well as the federal government have planned many large scale transportation projects. These range from construction of a third and fourth ring road, to building elevated toll roads, metro expansions, dedicated bus corridors, improving and installing traffic signals and parking meters, and so on. According to the Mayor’s ‘high priority’ actions for 2004, investments of over 47 billion pesos will be made in the city’s transportation system, of which 6.4 billion pesos will be invested in the maintenance of the Metro, 3 billion to roadway and bridge projects, 885 million to the RTP bus system, and 582 million to the environment25. Extensions to the metro have been
postponed since the year 2000 due to limited availability of funds for capital investments. While the Mexican transportation authorities are investing in significant public transport improvements towards a general strategy of encouraging high capacity modes that can substitute travel by private modes, they are also actively investing in more roads and bridges to relieve congestion in the short term. Unless the public transport modes are made more attractive and private transport is made to bear its fair costs, it is unlikely that the motorization rate will stabilize. Some transportation projects, begun in the period 2003-2004 are described below, with their possible repercussions for congestion. 2.7.1. Public transport
In terms of public transport improvements, the DF proposes to extend three existing Metro lines, 4, 5 and 11, into the EM, and construct three new lines by 2020. Two Bus Rapid Transit lines are planned on the high demand corridors of Eje 8 Sur in the Estado de Mexico and Insurgentes Avenue in the DF. These are being funded by the World Bank and the United Nations Global Environment Facility and will be operated by private companies. Currently detailed modeling studies for these corridors are underway. To reduce truck traffic congestion in the busy DF areas, freight distribution centers or
‘logistics platforms’ are proposed on the outskirts of the DF26, along with regulations to
control freight traffic. Bus Rapid Transit
The first phase of Bus Rapid Transit system in the city, called “Metrobus”, includes corridors along Insurgentes and Popocatépetl (Eje 8 Sur) avenues, and will begin
operations in 2005. A total length of 200 km of bus corridors has been proposed. These metropolitan corridors will have segregated lanes in the center of the avenues as in Bogota, with pre-paid passenger boarding on high-platform buses with left-side doors. Bus stops will be located at intervals of 400 meters, and the buses will circulate at 20 km/hour27. The DF government expects a ridership of 225,000-232,000 passengers a day
on the Insurgentes corridor. The buses are meant to replace the colectivos on these corridors.
While the central lanes will be exclusively for the new buses, leading to one less lane for the other vehicular traffic, drivers will also gain the right lane that is used by colectivos at present, once they are replaced by the buses. The BRT corridors will be linked with the Metro network, and the colectivo routes that cross Insurgentes will serve as feeder routes. The DF government hopes to finish six routes by 2006, when the current mayor - Lopez Obrador’s term ends28. This is another positive development with respect to creating
better public transport alternatives in the city. Metro
Efforts are underway to improve the accessibility of trip destinations in the DF for residents in the Estado de Mexico. With the completion of the new Metro Line B in the year 2000, the EM municipalities to the northeast of the DF have improved access to the central areas of the city, with the line ending just north of the central business district at Buenavista station. The high ridership of about 320,000 passengers per day on this line is evidence of significant suburban demand.
26 Molina and Molina (2002)
27 El Independiente, p. 18 - Saturday, September 6, 2003 28 Reforma. p. 1B - Sunday, September 21, 2003
Government documents for transportation plans up to the year 2010 contain various figures of investments in the metro. The chief priority is to invest in maintenance of the metro and metro stations. Secretariat of Transport and Communications has approved funding to acquire 45 new trains and equipment. The stations are being rehabilitated, for example, the Pantitlan Station in the DF, which is the largest in Mexico City and sees heavy passenger volumes each day.
In addition, the DF authorities are considering the application of smart cards to modernize fare collection on the metro network. This will be especially important to integrate fares between the public transport modes within the DF. This technology would be used in the Metro, city buses, light rail and trolleybuses, as well as the BRT lines planned for Insurgentes and Eje 8 Sur, and will help improve the image of public transport in the city.
Colectivos
The fares on colectivos and concessioned buses have increased by 25%, and taxi fares are proposed to be 20% higher in 2004. Fares on government operated public transport, including the Metro, light rail, trolleys and buses have not been increased29. The DF
government is also taking aggressive action to substitute older buses, taxis and colectivos with new vehicle fleets that will have lower emissions. Not only are these changes expected to facilitate improvements in service and ridership, but the higher fares will increase the incomes of colectivo operators. The higher fares could help offset the increased costs of a congestion charge for colectivo operators, if congestion pricing is considered at a later stage. If discounts are given to the colectivos, these need to be considered carefully so as not to undermine the purpose of the congestion charge. The perception of crimes and insecurity on public transport is high in Mexico City, thus other measures are being taken to increase the attractiveness of public transport, such as the installation of centrally controlled security cameras in metro stations with high
passenger volumes such as Pantitlan station. Panic buttons will be installed in colectivo vehicles to improve passenger security and prevent assaults.
Tren Suburbano
The DF authorities have also begun the bidding process for the construction of a new suburban train (Tren Suburbano) that would run from Buenavista train station in the DF to the State of Mexico. The 25-km stretch would require an investment of US $600 million, distributed between the EM, the federal government, and private funds, with the DF only providing the necessary permits. The initial demand for the suburban train is projected at 320,000 daily passengers, with a trip time of 30 minutes, with service commencing in 200530. The Metro Line B is evidence that these investments in
improving public transport linkages between the DF and the EM can potentially lead to a substitution of colectivo trips, thereby reducing the need for lower income passengers to depend on this mode.
2.7.2. Private transport Parking Meters
Parking meters will be installed in the three central delegaciones of the DF- Benito Juarez, Cuauhtemoc and Miguel Hidalgo. The fare for parking meters in the DF will be 2 pesos per 15 minutes (US $0.80 for an hour). The delegacion Cuauhtemoc where the Centro Historico is located, is expected to collect 90 million pesos (US $ 9 million) in revenue annually, 80% of which would be used by the delegación to finance its various programs31. This is an important step to initiate the ‘culture of paying’ for road space in
congested areas. The second phase of the remodeling of the Centro Historico has also begun, which will include repair of streets and drainage systems, renovating the facades of historic buildings, improving the lighting, and removing street vendors32. The DF
government has been trying to evict street vendors from the Centro Historico for many years without success. The street vendors are low-income people who usually carry their merchandise in low-cost polluting private vehicles; thus they represent a group that
30 Reforma, October 15, 2003
31 Reforma. Wednesday, January 14, 2004 32 Reforma. Friday, January 16, 2004
stands to be disadvantaged by any possibility of congestion pricing. However, it can be argued that the Hoy No Circula program presents a far greater disadvantage in this regard by prohibiting the vendors’ livelihoods for one or two days in a week.
Construction of roads and highways
The current mayor of Mexico City favors significant investments in roads, bridges and highways. Ongoing projects include a system of elevated roads through the center of the city forming a 35-km ‘Metropolitan Corridor’ (Corredor Vial Metropolitano) linking the north and south of the city from Ciudad Azteca in the State of Mexico, to Xochimilco in the south of the DF. It will be built by 2005, and will run parallel to the Insurgentes Avenue. It is envisaged as an alternative to the Insurgentes, one of the most congested roads in the DF with an average speed of 18 km per hour during peak hours33.
Other efforts to divert traffic away from the city center include the construction of a 148-km Outer Ring Road in the State of Mexico, linking the highways of Mexico City to those of the surrounding crown cities of Queretaro, Pachuca and Puebla. This privately operated regional highway will serve as the fourth ring road and will allow 600,000 to 800,000 vehicles per day to bypass the DF along the north-east quadrant of the MCMA34.
A third ring road has already been partially constructed, with its northern portion operating as a toll road, about 25 km from the city center. These ring roads will be concentric with the existing Circuito Interior (Inner Ring Road) and the Periferico beltway around the DF, and are being constructed primarily to prevent inter-city traffic from passing through congested parts of the MCMA.
Road connections between the DF and the EM, as well as within the EM, will be
improved along with installation of traffic signals to manage the disorderly traffic in the EM. There is also a proposal to build elevated toll expressways on the most congested facilities in the DF. Apart from these projects, the controversial Segundos Pisos project to build a second level over the Periferico and Viaducto roads is already under construction.
33 Reforma. Sunday, January 11, 2004 34 Reforma. Tuesday, January 13, 2004
The strong focus on building more ring roads and metropolitan highways in Mexico City is evident from the recent investment budget for transportation activities shown in Table 2-3. Most of these projects are currently being implemented, and have been described above. With 62% of the overall budget devoted to elevated, highways, roads and
bypasses, it is likely that the steep growth in car use will continue in the MCMA. While it may be argued that some of these roads are essential to improve the links between the DF and the EM, those being constructed as a short-term approach to solve the city’s
congestion problem will end up being congested themselves after some years.
TABLE 2-3 Transportation Investment Budget for 2002
Transport Improvements Investment (million pesos) Percentage
Elevated highways 1,500 39% Other highways and bypasses 889 23%
Metro 1,054 27% New buses 155 4% New trolleys 103 3% New taxis 100 3% New minibuses 80 2% TOTAL 3,881 100%
Source: SETRAVI - Comprehensive Traffic and Transportation Plan (2001-2006)
In his popular book ‘Stuck in Traffic’, Downs has described the triple convergence principle35 of traveler behavior that occurs when new highways are constructed. It
comprises the effect of (i) drivers who used alternative routes earlier, switching to the new highway (spatial convergence), (ii) drivers who earlier traveled just outside the peak hours to avoid peak period congestion, starting to travel in the peak hours on the new highway (time convergence), and (iii) mode shift of some people from public
transportation to cars due to higher speeds possible on the new highway (mode
convergence). Triple convergence thus causes an increasing number of drivers to use the new highways, up to the point that they become congested to the same level that the alternate routes were.
The one remedy that avoids the effects of triple convergence is if some form of road pricing is implemented. In that case, congestion charges or peak period road tolls would lead to a reverse effect, that of triple divergence. Commuters formerly using certain facilities would change their route, time of travel, or mode, if a congestion toll were introduced. Zone-based congestion pricing added to high parking charges will together represent a cost that is higher than the value of time for many commuters, thus deterring them from driving into the congestion zone. A distance-based charge on driving is inequitable for many people in Mexico City, because lower income households live far from the city center.
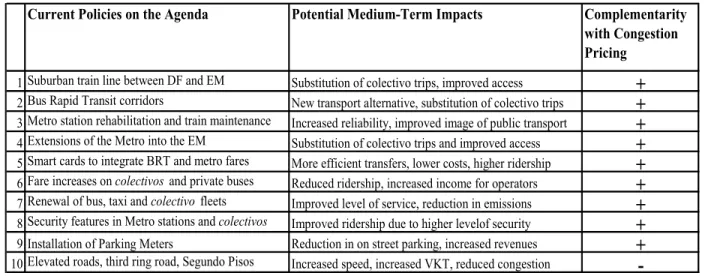
Table 2-4 summarizes the various transportation policies currently proposed in the MCMA. We see that while most of the policies on the agenda are complementary with congestion pricing, the one that is not, that of adding more capacity is also the one that demands the largest magnitude of public investment (see Figure 3-22).
TABLE 2-4 Summary of Current Transportation Policies Proposed in the MCMA
B M Sm Fa Se I Elevated ro
1 Suburban train line between DF and EM Substitution of colectivo trips, improved access + 2 us Rapid Transit corridors New transport alternative, substitution of colectivo trips + 3 etro station rehabilitation and train maintenance Increased reliability, improved image of public transport + 4 Extensions of the Metro into the EM Substitution of colectivo trips and improved access + 5 art cards to integrate BRT and metro fares More efficient transfers, lower costs, higher ridership + 6 re increases on colectivos and private buses Reduced ridership, increased income for operators + 7 Renewal of bus, taxi and colectivo fleets Improved level of service, reduction in emissions + 8 curity features in Metro stations and colectivos Improved ridership due to higher levelof security + 9 nstallation of Parking Meters Reduction in on street parking, increased revenues + 10 ads, third ring road, Segundo Pisos Increased speed, increased VKT, reduced congestion
-Current Policies on the Agenda Potential Medium-Term Impacts Complementarity with Congestion Pricing
Assuming that calculations to set the congestion charge are such that it accurately represents the marginal social costs drivers impose on society, the question for travelers would be whether they value their time more than the congestion charge or less. If their time value were higher, then they would pay the charge, and if not then they would choose to drive on congested roads. For those who value their time more, and also have relatively lower incomes, public transport would have to be efficient enough to not
restrict their mobility. A congestion charge would facilitate this by resulting in improved travel speed and reliability of road-based public transport. It is essential to convey to people that the congestion charge they would pay is the social cost of travel delays and congestion that each driver inflicts. Even if people are amenable to waiting in traffic, they impose costs on others that they must pay for.
A detailed explanation of congestion pricing, the economic and political issues
surrounding its implementation, and the reasons it is a controversial policy, are discussed in the next chapter.